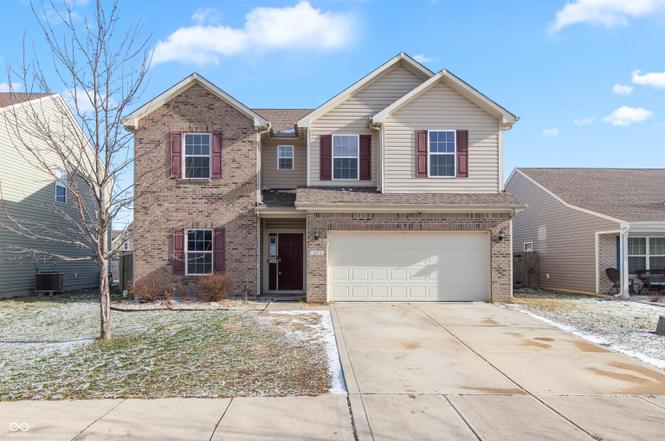
2471 Cabin Hill Rd · Cumberland, IN
Flood risk 1/10 · Minimal
- FEMA flood zone
- X (unshaded)
- Chance of flooding over 30 yrs
- 0.0%
- Est. flood insurance / yr
- $507 – $1,088
Fire risk 1/10 · Minimal
- Est. fire insurance / yr
- $717 – $1,331
Heat risk 4/10 · Minor
- Hot days now (above 101°F)
- 7 days/yr
- Hot days in 30 yrs
- 18 days/yr
Wind risk 2/10 · Minimal
- Chance of severe wind over 30 yrs
- 1.0%
Air-quality risk 2/10 · Minimal
- Unhealthy air days now
- 1 days/yr
- Unhealthy air days in 30 yrs
- 2 days/yr
Risk factors via First Street. Map © Google.
Why this score? — see what drove the D+ grade
The composite is a weighted blend of 9 inputs, each scored 0–100. Each bar is that input's sub-score; the figure is the points it added to the 100-point composite (weight × sub-score).
- ARV discount +15.0/15.0
- Cash flow +12.1/30.0
- Schools +4.1/10.0
- DSCR +3.6/10.0
- Rent growth +3.5/5.0
- 1% rule +3.1/10.0
- Livability +3.1/5.0
- Condition / age +2.5/5.0
- Appreciation +0.0/10.0
$273,000
🖨 Deal sheet 📄 Offer letter ✓ Due diligence
Listing remarks
Nestled at 2417 Cabin Hill RD, INDIANAPOLIS, IN, this single-family residence offers a blend of comfort and space that will delight. This property is ready to welcome you home. The residence offers four bedrooms, providing ample space for rest and relaxation, or for creating personalized spaces for hobbies and interests. You feel the openness once you enter the foyer. The two full bathrooms and one half bathroom mean no compromises are needed for morning routines or evening relaxation. With 2390 square feet of living area, there is plenty of room to spread out and enjoy everyday living or entertain friends. The 6621 square feet lot area includes a great fenced backyard! Built in 2016, this
Key facts
- Modern construction
- Thoughtful design
- Two story home
Tags
Property features AI
Finance
- Other: Mandatory fee ownership interest
- HOA & community: HOA with an annual fee of $410
Exterior
- Parking: Attached 2-car garage
- Utilities: Public water; Municipal sewer
- Home design: Single family residence; Two levels
- Construction: Vinyl with brick exterior; Slab foundation
- Exterior features: Lot under 1/4 acre
Interior
- Kitchen: Electric cooktop; Electric oven; Dishwasher; Microwave; Disposal; Refrigerator
- Bedrooms: 4 bedrooms (all on the upper level); Additional loft on the upper level
- Bathrooms: 2 full bathrooms (upper level); 1 half bathroom (main level)
- Heating & cooling: Electric forced air heating; Central air conditioning
- Interior features: Attic access; High ceilings; Kitchen island; Eat-in kitchen; Pantry; Walk-in closets
- Laundry & utility: Main level laundry room
Neighborhood map
What this means for you Summary
Snapshot
- This is a 4-bed/2.5-bath single-family listed at $273k.
Deal economics
- At list price, monthly cash flow is $-58 ($-701/yr) — negative.
- To cash-flow at today's rent, offer at most $263k (3.8% below list).
- To meet the 1% rule (rent ≥ 1% of price), the offer needs to be $221k (19.0% below list).
- Recommended offer: $221k (19.0% below list) — sets the bar for 1% rule.
- Cap rate 6.0% vs local median 3.8% in Cumberland — top-decile yield for the area; either an underpriced asset or a hidden risk that comps aren't pricing in. Stress-test before assuming the spread holds.
Location & tenants
- Location reads 62/100 on livability (#486 in IN) — a middle-class / working-renter tenant base. Strengths: cost of living A+, housing A+, employment A-; Watch: crime D+, schools F, amenities F.
- Mt Vernon Community School Corporation (rural): math 43% / reading 48% proficiency, ranked #70 of 301 in IN (top 23%) — families likely to look elsewhere, expect single-tenant / working-renter base with shorter leases; only 18% free/reduced lunch — higher-income household profile.
- Market conditions: Rents rising fast (+4.2%/yr); 36 active listings in the ZIP; 4 comparable units currently listed for rent nearby; rentals leasing fast (median 8d on market — plan ~1-2 weeks tenant-placement turnaround); 1,091 units permitted in Hancock County in 2024 (0 in 5+ unit buildings).
- This rent runs 43% of the median local income ($61k/yr) — at the standard rent-burdened threshold; future hikes will face affordability resistance.
Forward outlook
- Local home prices are declining (-3.0%/yr); year-one equity from $2k of loan paydown is wiped out by about $8k of value loss. Plan a longer hold.
- Hancock County population projected at +7% by 2050 — modest demand growth; plan on rents tracking national, not racing it.
Negotiation context
- It's been on market 120 days — a 9% lower offer ($248k) is reasonable based on typical stale-listing flexibility.
- 2 sale attempts with the ask held roughly flat each time — persistent listings suggest the price (not the market) is what's stuck; bring a comps-based counter.
Questions for the listing agent
- What do current leases actually rent for vs. the listed asking? Can we see a recent rent roll and the last 12 months of T-12 income?
- It's been on market 120 days. Have you received any prior offers? Is the seller open to a 19% concession, seller financing, or rate buy-down credit?
- What does the HOA fee cover, when was the last increase, and are there any pending special assessments or reserve-fund shortfalls?
- Why hasn't it sold? Are there any deal-killer items the seller is aware of (foundation, flood, title, zoning, code violations)?
- Is there a deadline driving the sale (1031 exchange, divorce, estate, relocation)? That informs how much negotiation room exists.
- Schools are F-rated, which usually means shorter tenancies and higher turnover. Who's the typical renter profile here, and what's been the actual vacancy rate?
- Crime grade is D in this area — have there been break-ins, vandalism, or insurance claims at this property in the last 3 years? What carrier currently insures it and at what premium?
- The area grade is low — what's the realistic commute time and amenity access for the typical tenant pool here? Any planned neighborhood developments (good or bad) we should know about?
- What's the average days-on-market for RENTAL listings here right now (not sales)? A rising rental-DOM trend means longer vacancies and softer asking-rent achievability than the comps imply.
- What's the recent tenant-quality profile in this submarket — average credit score on applications, eviction rate, late-payment / NSF rate, and stable-employment percentage? A property-management company in the area should have these aggregated.
- How much new for-sale + rental construction is in the pipeline within 1–3 miles? Heavy new supply typically softens prices + rents 12–24 months out; constrained supply supports both.
Investment metrics
- 1% rule
- 0.81% ✗
- Cap rate
- 6.04%
- Cash-on-cash
- -0.92%
- DSCR
- 0.96
- GRM
- 10.3
CMA / ARV
- ARV (on-the-fly)
- $356,110
- Comps found
- 12
Show comp detail 12 sales within ~0.75 mi
| Address | Dist | Beds/Ba | Sqft | Sold | Price | $/sf | Match |
|---|---|---|---|---|---|---|---|
| 7490 W Sacramento Dr | 0.15mi | 4/2.5 | 2,338 (-2%) | 4mo | $310,000 | $133 | 86 |
| 2536 Autumn Rd | 0.07mi | 4/2.5 | 2,244 (-6%) | 2mo | $295,000 | $131 | 85 |
| 12075 Country Side Dr | 0.34mi | 4/2.5 | 2,390 (0%) | 2mo | $288,000 | $121 | 82 |
| 12212 Huntington Cir | 0.54mi | 4/2.5 | 2,532 (+6%) | 1mo | $475,000 | $188 | 64 |
| 7448 W 100 North | 0.45mi | 3/2.5 (-1) | 2,250 (-6%) | 3mo | $335,000 | $149 | 62 |
| 2727 Autumn Rd | 0.26mi | 5/2.5 (+1) | 2,129 (-11%) | 4mo | $300,500 | $141 | 62 |
| 1057 N Cambridge Ct | 0.54mi | 4/2.5 | 2,581 (+8%) | 1mo | $475,000 | $184 | 60 |
| 7121 W 150 N | 0.47mi | 3/2.0 (-1) | 2,112 (-12%) | 1mo | $460,000 | $218 | 51 |
| 7110 W Meadows Ln | 0.73mi | 4/2.5 | 2,125 (-11%) | 1mo | $317,000 | $149 | 46 |
| 908 N Meadows Ln | 0.66mi | 5/3.0 (+1) | 2,194 (-8%) | 3mo | $365,000 | $166 | 46 |
| 1931 Lakeside Ln | 0.60mi | 3/2.0 (-1) | 2,154 (-10%) | 4mo | $325,000 | $151 | 45 |
| 7041 W Glendale Ln | 0.58mi | 3/2.0 (-1) | 2,104 (-12%) | 4mo | $295,000 | $140 | 43 |
Match score weights: distance 35% · size 25% · config 20% · recency 20%. Top-matched comps best support the ARV.
Projected returns pro-forma
-3.0% appreciation · 4.19% rent growth · sell at horizon
- IRR
- -16.6%
- Equity multiple
- 0.41×
- Total profit
- $-45,295
- Equity at exit
- $40,705
- IRR
- -6.4%
- Equity multiple
- 0.57×
- Total profit
- $-33,041
- Equity at exit
- $23,604
Cash invested: $76,440 (down + closing). Projections, not guarantees.
Landlord ↔ Tenant lean methodology
- Overall (STATE)
- 90 Strongly Landlord-Friendly
- State Indiana
- 90 Strongly Landlord-Friendly · R+11
- County
- — inherits STATE
- City
- — inherits STATE
ZIP-level market 46229
- Home prices YoY
- -28.3%
- Rents YoY
- 4.2%
- Active inventory
- 36
- Price-to-rent
- 10.3×
Monthly cashflow live
- Estimated rent
- $2,211 medium interval (Pro) →
- Mortgage (P&I)
- −$1,432
- Tax from tax record
- −$225 /mo · $2,704/yr
- Insurance
- −$114
- HOA
- −$34
- Vacancy / Maint / Mgmt
- −$464
- Net cashflow
- $-58
Break-even live
UW: 25.0% down · 7.5% · 30yr · 1.5% tax · 5.0% vac · 8.0% maint · 8.0% mgmt
Financing live
Cash to close
- Down payment
- $68,250
- Closing costs
- $8,190
- Reserves months
- —
- Total cash needed
- —
Loan-product check · same deal, 3 products live
Conventional
25% down · 7.5% · 30yr
- Down + closing
- —
- Monthly P&I
- —
- Monthly cashflow
- —
- DSCR
- —
- Eligible?
- —
Personal DTI + credit; lowest rate.
DSCR
20% down · 8.5% · 30yr
- Down + closing
- —
- Monthly P&I
- —
- Monthly cashflow
- —
- DSCR
- —
- Eligible?
- —
No personal income docs; deal must DSCR.
Hard money
10% down · 12.0% · 12mo
- Down + closing
- —
- Monthly P&I
- —
- Monthly cashflow
- —
- DSCR
- —
- Eligible?
- —
Short-term bridge; refi at stabilization.
Rent comps 4 comps
| Address | Beds | Baths | Sqft | Rent | $/sqft | DOM | Units | Dist |
|---|---|---|---|---|---|---|---|---|
| 2321 Allford Ct Indianapolis, IN | 4.0 | 2.5 | 2148 | $2,305 | $1.07 | 7d | 1 | 0.59mi |
| 2204 Valley Creek West Ln Indianapolis, IN | 4.0 | 2.0 | 1680 | $1,976 | $1.18 | 1d | 1 | 0.69mi |
| 1932 Herford Dr Indianapolis, IN | 3.0 | 2.0 | 1700 | $2,161 | $1.27 | 1d | 1 | 0.76mi |
| 1419 Mutz Dr Indianapolis, IN | 3.0 | 2.0 | 1788 | $1,775 | $0.99 | 20d | 1 | 1.44mi |
HOA detail
- Monthly dues
- $34 · $408/yr
Listing history 12 events
-
2026-06-18days on market $273,000 Active 120 DOM
-
2026-06-17days on market $273,000 Active 119 DOM
-
2026-06-16days on market $273,000 Active 118 DOM
-
2026-06-15days on market $273,000 Active 117 DOM
-
2026-06-13days on market $273,000 Active 115 DOM
-
2026-06-13status $273,000 Active 114 DOM
-
2026-05-03status Pending
-
2026-04-24status Active
-
2026-04-14status Pending
-
2026-03-24price $273,000
-
2026-01-26price $282,400
-
2025-12-29$284,900 Active
ⓘ Source: listings_history table (triggers on properties + properties_extension) + one-shot
backfill from property_details.listing_events for pre-trigger history.
Tax reassessment forecast IN · Partial reset (capped growth)
- Current annual tax
- $2,704 · $225/mo
- Projected year-2 tax
- $2,704 · $225/mo
- Expected delta
- $0/yr ($0/mo · 0.0%)
ⓘ Screening estimate from a state-policy table — verify with the county assessor before closing.
Climate risk First Street
- Flood 1/10 Low FEMA zone X (unshaded) · 0% chance over 30 yrs
- Wildfire 1/10 Low
- Heat 4/10 Moderate 7 d/yr ≥101°F today · 18 d/yr by 30 yrs out
- Wind 2/10 Low 100% chance of damaging wind over 30 yrs
- Air quality 2/10 Low 1 unhealthy d/yr today · 2 by 30 yrs out
Nearby sold comps map
Loading sold comps map…
Walkable amenities ~0.75 mi
Loading nearby amenities…
Taxation est. · year 1
- Rental income
- $26,526
- − Mortgage interest
- −$15,292
- − Property taxes
- −$2,704
- − Insurance
- −$1,365
- − Repairs & maintenance
- −$2,122
- − Management
- −$2,122
- − HOA
- −$408
- − Depreciation
- −$7,942
- Taxable loss
- −$5,429
- Est. tax savings @ 24.0%
- +$1,303
- After-tax cash flow
- $602/yr
For passive investors: Depreciation is non-cash, so a rental often shows a tax loss while cash-flowing — sheltering income. Rental losses are passive: they offset passive income freely, and up to $25,000/yr can offset ordinary (W-2) income if you actively participate and your MAGI is under $100k (phasing out to $0 by $150k); unused losses carry forward. On sale, claimed depreciation is recaptured at up to 25%, and gains may owe capital-gains tax (a 1031 exchange can defer both). Figures are a year-1 estimate at your 24.0% rate — not tax advice; consult a CPA.
Schools (NCES district)
- District
- Mt Vernon Community School Corporation
- NCES district ID
- 1807260
- Math proficiency
- 43% ▼ -12.00%
- Reading proficiency
- 48% ▼ -7.00%
- Median HH income
- $73,671
- Composite
- 41.3/100
- National rank
- #3514
- State rank
- #70 of 301 in IN
Livability — Cumberland
- Score
- 62/100
- State rank
- #486
- US rank
- #17302
Category grades
Schools grade is shown separately in the Schools card above.
Census & demographics
- Census place
- Cumberland, IN
- County
- Marion County · 998,460 people
- Metro
- Indianapolis-Carmel-Anderson, IN
- Population (ZIP)
- 28,457
- Household income
- $61,388
- Rent vs Own
- Severe rent burden
- 1257.0
Population outlook (Hancock County) Hauer SSP2
- Today (2025)
- 77,820 people
- By 2030
- 79,914 · +2.7%
- By 2040
- 82,734 · +6.3%
- By 2050
- 83,348 · +7.1%
- By 2075
- 82,439 · +5.9%
- By 2100
- 74,181 · -4.7%
Race, ethnicity, and origin ACS 2023
- Neighborhood character
- Diverse neighborhood (Simpson 0.63)
- Race & ethnicity
- Black 50% White 32% Hispanic / Latino 9% Two or more races 7% Asian 2%
- Hispanic origin (detail)
- Mexican 5%
- Common ancestry
- Italian 2% Romanian 1% Hispanic 1%
- Foreign-born
- 6% · Canada, Vietnam
- Languages at home
- 90% English-only · Spanish 6% Other Indo-European 1% French/Haitian/Cajun 1%
Political lean MEDSL · Hancock
- 2024 margin
- Solid R (+33.7) · D 32.2% · R 65.9% · Other 1.9%
- 2008→2024 swing
- -4.1pp toward R · 2008: -29.6pp · 2024: -33.7pp
- All cycles
- 2024: R+33.7 2020: R+37.5 2016: R+44.8 2012: R+41.0 2008: R+29.6
Not yet ingested
- Civics
- —
Market trends
- HPI YoY
- ▼ -92.07%
- Current HPI
- 233.1923
- Rent YoY
- ▲ 4.19%
- Metro
- Indianapolis-Carmel-Anderson, IN
- State GDP YoY
- ▲ 2.90%
- F500 in state
- 18
Industry mix (Fortune 500 HQ in IN)
| Industry | F500 HQs | Revenue |
|---|---|---|
| Industrial Machinery | 2 | $37B |
|
||
| Healthcare | 1 | $177B |
|
||
| Pharmaceuticals | 1 | $45B |
|
||
| Metals / Steel | 1 | $18B |
|
||
| Agriculture | 1 | $17B |
|
||
| Packaging | 1 | $12B |
|
||
Price history
-4.2% since first listed6 events — show timeline
- 2026-05-03 Pending — MIBOR as Distributed by MLS Grid
- 2026-04-24 Relisted — MIBOR as Distributed by MLS Grid
- 2026-04-14 Pending — MIBOR as Distributed by MLS Grid
- 2026-03-24 Price Changed $273,000 MIBOR as Distributed by MLS Grid
- 2026-01-26 Price Changed $282,400 MIBOR as Distributed by MLS Grid
- 2025-12-29 Listed $284,900 MIBOR as Distributed by MLS Grid
Property tax history
+44.4%/yrLatest (2025): $2,704 · -7.5% YoY. Source: county tax records.
Cash-flow waterfall
monthlySold comps — $/sqft
last 12 mo · ≤1 miLoading sold comps…