 Triplex
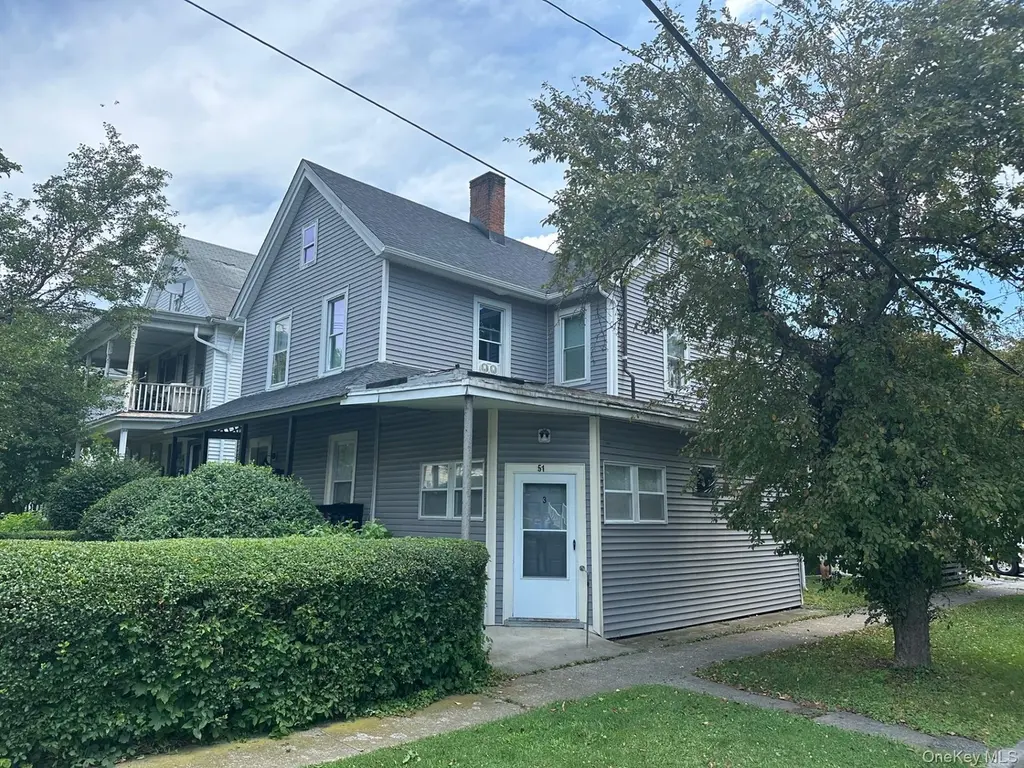
51 Worrall Ave · Poughkeepsie, NY
Flood risk No data
- FEMA flood zone
- —
- Chance of flooding over 30 yrs
- —
- Est. flood insurance / yr
- —
Fire risk No data
- Est. fire insurance / yr
- —
Heat risk No data
- Hot days now (above threshold)
- —
- Hot days in 30 yrs
- —
Wind risk No data
- Chance of severe wind over 30 yrs
- —
Air-quality risk No data
- Unhealthy air days now
- —
- Unhealthy air days in 30 yrs
- —
Risk factors via First Street. Map © Google.
Why this score? — see what drove the D+ grade
The composite is a weighted blend of 9 inputs, each scored 0–100. Each bar is that input's sub-score; the figure is the points it added to the 100-point composite (weight × sub-score).
- Cash flow +14.1/30.0
- ARV discount +13.1/15.0
- 1% rule +4.9/10.0
- DSCR +4.3/10.0
- Livability +3.9/5.0
- Rent growth +3.0/5.0
- Schools +3.0/10.0
- Condition / age +2.5/5.0
- Appreciation +0.0/10.0
$599,000
🖨 Deal sheet 📄 Offer letter ✓ Due diligence
Multi-family units
County records classify this as Multi-Family (2-4 Unit). Listing-text estimate: 3 units. confirmed
Listing remarks MLS
Well maintained 3 family home. New CO for residential was formally commercial. The units have been updated with stainless steal appliances, updated kitchens and baths. Brand new roof and hot water /heat on demand tank other two 2015. Off street and street parking. Live in one rent the other 2. Rents under market value. Taxes can be grieved. A must see.
Key facts
- Separate utilities
- Updates to kitchens
- Updates to flooring
Tags
Property features AI
Exterior
- Parking: Driveway; No carport
- Utilities: Central Hudson electric service; Natural gas connected; Public sewer; Public water connected; Cable connected; Phone connected; Trash collection (public)
- Home design: Triplex
- Construction: Vinyl siding construction
- Exterior features: Vinyl siding; Corner lot location (Worrall Ave & Grubb St.); Not waterfront
Interior
- Kitchen: Eat-in kitchen(s)
- Bedrooms: One 2-bedroom unit; One 3-bedroom unit
- Bathrooms: Three full bathrooms (total)
- Heating & cooling: Baseboard heating; Hot water heating; Natural gas heating; No central cooling
- Interior features: First-floor bedroom; First-floor full bathroom; Eat-in kitchen
- Laundry & utility: Basement with storage space and walk-out access; Unfinished basement
Neighborhood map
What this means for you Summary
Snapshot
- This is a 1×3bd/1.0ba + 1×2bd/1.0ba + 1×1bd/1.0ba units multifamily listed at $599k.
Deal economics
- At list price, monthly cash flow is $85 ($1k/yr) — positive. Per door: $28/mo.
- The deal already cash-flows at list — no discount required.
- To meet the 1% rule (rent ≥ 1% of price), the offer needs to be $595k (0.7% below list).
- Recommended offer: $581k (3.0% below list) — sets the bar for market timing.
- Cap rate 6.5% vs local median 3.4% in Poughkeepsie — top-decile yield for the area; either an underpriced asset or a hidden risk that comps aren't pricing in. Stress-test before assuming the spread holds.
Location & tenants
- Location reads 78/100 on livability (#165 in NY, #2,577 nationally) — a middle-class / working-renter tenant base. Strengths: commute A+, health & safety A+, housing A-; Watch: employment D+, crime F.
- Poughkeepsie City School District (suburban): math 29% / reading 42% proficiency, ranked #559 of 590 in NY (top 95%) — families likely to look elsewhere, expect single-tenant / working-renter base with shorter leases; 73% free/reduced lunch — lower-income household profile, screen leases tightly.
- Zoned schools: G W Krieger School (math 12% / reading 32%, grade F, #1,923 of 2,108 statewide, top 92%, 460 students, 78% FRL); Poughkeepsie Middle School (math 8% / reading 37%, grade F, #650 of 729 statewide, top 90%, 877 students, 82% FRL); Poughkeepsie High School (math 59% / reading 67%, grade B-, #819 of 1,100 statewide, top 74%, 1,165 students, 74% FRL).
- Market conditions: Rents rising (+2.0%/yr); 209 active listings in the ZIP; 8 comparable units currently listed for rent nearby; rentals at typical pace (median 21d on market — plan ~3-4 weeks tenant-placement turnaround); solid renter incomes; 620 units permitted in Dutchess County in 2024 (242 in 5+ unit buildings).
- At $5,950/mo this rent would consume 69% of the median local household income ($104k/yr) (locally 1404% of renters already pay >50% of income on rent) — very limited rent-growth headroom before tenants either downsize or default.
Forward outlook
- Local home prices are declining (-3.0%/yr); year-one equity from $4k of loan paydown is wiped out by about $18k of value loss. Plan a longer hold.
- Dutchess County population projected at -11% by 2050 — secular population decline; favor cash flow + early exit over multi-decade hold.
Negotiation context
- It's been on market 36 days — a 3% lower offer ($581k) is reasonable based on typical stale-listing flexibility.
- 11 sale attempts since 15y ago with the ask held roughly flat each time — persistent listings suggest the price (not the market) is what's stuck; bring a comps-based counter.
- Current owner paid $480k; 25% above their basis — modest negotiation headroom, anchor on the comps not their cost.
Risks & watch-outs
- Watch-outs: built in 1921 — expect roof / HVAC / electrical / plumbing capex.
Questions for the listing agent
- It's been on market 36 days. Have you received any prior offers? Is the seller open to a 3% concession, seller financing, or rate buy-down credit?
- Can we see the unit-by-unit rent roll, current vacancy, and any below-market leases? What's the average tenancy length?
- What capital expenditures (roof, boiler, parking lot, exteriors) have been made in the last 5 years, and what's planned in the next 2?
- Built in 1921 — when were the roof, HVAC, electrical panel, plumbing, and water heater last replaced?
- Is there a deadline driving the sale (1031 exchange, divorce, estate, relocation)? That informs how much negotiation room exists.
- Crime grade is F in this area — have there been break-ins, vandalism, or insurance claims at this property in the last 3 years? What carrier currently insures it and at what premium?
- The area grade is low — what's the realistic commute time and amenity access for the typical tenant pool here? Any planned neighborhood developments (good or bad) we should know about?
- What's the average days-on-market for RENTAL listings here right now (not sales)? A rising rental-DOM trend means longer vacancies and softer asking-rent achievability than the comps imply.
- What's the recent tenant-quality profile in this submarket — average credit score on applications, eviction rate, late-payment / NSF rate, and stable-employment percentage? A property-management company in the area should have these aggregated.
- How much new apartment / multifamily construction is in the pipeline within 1–3 miles? Heavy new supply (>2% of stock underway) typically softens rents 12–24 months out; light construction supports rent growth.
Investment metrics
- 1% rule
- 0.99% ✗
- Cap rate
- 6.46%
- Cash-on-cash
- 0.61%
- DSCR
- 1.03
- GRM
- 8.4
CMA / ARV
- ARV (median comp)
- $683,565
- List price
- $599,000
- Delta
- -12.37%
- Verdict
- UNDERPRICED
- Comps
- 20 within 1.0 mi
Show comp detail 12 sales within ~0.75 mi
| Address | Dist | Beds/Ba | Sqft | Sold | Price | $/sf | Match |
|---|---|---|---|---|---|---|---|
| 115 Fulton Ave | 0.30mi | 4/2.0 | 2,250 (+6%) | 6mo | $431,900 | $192 | 67 |
| 13 Springside Ave | 0.36mi | 4/2.0 | 2,032 (-4%) | 8mo | $281,500 | $139 | 66 |
| 47 Manitou Ave | 0.14mi | 4/2.0 | 1,976 (-7%) | 18mo | $400,000 | $202 | 64 |
| 30 S White St | 0.45mi | 5/2.0 (+1) | 2,100 (-1%) | 8mo | $380,000 | $181 | 62 |
| 23 Jewett Ave | 0.40mi | 4/2.0 | 2,000 (-6%) | 14mo | $395,000 | $198 | 56 |
| 412 Maple St | 0.70mi | 4/2.0 | 2,128 (+0%) | 15mo | $248,000 | $117 | 51 |
| 23 Musselman Dr | 0.50mi | 3/2.0 (-1) | 2,322 (+10%) | 4mo | $429,000 | $185 | 49 |
| 115 Innis Ave | 0.71mi | 4/2.0 | 2,328 (+10%) | 1mo | $375,000 | $161 | 45 |
| 20 N White St | 0.53mi | 4/2.0 | 2,322 (+10%) | 13mo | $445,000 | $192 | 44 |
| 164 Winnikee Ave | 0.66mi | 4/2.0 | 2,296 (+8%) | 10mo | $355,000 | $155 | 43 |
| 373 Church St | 0.38mi | 4/2.0 | 1,828 (-14%) | 19mo | $300,000 | $164 | 40 |
| 63 Lent St | 0.70mi | 4/2.0 | 2,344 (+11%) | 15mo | $275,000 | $117 | 33 |
Match score weights: distance 35% · size 25% · config 20% · recency 20%. Top-matched comps best support the ARV.
Projected returns pro-forma
-3.0% appreciation · 1.96% rent growth · sell at horizon
- IRR
- -16.6%
- Equity multiple
- 0.42×
- Total profit
- $-97,416
- Equity at exit
- $89,313
- IRR
- -10.4%
- Equity multiple
- 0.40×
- Total profit
- $-101,049
- Equity at exit
- $51,791
Cash invested: $167,720 (down + closing). Projections, not guarantees.
Landlord ↔ Tenant lean methodology
- Overall (STATE)
- 15 Strongly Tenant-Friendly
- State New York
- 15 Strongly Tenant-Friendly · D+10
- County
- — inherits STATE
- City
- — inherits STATE
ZIP-level market 12603
- Rents YoY
- 2.0%
- Active inventory
- 209
- Price-to-rent
- 22.6×
Monthly cashflow live
- Estimated rent
- $5,950 high interval (Pro) →
- Mortgage (P&I)
- −$3,141
- Tax from tax record
- −$1,224 /mo · $14,694/yr
- Insurance
- −$250
- HOA
- −$0
- Vacancy / Maint / Mgmt
- −$1,250
- Net cashflow
- $85
Break-even live
3-unit breakdown (identical units grouped — click to expand)
| Units | Beds | Baths | Est. rent |
|---|---|---|---|
| 1× unit | 3 | 1 | $2,205 |
| 1× unit | 2 | 1 | $1,964 |
| 1× unit | 1 | 1 | $1,781 |
| Total (3 units) | $5,950 | ||
UW: 25.0% down · 7.5% · 30yr · 1.5% tax · 5.0% vac · 8.0% maint · 8.0% mgmt
Financing live
Cash to close
- Down payment
- $149,750
- Closing costs
- $17,970
- Reserves months
- —
- Total cash needed
- —
Loan-product check · same deal, 3 products live
Conventional
25% down · 7.5% · 30yr
- Down + closing
- —
- Monthly P&I
- —
- Monthly cashflow
- —
- DSCR
- —
- Eligible?
- —
Personal DTI + credit; lowest rate.
DSCR
20% down · 8.5% · 30yr
- Down + closing
- —
- Monthly P&I
- —
- Monthly cashflow
- —
- DSCR
- —
- Eligible?
- —
No personal income docs; deal must DSCR.
Hard money
10% down · 12.0% · 12mo
- Down + closing
- —
- Monthly P&I
- —
- Monthly cashflow
- —
- DSCR
- —
- Eligible?
- —
Short-term bridge; refi at stabilization.
Rent comps 8 comps
| Address | Beds | Baths | Sqft | Rent | $/sqft | DOM | Units | Dist |
|---|---|---|---|---|---|---|---|---|
| 15 Hoffman Ave Unit 2 Poughkeepsie, NY | 3.0 | 1.0 | 1400 | $2,400 | $1.71 | 13d | 1 | 0.11mi |
| 8 Fox Ter Unit 1 Poughkeepsie, NY | 3.0 | 1.0 | 1450 | $2,200 | $1.52 | 43d | 1 | 0.44mi |
| 15 Forbus St Poughkeepsie, NY | 3.0 | 1.0 | 2140 | $2,500 | $1.17 | 23d | 1 | 0.65mi |
| 236 Mansion St #2 Poughkeepsie, NY | 3.0 | 1.0 | 2076 | $2,600 | $1.25 | 43d | 1 | 0.86mi |
| 50 Crestwood Blvd Poughkeepsie, NY | 3.0 | 2.0 | 1600 | $2,595 | $1.62 | 13d | 1 | 0.99mi |
| 1 Dean Pl Poughkeepsie, NY | 3.0 | 2.5 | 1700 | $4,000 | $2.35 | 13d | 1 | 1.26mi |
| 32 Salt Point Tpke Poughkeepsie, NY | 3.0 | 2.5 | 1761 | $3,000 | $1.70 | 21d | 1 | 1.31mi |
| 29 Carriage Hill Ln Poughkeepsie, NY | 4.0 | 2.5 | 2550 | $5,200 | $2.04 | 13d | 1 | 1.49mi |
Listing history 39 events
-
2026-06-18days on market $599,000 Active 36 DOM
-
2026-06-17days on market $599,000 Active 35 DOM
-
2026-06-16days on market $599,000 Active 34 DOM
-
2026-06-15days on market $599,000 Active 33 DOM
-
2026-06-14days on market $599,000 Active 31 DOM
-
2026-06-10days on market $599,000 Active 28 DOM
-
2026-06-09days on market $599,000 Active 27 DOM
-
2026-06-08days on market $599,000 Active 26 DOM
-
2026-06-07days on market $599,000 Active 25 DOM
-
2026-06-05days on market $599,000 Active 22 DOM
-
2026-06-03days on market $599,000 Active 21 DOM
-
2026-06-02days on market $599,000 Active 20 DOM
-
2026-06-01days on market $599,000 Active 19 DOM
-
2026-05-31days on market $599,000 Active 18 DOM
-
2026-05-30days on market $599,000 Active 17 DOM
-
2026-05-13$599,000 Active 460-char remark
-
2025-12-18historical $1,395
-
2025-12-07price $1,395
-
2025-11-05$1,450
-
2024-06-26soldstatus $480,000 Closed 358-char remark
Show marketing remark (358 chars)
Well maintained 3 family home. New CO for residential was formally commercial. The units have been updated with stainless steal appliances, updated kitchens and baths. Brand new roof and hot water /heat on demand tank other two 2015. Off street and street parking. Live in one rent the other 2. Rents under market value. Taxes can be grieved. A must see.
-
2024-06-01status Pending 358-char remark
Show marketing remark (358 chars)
Well maintained 3 family home. New CO for residential was formally commercial. The units have been updated with stainless steal appliances, updated kitchens and baths. Brand new roof and hot water /heat on demand tank other two 2015. Off street and street parking. Live in one rent the other 2. Rents under market value. Taxes can be grieved. A must see.
-
2024-04-02price $495,000 358-char remark
Show marketing remark (358 chars)
Well maintained 3 family home. New CO for residential was formally commercial. The units have been updated with stainless steal appliances, updated kitchens and baths. Brand new roof and hot water /heat on demand tank other two 2015. Off street and street parking. Live in one rent the other 2. Rents under market value. Taxes can be grieved. A must see.
-
2024-02-27$512,000 Active 358-char remark
Show marketing remark (358 chars)
Well maintained 3 family home. New CO for residential was formally commercial. The units have been updated with stainless steal appliances, updated kitchens and baths. Brand new roof and hot water /heat on demand tank other two 2015. Off street and street parking. Live in one rent the other 2. Rents under market value. Taxes can be grieved. A must see.
-
2019-08-26historical
-
2018-11-27$252,500
-
2018-07-12historical
-
2018-03-12$239,900
-
2018-03-11historical
-
2017-10-30$239,900
-
2017-09-10historical
-
2017-03-13$239,900
-
2012-07-12soldstatus $230,000
-
2012-07-12price $279,900
-
2012-07-12soldstatus $230,000
-
2012-07-12$279,900
-
2012-07-12$279,900
-
2012-04-17$229,900
-
2011-11-30historical
-
2011-05-21
ⓘ Source: listings_history table (triggers on properties + properties_extension) + one-shot
backfill from property_details.listing_events for pre-trigger history.
Tax reassessment forecast NY · Partial reset (capped growth)
- Current annual tax
- $14,694 · $1,224/mo
- Projected year-2 tax
- $14,694 · $1,224/mo
- Expected delta
- $0/yr ($0/mo · 0.0%)
ⓘ Screening estimate from a state-policy table — verify with the county assessor before closing.
Nearby sold comps map
Loading sold comps map…
Walkable amenities ~0.75 mi
Loading nearby amenities…
Taxation est. · year 1
- Rental income
- $71,400
- − Mortgage interest
- −$33,553
- − Property taxes
- −$14,694
- − Insurance
- −$2,995
- − Repairs & maintenance
- −$5,712
- − Management
- −$5,712
- − Depreciation
- −$17,425
- Taxable loss
- −$8,691
- Est. tax savings @ 24.0%
- +$2,086
- After-tax cash flow
- $3,109/yr
For passive investors: Depreciation is non-cash, so a rental often shows a tax loss while cash-flowing — sheltering income. Rental losses are passive: they offset passive income freely, and up to $25,000/yr can offset ordinary (W-2) income if you actively participate and your MAGI is under $100k (phasing out to $0 by $150k); unused losses carry forward. On sale, claimed depreciation is recaptured at up to 25%, and gains may owe capital-gains tax (a 1031 exchange can defer both). Figures are a year-1 estimate at your 24.0% rate — not tax advice; consult a CPA.
Schools (NCES district)
- District
- Poughkeepsie City School District
- NCES district ID
- 3623760
- Math proficiency
- 29% ▲ 5.00%
- Reading proficiency
- 42% ▲ 12.00%
- Median HH income
- $39,159
- Composite
- 29.68/100
- National rank
- #6459
- State rank
- #559 of 590 in NY
Livability — Poughkeepsie
- Score
- 78/100
- State rank
- #165
- US rank
- #2577
Category grades
Schools grade is shown separately in the Schools card above.
Census & demographics
- Census place
- Poughkeepsie, NY
- County
- Dutchess County · 188,048 people
- City population
- 86,468
- Metro
- Poughkeepsie-Newburgh-Middletown, NY
- Population (ZIP)
- 42,304
- Household income
- $103,538
- Rent vs Own
- Severe rent burden
- 1404.0
Population outlook (Dutchess County) Hauer SSP2
- Today (2025)
- 291,768 people
- By 2030
- 287,131 · -1.6%
- By 2040
- 274,881 · -5.8%
- By 2050
- 259,971 · -10.9%
- By 2075
- 235,366 · -19.3%
- By 2100
- 208,786 · -28.4%
Race, ethnicity, and origin ACS 2023
- Neighborhood character
- Majority White (65%)
- Race & ethnicity
- White 65% Hispanic / Latino 13% Black 11% Two or more races 8% Asian 6%
- Hispanic origin (detail)
- Mexican 4% Puerto Rican 4% Dominican 1%
- Common ancestry
- Romanian 4% Scotch-Irish 2% Iranian 1%
- Foreign-born
- 15% · Canada, China
- Languages at home
- 81% English-only · Spanish 8% Other Indo-European 4% German/W. Germanic 2%
Political lean MEDSL · Dutchess
- 2024 margin
- Lean D (+5.4) · D 52.7% · R 47.3%
- 2008→2024 swing
- -3.2pp toward R · 2008: 8.6pp · 2024: 5.4pp
- All cycles
- 2024: D+5.4 2020: D+9.6 2016: R+1.1 2012: D+6.6 2008: D+8.6
Not yet ingested
- Civics
- —
Market trends
- HPI YoY
- ▼ -377.61%
- Current HPI
- 252.7003
- Rent YoY
- ▲ 1.96%
- Metro
- Poughkeepsie-Newburgh-Middletown, NY
- State GDP YoY
- ▲ 2.60%
- F500 in state
- 92
Industry mix (Fortune 500 HQ in NY)
| Industry | F500 HQs | Revenue |
|---|---|---|
| Financial Services | 10 | $950B |
|
||
| Consumer Goods | 9 | $162B |
|
||
| Insurance | 4 | $225B |
|
||
| Telecommunications | 2 | $144B |
|
||
| Pharmaceuticals | 2 | $112B |
|
||
| Media / Entertainment | 2 | $69B |
|
||
Price history
+160.5% since first listed24 events — show timeline
- 2026-05-13 Listed $599,000 OneKey® MLS as Distributed by MLS Grid
- 2025-12-18 Rental Removed $1,395 SHOWMOJO
- 2025-12-07 Price Changed $1,395 SHOWMOJO
- 2025-11-05 Listed for Rent $1,450 SHOWMOJO
- 2024-06-26 Sold (MLS) $480,000 OneKey® MLS as Distributed by MLS Grid
- 2024-06-01 Pending — OneKey® MLS as Distributed by MLS Grid
- 2024-04-02 Price Changed $495,000 OneKey® MLS as Distributed by MLS Grid
- 2024-02-27 Listed $512,000 OneKey® MLS as Distributed by MLS Grid
- 2019-08-26 Listing Removed — OneKey® MLS as Distributed by MLS Grid
- 2018-11-27 Listed $252,500 OneKey® MLS as Distributed by MLS Grid
- 2018-07-12 Listing Removed — OneKey® MLS as Distributed by MLS Grid
- 2018-03-12 Listed $239,900 OneKey® MLS as Distributed by MLS Grid
- 2018-03-11 Listing Removed — OneKey® MLS as Distributed by MLS Grid
- 2017-10-30 Listed $239,900 OneKey® MLS as Distributed by MLS Grid
- 2017-09-10 Listing Removed — OneKey® MLS as Distributed by MLS Grid
- 2017-03-13 Listed $239,900 OneKey® MLS as Distributed by MLS Grid
- 2012-07-12 Listed $279,900 OneKey® MLS as Distributed by MLS Grid
- 2012-07-12 Listed $279,900 HGMLS
- 2012-07-12 Sold (MLS) $230,000 OneKey® MLS as Distributed by MLS Grid
- 2012-07-12 Price Changed $279,900 HGMLS
- 2012-07-12 Sold (MLS) $230,000 HGMLS
- 2012-04-17 Listed $229,900 OneKey® MLS as Distributed by MLS Grid
- 2011-11-30 Delisted — HGMLS
- 2011-05-21 Listed — HGMLS
Cash-flow waterfall
monthlySold comps — $/sqft
last 12 mo · ≤1 miLoading sold comps…