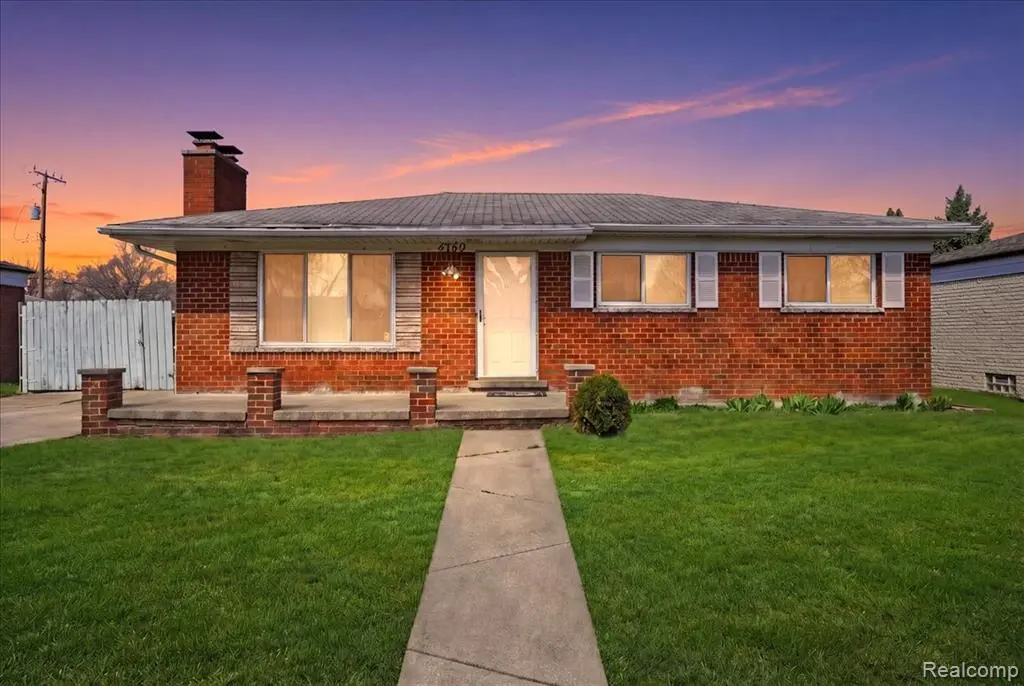
4759 Bernice Ave · Warren, MI
Flood risk 2/10 · Minimal
- FEMA flood zone
- X (unshaded)
- Chance of flooding over 30 yrs
- 0.03%
- Est. flood insurance / yr
- $473 – $860
Fire risk 1/10 · Minimal
- Est. fire insurance / yr
- $784 – $1,456
Heat risk 3/10 · Minor
- Hot days now (above 97°F)
- 7 days/yr
- Hot days in 30 yrs
- 15 days/yr
Wind risk 1/10 · Minimal
- Chance of severe wind over 30 yrs
- —
Air-quality risk 3/10 · Minor
- Unhealthy air days now
- 3 days/yr
- Unhealthy air days in 30 yrs
- 5 days/yr
Risk factors via First Street. Map © Google.
Why this score? — see what drove the F grade
The composite is a weighted blend of 9 inputs, each scored 0–100. Each bar is that input's sub-score; the figure is the points it added to the 100-point composite (weight × sub-score).
- ARV discount +11.3/15.0
- Cash flow +5.9/30.0
- Livability +3.7/5.0
- Rent growth +3.1/5.0
- Schools +2.5/10.0
- Condition / age +2.5/5.0
- 1% rule +1.5/10.0
- DSCR +0.3/10.0
- Appreciation +0.0/10.0
$214,900
🖨 Deal sheet (PDF) 📄 Offer letter ✓ Due diligence
Listing remarks MLS
$5000 Seller Concessions! Beautifully maintained, move-in ready turnkey 3-bedroom, 2 full bathroom home offering a comfortable and functional layout perfect for everyday living. Located in the heart of Warren, this home is conveniently situated right next to I-696 and near shopping, nearby places of worship, and gas stations, offering both comfort and accessibility in a desirable location. A bus stop is conveniently located on the street and the fully fenced backyard provides added privacy. The property features a semi-finished, remodeled basement with a full bathroom, providing additional living space ideal for guests, recreation, or extended use. BATVAI.
Key facts
- Move-in ready
- Remodeled basement
- Turnkey
Tags
Property features AI
Exterior
- Parking: Detached 2-car garage
- Utilities: Public water; Public sewer
- Home design: Single-family residence; One level; Ground-level entry; Brick construction
- Construction: Brick exterior
- Exterior features: Paved road access; Lot dimensions approximately 61 x 119 (0.17 acres)
Interior
- Bathrooms: Two full bathrooms
- Heating & cooling: Forced air heating; Natural gas heating; No central cooling
- Interior features: Partially finished basement; Basement present; Three total rooms
Neighborhood map
What this means for you Summary
Snapshot
- This is a 3-bed/1.5-bath single-family listed at $215k.
Deal economics
- At list price, monthly cash flow is $-421 ($-5k/yr) — negative.
- To cash-flow at today's rent, offer at most $141k (34.6% below list).
- To meet the 1% rule (rent ≥ 1% of price), the offer needs to be $139k (35.3% below list).
- Recommended offer: $139k (35.3% below list) — sets the bar for 1% rule.
- Cap rate 3.9% vs local median 5.2% in Warren — below-typical yield; the buyer is paying a premium for something (appreciation thesis, condition, location) that the cap rate doesn't capture.
Location & tenants
- Location reads 74/100 on livability (#171 in MI, #4,491 nationally) — a middle-class / working-renter tenant base. Strengths: commute A+, cost of living A+, housing A+; Watch: amenities D, employment D, crime D-.
- Warren Consolidated Schools (urban): math 18% / reading 39% proficiency, ranked #373 of 540 in MI (top 69%) — low school quality limits family demand, transient renter base, plan for 1-2y turnover.
- Zoned schools: Siersma Elementary School (math 32% / reading 47%, grade F, #606 of 1,397 statewide, top 48%, 426 students, 83% FRL); Beer Middle School (math 14% / reading 42%, grade F, #359 of 493 statewide, top 73%, 745 students, 76% FRL); Warren Mott High School (math 12% / reading 40%, grade F, #474 of 713 statewide, top 66%, 1,385 students, 73% FRL) — zoned schools average 77% FRL vs 48% district-wide (29 pts higher); higher-poverty schools than district average — tighter screening recommended.
- Market conditions: Rents rising (+2.4%/yr); 170 active listings in the ZIP; 4 comparable units currently listed for rent nearby; rentals lingering (median 46d on market — plan ~5-8 weeks vacancy on turnover, expect pricing pressure); 50% of comp listings sitting > 30 days — soft ceiling on asking rent; 1,321 units permitted in Macomb County in 2024 (86 in 5+ unit buildings).
- This rent runs 31% of the median local income ($54k/yr) — at the standard rent-burdened threshold; future hikes will face affordability resistance.
Forward outlook
- Local home prices are declining (-3.0%/yr); year-one equity from $1k of loan paydown is wiped out by about $6k of value loss. Plan a longer hold.
- Macomb County population projected at +9% by 2050 — modest demand growth; plan on rents tracking national, not racing it.
Negotiation context
- Only 10 days on market — expect competitive offers; lowballing is unlikely to land.
- 8 sale attempts since 11y ago with the ask held roughly flat each time — persistent listings suggest the price (not the market) is what's stuck; bring a comps-based counter.
- Current owner paid $109k; list at $215k implies a 97% gain — meaningful room to come down on a strong offer.
Questions for the listing agent
- What do current leases actually rent for vs. the listed asking? Can we see a recent rent roll and the last 12 months of T-12 income?
- Built in 1963 — when were the roof, HVAC, electrical panel, plumbing, and water heater last replaced?
- Is there a deadline driving the sale (1031 exchange, divorce, estate, relocation)? That informs how much negotiation room exists.
- Schools are D-rated, which usually means shorter tenancies and higher turnover. Who's the typical renter profile here, and what's been the actual vacancy rate?
- Crime grade is D in this area — have there been break-ins, vandalism, or insurance claims at this property in the last 3 years? What carrier currently insures it and at what premium?
- The area grade is low — what's the realistic commute time and amenity access for the typical tenant pool here? Any planned neighborhood developments (good or bad) we should know about?
- What's the average days-on-market for RENTAL listings here right now (not sales)? A rising rental-DOM trend means longer vacancies and softer asking-rent achievability than the comps imply.
- What's the recent tenant-quality profile in this submarket — average credit score on applications, eviction rate, late-payment / NSF rate, and stable-employment percentage? A property-management company in the area should have these aggregated.
- How much new for-sale + rental construction is in the pipeline within 1–3 miles? Heavy new supply typically softens prices + rents 12–24 months out; constrained supply supports both.
Investment metrics
- 1% rule
- 0.65% ✗
- Cap rate
- 3.94%
- Cash-on-cash
- -8.40%
- DSCR
- 0.63
- GRM
- 12.9
CMA / ARV
- ARV (median comp)
- $234,567
- List price
- $214,900
- Delta
- -7.96%
- Verdict
- FAIR
- Comps
- 20 within 1.0 mi
Show comp detail 12 sales within ~0.75 mi
| Address | Dist | Beds/Ba | Sqft | Sold | Price | $/sf | Match |
|---|---|---|---|---|---|---|---|
| 26379 Audrey Ave | 0.19mi | 3/2.0 | 1,000 (+5%) | 3mo | $215,000 | $215 | 79 |
| 27250 Haverhill Dr | 0.48mi | 3/1.0 | 963 (+1%) | 0mo | $219,000 | $227 | 74 |
| 26660 Crystal Ave | 0.14mi | 3/1.0 | 1,013 (+6%) | 15mo | $180,000 | $178 | 69 |
| 4578 Stratford Dr | 0.31mi | 3/1.5 | 927 (-3%) | 15mo | $220,000 | $237 | 68 |
| 26746 Grobbel Ave | 0.37mi | 3/2.0 | 1,031 (+8%) | 6mo | $255,000 | $247 | 63 |
| 4436 Buckingham Dr | 0.47mi | 3/1.5 | 985 (+3%) | 13mo | $239,000 | $243 | 62 |
| 26637 Curie Ave | 0.26mi | 3/1.0 | 1,037 (+8%) | 15mo | $200,000 | $193 | 59 |
| 5234 Andriths Ave | 0.31mi | 3/1.0 | 1,037 (+8%) | 13mo | $230,000 | $222 | 59 |
| 26885 Blackmar Ave | 0.48mi | 3/1.0 | 1,000 (+5%) | 17mo | $120,000 | $120 | 54 |
| 4266 Orr Ave | 0.61mi | 3/1.0 | 964 (+1%) | 17mo | $159,900 | $166 | 54 |
| 25882 Loretta Ave | 0.27mi | 3/1.0 | 1,068 (+12%) | 15mo | $175,000 | $164 | 53 |
| 27575 Strathmoor Dr Dr | 0.61mi | 3/1.0 | 1,040 (+9%) | 7mo | $225,000 | $216 | 49 |
Match score weights: distance 35% · size 25% · config 20% · recency 20%. Top-matched comps best support the ARV.
Projected returns pro-forma
-3.0% appreciation · 2.35% rent growth · sell at horizon
- IRR
- -31.8%
- Equity multiple
- -0.04×
- Total profit
- $-62,504
- Equity at exit
- $32,042
- IRR
- -39.8%
- Equity multiple
- -0.54×
- Total profit
- $-92,450
- Equity at exit
- $18,581
Cash invested: $60,172 (down + closing). Projections, not guarantees.
Landlord ↔ Tenant lean methodology
- Overall (STATE)
- 62 Landlord-Friendly
- State Michigan
- 62 Landlord-Friendly · EVEN
- County
- — inherits STATE
- City
- — inherits STATE
ZIP-level market 48091
- Rents YoY
- 2.4%
- Active inventory
- 170
- Price-to-rent
- 12.9×
Monthly cashflow live
- Estimated rent
- $1,390 medium interval (Pro) →
- Mortgage (P&I)
- −$1,127
- Tax from tax record
- −$303 /mo · $3,630/yr
- Insurance
- −$90
- HOA
- −$0
- Vacancy / Maint / Mgmt
- −$292
- Net cashflow
- $-421
Break-even live
Sensitivity live
| Price | -10% $-299 | -5% $-360 | +0% $-421 | +5% $-482 | +10% $-543 |
|---|---|---|---|---|---|
| Rent | -10% $-531 | -5% $-476 | +0% $-421 | +5% $-366 | +10% $-311 |
| Rate | -1.0pp $-313 | -0.5pp $-366 | base $-421 | +0.5pp $-477 | +1.0pp $-533 |
UW: 25.0% down · 7.5% · 30yr · 1.5% tax · 5.0% vac · 8.0% maint · 8.0% mgmt
Financing live
Cash to close
- Down payment
- $53,725
- Closing costs
- $6,447
- Reserves months
- —
- Total cash needed
- —
Loan-product check · same deal, 3 products live
Conventional
25% down · 7.5% · 30yr
- Down + closing
- —
- Monthly P&I
- —
- Monthly cashflow
- —
- DSCR
- —
- Eligible?
- —
Personal DTI + credit; lowest rate.
DSCR
20% down · 8.5% · 30yr
- Down + closing
- —
- Monthly P&I
- —
- Monthly cashflow
- —
- DSCR
- —
- Eligible?
- —
No personal income docs; deal must DSCR.
Hard money
10% down · 12.0% · 12mo
- Down + closing
- —
- Monthly P&I
- —
- Monthly cashflow
- —
- DSCR
- —
- Eligible?
- —
Short-term bridge; refi at stabilization.
Rent comps 4 comps
| Address | Beds | Baths | Sqft | Rent | $/sqft | DOM | Units | Dist |
|---|---|---|---|---|---|---|---|---|
| 4385 Frazho Rd Warren, MI | 1.0–2.0 | 1.0 | 825 | $1,305 | $1.58 | 5d | 6 | 0.36mi |
| 4652 E 10 Mile Rd Warren, MI | 2.0 | 1.0 | 950 | $1,200 | $1.26 | 45d | 1 | 0.81mi |
| 27489 Parkview Blvd Warren, MI | 1.0–2.0 | 1.0–1.5 | 850 | $1,465 | $1.72 | 1d | 11 | 1.25mi |
| 25005 Lawrence Ave Center Line, MI | 1.0–2.0 | 1.0–1.5 | 1000 | $955 | $0.95 | 45d | 1 | 1.48mi |
Listing history 36 events
-
2026-06-21days on market $214,900 Active 10 DOM
-
2026-06-18days on market $214,900 Active 7 DOM
-
2026-06-17days on market $214,900 Active 6 DOM
-
2026-06-16days on market $214,900 Active 5 DOM
-
2026-06-15remarks 664-char remark
-
2026-06-15pricedays on market $214,900 Active 4 DOM
-
2026-06-13pricedays on market $214,000 Active 2 DOM
-
2026-06-07days on market $215,900 Active 57 DOM
-
2026-06-04days on market $215,900 Active 54 DOM
-
2026-06-03days on market $215,900 Active 53 DOM
-
2026-06-02days on market $215,900 Active 52 DOM
-
2026-06-01days on market $215,900 Active 51 DOM
-
2026-05-31days on market $215,900 Active 50 DOM
-
2026-05-15price $219,900 638-char remark
-
2026-05-14price $219,900 638-char remark
-
2026-05-07price $227,900 638-char remark
-
2026-05-07price $227,900 638-char remark
-
2026-04-25price $229,900 638-char remark
-
2026-04-25price $229,900 638-char remark
-
2026-04-11$235,000 Active 638-char remark
-
2026-04-10$235,000 Active 638-char remark
-
2016-06-07soldstatus $109,000
-
2016-05-13soldstatus $109,000 Closed
-
2016-05-13soldstatus $109,000 Closed
-
2016-05-11historical
-
2016-03-21status Pending
-
2016-03-21historical
-
2016-03-02status Active
-
2016-02-29status Pending
-
2016-02-24status Active
-
2016-01-28status Pending
-
2016-01-05price $110,900
-
2015-12-03price $111,900
-
2015-11-19price $112,900
-
2015-11-05$114,900 Active
-
2015-11-05$110,900
ⓘ Source: listings_history table (triggers on properties + properties_extension) + one-shot
backfill from property_details.listing_events for pre-trigger history.
Tax reassessment forecast MI · Partial reset (capped growth)
- Current annual tax
- $3,630 · $303/mo
- Projected year-2 tax
- $3,630 · $303/mo
- Expected delta
- $0/yr ($0/mo · 0.0%)
ⓘ Screening estimate from a state-policy table — verify with the county assessor before closing.
Climate risk First Street
- Flood 2/10 Low FEMA zone X (unshaded) · 3% chance over 30 yrs
- Wildfire 1/10 Low
- Heat 3/10 Moderate 7 d/yr ≥97°F today · 15 d/yr by 30 yrs out
- Wind 1/10 Low
- Air quality 3/10 Moderate 3 unhealthy d/yr today · 5 by 30 yrs out
Nearby sold comps map
Loading sold comps map…
Walkable amenities ~0.75 mi
Loading nearby amenities…
Taxation est. · year 1
- Rental income
- $16,677
- − Mortgage interest
- −$12,038
- − Property taxes
- −$3,630
- − Insurance
- −$1,074
- − Repairs & maintenance
- −$1,334
- − Management
- −$1,334
- − Depreciation
- −$6,252
- Taxable loss
- −$8,985
- Est. tax savings @ 24.0%
- +$2,156
- After-tax cash flow
- $-2,897/yr
For passive investors: Depreciation is non-cash, so a rental often shows a tax loss while cash-flowing — sheltering income. Rental losses are passive: they offset passive income freely, and up to $25,000/yr can offset ordinary (W-2) income if you actively participate and your MAGI is under $100k (phasing out to $0 by $150k); unused losses carry forward. On sale, claimed depreciation is recaptured at up to 25%, and gains may owe capital-gains tax (a 1031 exchange can defer both). Figures are a year-1 estimate at your 24.0% rate — not tax advice; consult a CPA.
Schools (NCES district)
- District
- Warren Consolidated Schools
- NCES district ID
- 2635190
- Math proficiency
- 18% ▼ -14.00%
- Reading proficiency
- 39% ▼ -8.00%
- Median HH income
- $52,259
- Composite
- 25.09/100
- National rank
- #7533
- State rank
- #373 of 540 in MI
Livability — Warren
- Score
- 74/100
- State rank
- #171
- US rank
- #4491
Category grades
Schools grade is shown separately in the Schools card above.
Census & demographics
- Census place
- Warren, MI
- County
- Macomb County · 638,552 people
- City population
- 114,937
- Metro
- Detroit-Warren-Dearborn, MI
- Population (ZIP)
- 30,696
- Household income
- $54,230
- Rent vs Own
- Severe rent burden
- 1296.0
Population outlook (Macomb County) Hauer SSP2
- Today (2025)
- 925,296 people
- By 2030
- 948,226 · +2.5%
- By 2040
- 983,961 · +6.3%
- By 2050
- 1,010,200 · +9.2%
- By 2075
- 1,076,222 · +16.3%
- By 2100
- 1,077,065 · +16.4%
Race, ethnicity, and origin ACS 2023
- Neighborhood character
- Diverse neighborhood (Simpson 0.68)
- Race & ethnicity
- White 47% Black 25% Asian 19% Two or more races 5% Hispanic / Latino 3% Native American 2%
- Common ancestry
- Romanian 7% Lithuanian 2% Slovak 1%
- Foreign-born
- 16% · Canada
- Languages at home
- 77% English-only · Other Indo-European 14% Other Asian/Pacific 3% Russian/Polish/Slavic 2%
Political lean MEDSL · Macomb
- 2024 margin
- R (+13.7) · D 42.2% · R 55.9% · Other 1.9%
- 2008→2024 swing
- -22.3pp toward R · 2008: 8.6pp · 2024: -13.7pp
- All cycles
- 2024: R+13.7 2020: R+8.1 2016: R+11.6 2012: D+4.0 2008: D+8.6
Not yet ingested
- Civics
- —
Market trends
- HPI YoY
- ▼ -199.66%
- Current HPI
- 177.9273
- Rent YoY
- ▲ 2.35%
- Metro
- Detroit-Warren-Dearborn, MI
- State GDP YoY
- ▲ 1.37%
- F500 in state
- 28
Industry mix (Fortune 500 HQ in MI)
| Industry | F500 HQs | Revenue |
|---|---|---|
| Automotive Parts | 3 | $48B |
|
||
| Automotive | 2 | $372B |
|
||
| Chemicals | 1 | $45B |
|
||
| Automotive Retail | 1 | $29B |
|
||
| Healthcare / Medical Devices | 1 | $23B |
|
||
| Automotive Technology | 1 | $20B |
|
||
Price history
+93.8% since first listed31 events — show timeline
- 2026-06-14 Price Changed $214,900 REALCOMP
- 2026-06-14 Price Changed $214,900 MiRealSource-MiMLS
- 2026-06-11 Listed $214,000 REALCOMP
- 2026-06-11 Listed $214,000 MiRealSource-MiMLS
- 2026-06-07 Listing Removed — MiRealSource-MiMLS
- 2026-06-07 Listing Removed — REALCOMP
- 2026-05-29 Price Changed $215,900 MiRealSource-MiMLS
- 2026-05-28 Price Changed $215,900 REALCOMP
- 2026-05-15 Price Changed $219,900 MiRealSource-MiMLS
- 2026-05-14 Price Changed $219,900 REALCOMP
- 2026-05-07 Price Changed $227,900 MiRealSource-MiMLS
- 2026-05-07 Price Changed $227,900 REALCOMP
- 2026-04-25 Price Changed $229,900 MiRealSource-MiMLS
- 2026-04-25 Price Changed $229,900 REALCOMP
- 2026-04-11 Listed $235,000 REALCOMP
- 2026-04-10 Listed $235,000 MiRealSource-MiMLS
- 2016-06-07 Sold (Public Records) $109,000 Public Records
- 2016-05-13 Sold (MLS) $109,000 REALCOMP
- 2016-05-13 Sold (MLS) $109,000 MiRealSource-MiMLS
- 2016-05-11 Listing Removed — REALCOMP
- 2016-03-21 Pending — MiRealSource-MiMLS
- 2016-03-21 Listing Removed — REALCOMP
- 2016-03-02 Relisted — MiRealSource-MiMLS
- 2016-02-29 Pending — MiRealSource-MiMLS
- 2016-02-24 Relisted — MiRealSource-MiMLS
- 2016-01-28 Pending — MiRealSource-MiMLS
- 2016-01-05 Price Changed $110,900 MiRealSource-MiMLS
- 2015-12-03 Price Changed $111,900 MiRealSource-MiMLS
- 2015-11-19 Price Changed $112,900 MiRealSource-MiMLS
- 2015-11-05 Listed $114,900 MiRealSource-MiMLS
- 2015-11-05 Listed $110,900 REALCOMP
Property tax history
+5.6%/yrLatest (2025): $3,630 · +2.2% YoY. Source: county tax records.
Cash-flow waterfall
monthlySold comps — $/sqft
last 12 mo · ≤1 miLoading sold comps…