 🌊 Lakefront
949 VT Route 105 · Derby Center, VT
Flood risk 5/10 · Moderate
- FEMA flood zone
- A
- Chance of flooding over 30 yrs
- 0.26%
- Est. flood insurance / yr
- $946 – $6,584
Fire risk 1/10 · Minimal
- Est. fire insurance / yr
- $480 – $892
Heat risk 1/10 · Minimal
- Hot days now (above 87°F)
- 7 days/yr
- Hot days in 30 yrs
- 17 days/yr
Wind risk 2/10 · Minimal
- Chance of severe wind over 30 yrs
- 3.0%
Air-quality risk 2/10 · Minimal
- Unhealthy air days now
- 1 days/yr
- Unhealthy air days in 30 yrs
- 1 days/yr
Risk factors via First Street. Map © Google.
Why this score? — see what drove the B grade
The composite is a weighted blend of 9 inputs, each scored 0–100. Each bar is that input's sub-score; the figure is the points it added to the 100-point composite (weight × sub-score).
- Cash flow +29.8/30.0
- DSCR +10.0/10.0
- 1% rule +8.0/10.0
- ARV discount +7.5/15.0
- Appreciation +6.4/10.0
- Schools +5.0/10.0
- Livability +2.9/5.0
- Rent growth +2.5/5.0
- Condition / age +2.5/5.0
$115,000
🖨 Deal sheet 📄 Offer letter ✓ Due diligence
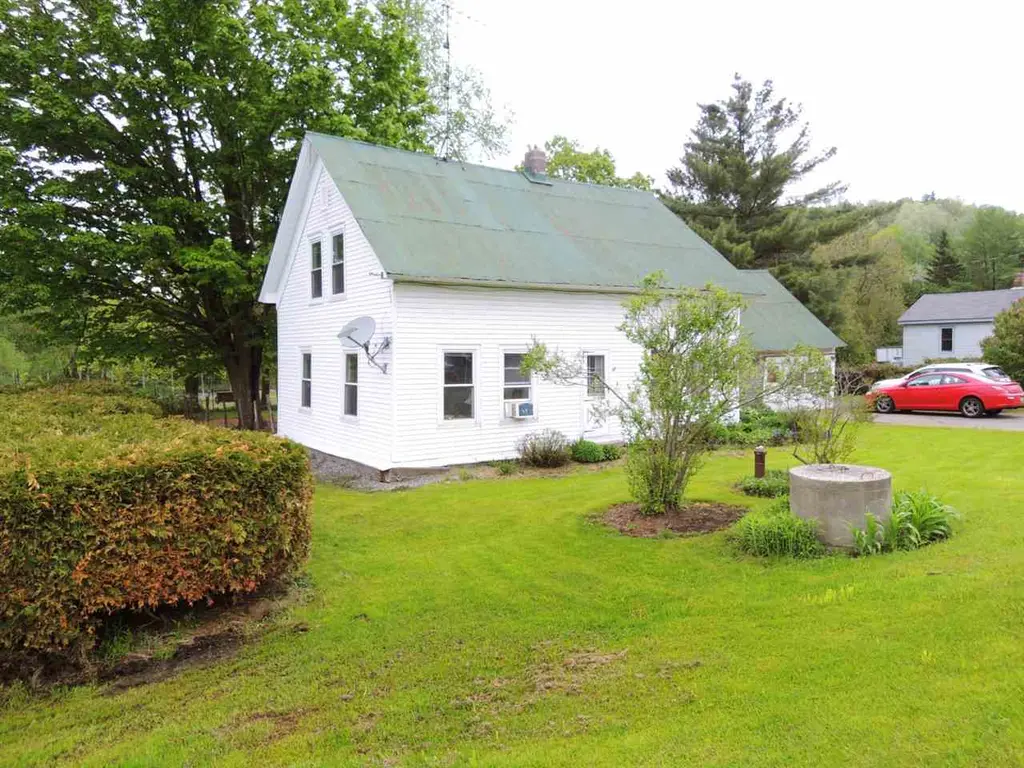
Listing remarks
On the banks of the mighty Clyde River with an amazing backyard!! This 4-bed, 1-bath home has been loved by current owner for 52 years!! Updated thermo windows, HB Smith oil boiler and awesome storage. Home is quite comfortable but could use your own finishing touches. The 110' on the river offer a park-like setting where you can fish and swim from your lawn! Park your lawn chair on the edge and catch dinner! Owner has drilled a well and installed new septic during her ownership. First floor bath, laundry and master bedroom with 3 more bedroom upstairs. So close to Derby and Newport, convenient location. VAST trails and all the local lakes close by; recreation central! Attached 1-car garage
Key facts
- Park like setting
- New septic
- Convenient location
Tags
Property features AI
Exterior
- Parking: 1-car garage; Gravel driveway
- Utilities: Drilled well water source; Private on-site septic (concrete 1000-gallon tank with leach field); 100 Amp electrical service with circuit breakers; Cable internet available; Telephone service available
- Home design: Cape-style home; Existing structure; White exterior color; Metal roof
- Construction: Built circa 1900; Wood frame construction with shingle siding and vinyl exterior
- Exterior features: Country setting with river frontage and direct water access; Water view of the Clyde River; Waterfront with exclusively owned waterfront rights
Interior
- Kitchen: Gas range; Refrigerator
- Bathrooms: 1 full bathroom
- Heating & cooling: Oil heat with baseboard and hot water distribution; Multi-zone heating
- Interior features: 11 total rooms; Full basement with concrete floor, crawl space, interior stairs and sump pump
- Laundry & utility: Oil water heater (owned); Boiler-fed water heater
Neighborhood map
What this means for you Summary
Snapshot
- This is a 4-bed/1.0-bath single-family listed at $115k.
Deal economics
- At list price, monthly cash flow is $108 ($1k/yr) — positive.
- The deal already cash-flows at list — no discount required.
- Meets the 1% rule at list price ($1k rent vs $115k).
Location & tenants
- Location reads 57/100 on livability (#107 in VT) — a working-class tenant base; expect higher turnover. Strengths: cost of living A, housing A-; Watch: employment D, schools F, amenities F.
- Market conditions: 5 active listings in the ZIP; 157 units permitted in Orleans County in 2024 (107 in 5+ unit buildings).
Forward outlook
- In year one you build about $4k of equity ($795 loan paydown + $3k appreciation (2.9% local appreciation)).
- Orleans County population projected at -19% by 2050 — secular population decline; favor cash flow + early exit over multi-decade hold.
- At projected returns (2.9% appreciation + 3.0% rent growth), your $32k cash investment doubles in ~6 years — after that, you're playing with house money.
- By year 8, paydown + projected appreciation supports a ~$31k cash-out refi (75% LTV) — recoverable capital for the next deal without selling this one.
Negotiation context
- Only 4 days on market — expect competitive offers; lowballing is unlikely to land.
Risks & watch-outs
- Watch-outs: flood insurance adds $314/mo; built in 1900 — expect roof / HVAC / electrical / plumbing capex.
- Climate carrying-cost: in FEMA flood zone A (mandatory federal flood insurance) — expect insurance premiums to compound above CPI over the hold.
Questions for the listing agent
- Built in 1900 — when were the roof, HVAC, electrical panel, plumbing, and water heater last replaced?
- What's the actual annual flood-insurance premium (NFIP or private), and is the property in a SFHA with mandatory coverage?
- Is there a deadline driving the sale (1031 exchange, divorce, estate, relocation)? That informs how much negotiation room exists.
- Schools are F-rated, which usually means shorter tenancies and higher turnover. Who's the typical renter profile here, and what's been the actual vacancy rate?
- This sits on a lake — are riparian / water-frontage rights deeded with the parcel? Any dock permits, shoreline easements, or HOA water-use restrictions?
- What's the documented flood / surge / shoreline-erosion history here (FEMA AND non-FEMA — e.g., storm surge, creek backup, septic-field saturation)?
- Any water-quality or seasonal algae-bloom issues that affect tenant satisfaction or short-term-rental demand?
- What's the average days-on-market for RENTAL listings here right now (not sales)? A rising rental-DOM trend means longer vacancies and softer asking-rent achievability than the comps imply.
- What's the recent tenant-quality profile in this submarket — average credit score on applications, eviction rate, late-payment / NSF rate, and stable-employment percentage? A property-management company in the area should have these aggregated.
- How much new for-sale + rental construction is in the pipeline within 1–3 miles? Heavy new supply typically softens prices + rents 12–24 months out; constrained supply supports both.
Investment metrics
- 1% rule
- 1.30% ✓
- Cap rate
- 10.70%
- Cash-on-cash
- 15.73%
- DSCR
- 1.70
- GRM
- 6.4
CMA / ARV
- ARV (on-the-fly)
- $370,172
- Comps found
- 1
Show comp detail 1 sale within ~0.75 mi
| Address | Dist | Beds/Ba | Sqft | Sold | Price | $/sf | Match |
|---|---|---|---|---|---|---|---|
| 181 Corkins Rd | 0.33mi | 3/1.5 (-1) | 1,994 (+1%) | 12mo | $374,900 | $188 | 66 |
Match score weights: distance 35% · size 25% · config 20% · recency 20%. Top-matched comps best support the ARV.
Projected returns pro-forma
2.9% appreciation · 3.0% rent growth · sell at horizon
- IRR
- 11.1%
- Equity multiple
- 1.63×
- Total profit
- $20,310
- Equity at exit
- $51,039
- IRR
- 13.4%
- Equity multiple
- 2.98×
- Total profit
- $63,705
- Equity at exit
- $78,139
Cash invested: $32,200 (down + closing). Projections, not guarantees.
Landlord ↔ Tenant lean methodology
- Overall (STATE)
- 41 Moderately Tenant-Leaning
- State Vermont
- 41 Moderately Tenant-Leaning · D+15
- County
- — inherits STATE
- City
- — inherits STATE
ZIP-level market 05872
- Home prices YoY
- 1.7%
- Active inventory
- 5
- Price-to-rent
- 6.4×
Monthly cashflow live
- Estimated rent
- $1,490 medium interval (Pro) →
- Mortgage (P&I)
- −$603
- Tax from tax record
- −$104 /mo · $1,253/yr
- Insurance
- −$48
- Flood insurance flood zone
- −$314 /mo · $3,765/yr
- HOA
- −$0
- Vacancy / Maint / Mgmt
- −$313
- Net cashflow
- $108
Break-even live
UW: 25.0% down · 7.5% · 30yr · 1.5% tax · 5.0% vac · 8.0% maint · 8.0% mgmt
Financing live
Cash to close
- Down payment
- $28,750
- Closing costs
- $3,450
- Reserves months
- —
- Total cash needed
- —
Loan-product check · same deal, 3 products live
Conventional
25% down · 7.5% · 30yr
- Down + closing
- —
- Monthly P&I
- —
- Monthly cashflow
- —
- DSCR
- —
- Eligible?
- —
Personal DTI + credit; lowest rate.
DSCR
20% down · 8.5% · 30yr
- Down + closing
- —
- Monthly P&I
- —
- Monthly cashflow
- —
- DSCR
- —
- Eligible?
- —
No personal income docs; deal must DSCR.
Hard money
10% down · 12.0% · 12mo
- Down + closing
- —
- Monthly P&I
- —
- Monthly cashflow
- —
- DSCR
- —
- Eligible?
- —
Short-term bridge; refi at stabilization.
Listing history 5 events
-
2026-06-08statusdays on market $115,000 Pending 4 DOM
-
2026-06-07days on market $115,000 Active 3 DOM
-
2026-06-05days on market $115,000 Active 2 DOM
-
2026-06-04remarks 699-char remark
-
2026-06-04$115,000 Active 1 DOM
ⓘ Source: listings_history table (triggers on properties + properties_extension) + one-shot
backfill from property_details.listing_events for pre-trigger history.
Tax reassessment forecast VT · Partial reset (capped growth)
- Current annual tax
- $1,253 · $104/mo
- Projected year-2 tax
- $1,719 · $143/mo
- Expected delta
- +$466/yr (+$39/mo · 37.2%)
ⓘ Screening estimate from a state-policy table — verify with the county assessor before closing.
Climate risk First Street
- Flood 5/10 Major FEMA zone A · 26% chance over 30 yrs
- Wildfire 1/10 Low
- Heat 1/10 Low 7 d/yr ≥87°F today · 17 d/yr by 30 yrs out
- Wind 2/10 Low 3% chance of damaging wind over 30 yrs
- Air quality 2/10 Low 1 unhealthy d/yr today · 1 by 30 yrs out
Nearby sold comps map
Loading sold comps map…
Walkable amenities ~0.75 mi
Loading nearby amenities…
Taxation est. · year 1
- Rental income
- $17,885
- − Mortgage interest
- −$6,442
- − Property taxes
- −$1,253
- − Insurance
- −$4,340
- − Repairs & maintenance
- −$1,431
- − Management
- −$1,431
- − Depreciation
- −$3,345
- Taxable loss
- −$357
- Est. tax savings @ 24.0%
- +$86
- After-tax cash flow
- $1,385/yr
For passive investors: Depreciation is non-cash, so a rental often shows a tax loss while cash-flowing — sheltering income. Rental losses are passive: they offset passive income freely, and up to $25,000/yr can offset ordinary (W-2) income if you actively participate and your MAGI is under $100k (phasing out to $0 by $150k); unused losses carry forward. On sale, claimed depreciation is recaptured at up to 25%, and gains may owe capital-gains tax (a 1031 exchange can defer both). Figures are a year-1 estimate at your 24.0% rate — not tax advice; consult a CPA.
Schools (NCES district)
No district data.
Livability — Derby Center
- Score
- 57/100
- State rank
- #107
- US rank
- #21814
Category grades
Schools grade is shown separately in the Schools card above.
Census & demographics
- Population (ZIP)
- 766
Population outlook (Orleans County) Hauer SSP2
- Today (2025)
- 26,222 people
- By 2030
- 25,399 · -3.1%
- By 2040
- 23,350 · -11.0%
- By 2050
- 21,232 · -19.0%
- By 2075
- 16,543 · -36.9%
- By 2100
- 11,566 · -55.9%
Race, ethnicity, and origin ACS 2023
- Neighborhood character
- Predominantly White (96%)
- Race & ethnicity
- White 96% Hispanic / Latino 2% Two or more races 1%
- Common ancestry
- Lithuanian 6% Iranian 6% Scotch-Irish 4%
- Foreign-born
- 5% · Canada, Jamaica
- Languages at home
- 93% English-only · French/Haitian/Cajun 4% Spanish 2%
Political lean MEDSL · Orleans
- 2024 margin
- Toss-up / Even · D 47.8% · R 49.4% · Other 2.8%
- 2008→2024 swing
- -29.1pp toward R · 2008: 27.5pp · 2024: -1.6pp
- All cycles
- 2024: R+1.6 2020: D+4.5 2016: D+0.2 2012: D+24.2 2008: D+27.5
Not yet ingested
- Civics
- —
Market trends
- HPI YoY
- ▲ 2.90%
- Current HPI
- 171.1193
- Rent YoY
- —
- Metro
- —
- State GDP YoY
- —
- F500 in state
- 0
Price history
+58.6% since first listed4 events — show timeline
- 2026-06-03 Listed $115,000 PrimeMLS
- 2019-09-13 Price Changed $65,000 PrimeMLS
- 2019-08-31 Price Changed $70,000 PrimeMLS
- 2019-08-17 Price Changed $72,500 PrimeMLS
Property tax history
+21.5%/yrLatest (2024): $1,253 · +12.0% YoY. Source: county tax records.
Cash-flow waterfall
monthlySold comps — $/sqft
last 12 mo · ≤1 miLoading sold comps…