154 Orange Flame Blvd · Uhland, TX
Flood risk No data
- FEMA flood zone
- —
- Chance of flooding over 30 yrs
- —
- Est. flood insurance / yr
- —
Fire risk No data
- Est. fire insurance / yr
- —
Heat risk No data
- Hot days now (above threshold)
- —
- Hot days in 30 yrs
- —
Wind risk No data
- Chance of severe wind over 30 yrs
- —
Air-quality risk No data
- Unhealthy air days now
- —
- Unhealthy air days in 30 yrs
- —
Risk factors via First Street. Map © Google.
Why this score? — see what drove the D- grade
The composite is a weighted blend of 9 inputs, each scored 0–100. Each bar is that input's sub-score; the figure is the points it added to the 100-point composite (weight × sub-score).
- ARV discount +12.8/15.0
- Cash flow +9.9/30.0
- Schools +3.5/10.0
- DSCR +2.8/10.0
- Livability +2.7/5.0
- Condition / age +2.5/5.0
- Rent growth +2.4/5.0
- 1% rule +2.3/10.0
- Appreciation +0.0/10.0
$203,720
🖨 Deal sheet 📄 Offer letter ✓ Due diligence
Listing remarks
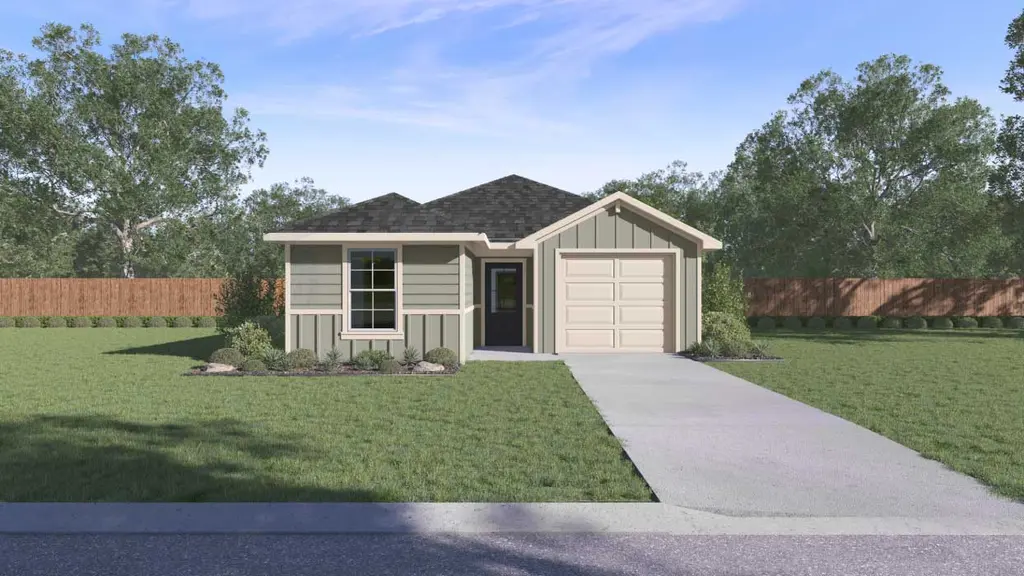
ESTIMATED COMPLETION AUGUST. The Darcy is a thoughtfully designed 1,014 square foot home that offers two spacious bedrooms and two bathrooms. The open-concept layout features a stunning kitchen with a large island and a walk-in pantry. The main bedroom, bedroom 1, includes a generous ensuite with a walk-in shower and a sizable walk-in closet. Enjoy outdoor living with a covered patio and a professionally landscaped, irrigated yard with Bermuda sod. The Darcy also includes the America's Smart Home® package that offers devices such as the Qolsys IQ Panel, Video Doorbell, Alarm.com app, Honeywell Thermostat, a Smart Light Switch, Kwikset Smart lock, and more. Images are representative of p
Key facts
- Large island
- Walk-in shower
- Stunning kitchen
Tags
Property features AI
Finance
- HOA & community: Homeowners association (Marigold) with $60 monthly fee; HOA covers common area maintenance; Community amenities include common grounds, community mailbox, dog park, playground, park, and trails/paths
Exterior
- Parking: Attached garage (1 covered space)
- Security: Smoke detectors
- Utilities: Public water; Public sewer; Electricity available; Natural gas available; High-speed internet available; Cable available
- Home design: Single-story home; New construction by DR HORTON; Faces southwest; Slab foundation
- Construction: HardiPlank-type exterior with radiant barrier; Composition shingle roof; New construction
- Exterior features: Private yard; Covered patio; Automatic sprinklers; Back yard fencing with wood privacy fence
Interior
- Kitchen: Dishwasher; Gas range; Microwave; Garbage disposal; Vented exhaust fan; ENERGY STAR qualified appliances
- Bedrooms: 2 main-level bedrooms; Main level primary bedroom
- Flooring: Carpet; Vinyl
- Bathrooms: 2 full bathrooms
- Heating & cooling: Central heating (natural gas); Central air conditioning; Thermostat included
- Interior features: High ceilings; Open floorplan; Kitchen island; Pantry; Quartz counters; Recessed lighting; Smart home features; Walk-in closet(s); Double pane vinyl windows with screens; ENERGY STAR qualified windows
- Laundry & utility: Laundry closet on the main level
Neighborhood map
What this means for you Summary
Snapshot
- This is a 2-bed/2.0-bath land listed at $204k.
Deal economics
- At list price, monthly cash flow is $-127 ($-2k/yr) — negative.
- To cash-flow at today's rent, offer at most $181k (11.0% below list).
- To meet the 1% rule (rent ≥ 1% of price), the offer needs to be $149k (26.9% below list).
- Recommended offer: $149k (26.9% below list) — sets the bar for 1% rule.
Location & tenants
- Location reads 54/100 on livability (#1,385 in TX) — a working-class tenant base; expect higher turnover. Strengths: cost of living A+, housing A+, crime A; Watch: employment C-, schools F, amenities F.
- Hays CISD (rural): math 35% / reading 41% proficiency, ranked #390 of 826 in TX (top 47%) — families likely to look elsewhere, expect single-tenant / working-renter base with shorter leases.
- Market conditions: Rents soft (-0.3%/yr); 1801 active listings in the ZIP; 1 comparable units currently listed for rent nearby; solid renter incomes; 5,270 units permitted in Hays County in 2024 (1,464 in 5+ unit buildings).
Forward outlook
- Local home prices are declining (-3.0%/yr); year-one equity from $1k of loan paydown is wiped out by about $6k of value loss. Plan a longer hold.
- Hays County population projected at +93% by 2050 — long-run rental-demand tailwind backs the buy-and-hold thesis.
Negotiation context
- It's been on market 53 days — a 3% lower offer ($198k) is reasonable based on typical stale-listing flexibility.
Questions for the listing agent
- What do current leases actually rent for vs. the listed asking? Can we see a recent rent roll and the last 12 months of T-12 income?
- It's been on market 53 days. Have you received any prior offers? Is the seller open to a 27% concession, seller financing, or rate buy-down credit?
- What does the HOA fee cover, when was the last increase, and are there any pending special assessments or reserve-fund shortfalls?
- Is there a deadline driving the sale (1031 exchange, divorce, estate, relocation)? That informs how much negotiation room exists.
- Schools are F-rated, which usually means shorter tenancies and higher turnover. Who's the typical renter profile here, and what's been the actual vacancy rate?
- The area grade is low — what's the realistic commute time and amenity access for the typical tenant pool here? Any planned neighborhood developments (good or bad) we should know about?
- What's the average days-on-market for RENTAL listings here right now (not sales)? A rising rental-DOM trend means longer vacancies and softer asking-rent achievability than the comps imply.
- What's the recent tenant-quality profile in this submarket — average credit score on applications, eviction rate, late-payment / NSF rate, and stable-employment percentage? A property-management company in the area should have these aggregated.
- How much new for-sale + rental construction is in the pipeline within 1–3 miles? Heavy new supply typically softens prices + rents 12–24 months out; constrained supply supports both.
Investment metrics
- 1% rule
- 0.73% ✗
- Cap rate
- 5.54%
- Cash-on-cash
- -2.67%
- DSCR
- 0.88
- GRM
- 11.4
CMA / ARV
- ARV (median comp)
- $231,167
- List price
- $203,720
- Delta
- -11.87%
- Verdict
- UNDERPRICED
- Comps
- 20 within 1.0 mi
Projected returns pro-forma
-3.0% appreciation · 0.0% rent growth · sell at horizon
- IRR
- -23.9%
- Equity multiple
- 0.20×
- Total profit
- $-45,509
- Equity at exit
- $30,375
- IRR
- -29.2%
- Equity multiple
- -0.18×
- Total profit
- $-67,080
- Equity at exit
- $17,614
Cash invested: $57,042 (down + closing). Projections, not guarantees.
Landlord ↔ Tenant lean methodology
- Overall (STATE)
- 87 Strongly Landlord-Friendly
- State Texas
- 87 Strongly Landlord-Friendly · R+5
- County
- — inherits STATE
- City
- — inherits STATE
ZIP-level market 78640
- Home prices YoY
- -33.8%
- Rents YoY
- -0.3%
- Active inventory
- 1801
- Price-to-rent
- 11.4×
Monthly cashflow live
- Estimated rent
- $1,489 medium interval (Pro) →
- Mortgage (P&I)
- −$1,068
- Tax from tax record
- −$90 /mo · $1,078/yr
- Insurance
- −$85
- HOA
- −$60
- Vacancy / Maint / Mgmt
- −$313
- Net cashflow
- $-127
Break-even live
UW: 25.0% down · 7.5% · 30yr · 1.5% tax · 5.0% vac · 8.0% maint · 8.0% mgmt
Financing live
Cash to close
- Down payment
- $50,930
- Closing costs
- $6,112
- Reserves months
- —
- Total cash needed
- —
Loan-product check · same deal, 3 products live
Conventional
25% down · 7.5% · 30yr
- Down + closing
- —
- Monthly P&I
- —
- Monthly cashflow
- —
- DSCR
- —
- Eligible?
- —
Personal DTI + credit; lowest rate.
DSCR
20% down · 8.5% · 30yr
- Down + closing
- —
- Monthly P&I
- —
- Monthly cashflow
- —
- DSCR
- —
- Eligible?
- —
No personal income docs; deal must DSCR.
Hard money
10% down · 12.0% · 12mo
- Down + closing
- —
- Monthly P&I
- —
- Monthly cashflow
- —
- DSCR
- —
- Eligible?
- —
Short-term bridge; refi at stabilization.
Rent comps 1 comps
| Address | Beds | Baths | Sqft | Rent | $/sqft | DOM | Units | Dist |
|---|---|---|---|---|---|---|---|---|
| 129 Pineland Ave Niederwald, TX | 3.0 | 2.0 | 1460 | $1,414 | $0.97 | 12d | 1 | 1.13mi |
HOA detail
- Monthly dues
- $60 · $720/yr
- Likely covers
- security
Listing history 13 events
-
2026-06-16status $203,720 Pending 53 DOM
-
2026-06-15days on market $203,720 Active 53 DOM
-
2026-06-13days on market $203,720 Active 51 DOM
-
2026-06-09days on market $203,720 Active 47 DOM
-
2026-06-08days on market $203,720 Active 46 DOM
-
2026-06-07days on market $203,720 Active 45 DOM
-
2026-06-05days on market $203,720 Active 42 DOM
-
2026-06-03days on market $203,720 Active 41 DOM
-
2026-06-02days on market $203,720 Active 40 DOM
-
2026-06-01days on market $203,720 Active 39 DOM
-
2026-05-31days on market $203,720 Active 38 DOM
-
2026-04-29$203,720 Active 757-char remark
-
2026-04-23$203,720 Active 774-char remark
ⓘ Source: listings_history table (triggers on properties + properties_extension) + one-shot
backfill from property_details.listing_events for pre-trigger history.
Tax reassessment forecast TX · Resets to sale price
- Current annual tax
- $1,078 · $90/mo
- Projected year-2 tax
- $3,728 · $311/mo
- Expected delta
- +$2,650/yr (+$221/mo · 245.7%)
ⓘ Screening estimate from a state-policy table — verify with the county assessor before closing.
Nearby sold comps map
Loading sold comps map…
Walkable amenities ~0.75 mi
Loading nearby amenities…
Taxation est. · year 1
- Rental income
- $17,864
- − Mortgage interest
- −$11,411
- − Property taxes
- −$1,078
- − Insurance
- −$1,019
- − Repairs & maintenance
- −$1,429
- − Management
- −$1,429
- − HOA
- −$720
- − Depreciation
- −$5,926
- Taxable loss
- −$5,150
- Est. tax savings @ 24.0%
- +$1,236
- After-tax cash flow
- $-289/yr
For passive investors: Depreciation is non-cash, so a rental often shows a tax loss while cash-flowing — sheltering income. Rental losses are passive: they offset passive income freely, and up to $25,000/yr can offset ordinary (W-2) income if you actively participate and your MAGI is under $100k (phasing out to $0 by $150k); unused losses carry forward. On sale, claimed depreciation is recaptured at up to 25%, and gains may owe capital-gains tax (a 1031 exchange can defer both). Figures are a year-1 estimate at your 24.0% rate — not tax advice; consult a CPA.
Schools (NCES district)
- District
- Hays CISD
- NCES district ID
- 4800010
- Math proficiency
- 35% ▼ -15.00%
- Reading proficiency
- 41% ▼ -5.00%
- Median HH income
- $70,570
- Composite
- 34.78/100
- National rank
- #5118
- State rank
- #390 of 826 in TX
Livability — Uhland
- Score
- 54/100
- State rank
- #1385
- US rank
- #23774
Category grades
Schools grade is shown separately in the Schools card above.
Census & demographics
- County
- Hays County · 280,138 people
- Metro
- Austin-Round Rock-Georgetown, TX
- Population (ZIP)
- 77,531
- Household income
- $90,075
- Rent vs Own
- Severe rent burden
- 2552.0
Population outlook (Hays County) Hauer SSP2
- Today (2025)
- 286,948 people
- By 2030
- 336,923 · +17.4%
- By 2040
- 441,894 · +54.0%
- By 2050
- 553,462 · +92.9%
- By 2075
- 838,261 · +192.1%
- By 2100
- 1,063,658 · +270.7%
Race, ethnicity, and origin ACS 2023
- Neighborhood character
- Diverse neighborhood (Simpson 0.56)
- Race & ethnicity
- Hispanic / Latino 55% White 36% Two or more races 29% Black 5% Native American 1%
- Hispanic origin (detail)
- Mexican 47% Puerto Rican 1%
- Common ancestry
- Italian 2% Slovak 2% Lithuanian 1%
- Foreign-born
- 13% · Canada
- Languages at home
- 63% English-only · Spanish 35%
Political lean MEDSL · Hays
- 2024 margin
- Lean D (+5.7) · D 52.1% · R 46.5% · Other 1.4%
- 2008→2024 swing
- +7.7pp toward D · 2008: -2.0pp · 2024: 5.7pp
- All cycles
- 2024: D+5.7 2020: D+10.8 2016: R+0.9 2012: R+10.4 2008: R+2.0
Not yet ingested
- Civics
- —
Market trends
- HPI YoY
- ▼ -92.64%
- Current HPI
- 181.7969
- Rent YoY
- ▼ -0.34%
- Metro
- Austin-Round Rock-Georgetown, TX
- State GDP YoY
- ▲ 3.95%
- F500 in state
- 110
Industry mix (Fortune 500 HQ in TX)
| Industry | F500 HQs | Revenue |
|---|---|---|
| Energy | 16 | $1,198B |
|
||
| Technology | 5 | $198B |
|
||
| Engineering / Construction | 4 | $72B |
|
||
| Energy Services | 3 | $60B |
|
||
| Utilities | 3 | $41B |
|
||
| Healthcare | 2 | $330B |
|
||
Price history
2 events — show timeline
- 2026-06-15 Pending — Unlock MLS
- 2026-04-23 Listed $203,720 Unlock MLS
Property tax history
+8.1%/yrLatest (2025): $1,078 · +8.1% YoY. Source: county tax records.
Cash-flow waterfall
monthlySold comps — $/sqft
last 12 mo · ≤1 miLoading sold comps…