8017 County Road 603 · Lake Brownwood, TX
Flood risk 1/10 · Minimal
- FEMA flood zone
- X (unshaded)
- Chance of flooding over 30 yrs
- 0.0%
- Est. flood insurance / yr
- $507 – $1,088
Fire risk 8/10 · Major
- Est. fire insurance / yr
- $1,222 – $2,270
Heat risk 7/10 · Major
- Hot days now (above 107°F)
- 6 days/yr
- Hot days in 30 yrs
- 18 days/yr
Wind risk 4/10 · Minor
- Chance of severe wind over 30 yrs
- 22.0%
Air-quality risk 1/10 · Minimal
- Unhealthy air days now
- 0 days/yr
- Unhealthy air days in 30 yrs
- 0 days/yr
Risk factors via First Street. Map © Google.
Why this score? — see what drove the C grade
The composite is a weighted blend of 9 inputs, each scored 0–100. Each bar is that input's sub-score; the figure is the points it added to the 100-point composite (weight × sub-score).
- Cash flow +23.0/30.0
- ARV discount +7.9/15.0
- DSCR +7.4/10.0
- 1% rule +5.2/10.0
- Schools +4.3/10.0
- Livability +3.4/5.0
- Rent growth +2.5/5.0
- Condition / age +2.5/5.0
- Appreciation +0.0/10.0
$86,500
🖨 Deal sheet 📄 Offer letter ✓ Due diligence
Listing remarks
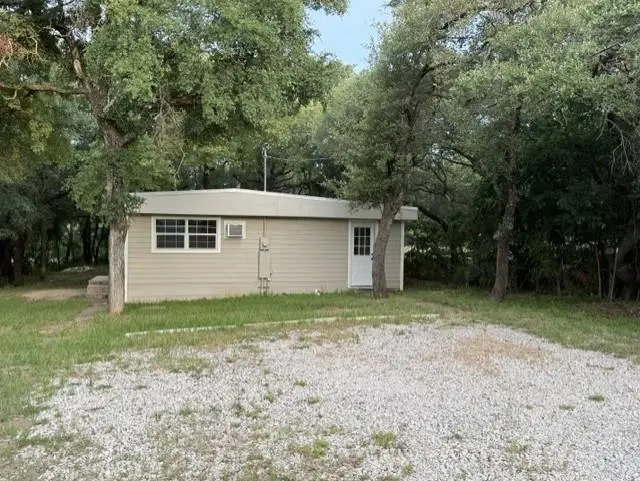
8017 County Road 603 offers the perfect weekend getaway or full-time retreat near Lake Brownwood. This charming 1-bedroom, 1-bath cottage has seen extensive recent updates, making it move-in ready for its next owner. Improvements include a new roof, updated electrical and plumbing, new flooring, windows, siding, mini split insulation, kitchen cabinets and countertops, bathroom fixtures, and fresh interior paint. Surrounded by several mature trees, the property offers a setting to relax and enjoy lake area living. Whether you are looking for a weekend cabin, investment property, or cozy full-time home, this updated cottage is ready to welcome you.
Key facts
- Updated electrical
- New flooring
- New roof
Tags
Property features AI
Finance
- Other: Property type: Residential — Single Family Residence; Subdivision: Lamar Terrace; Lot: less than 0.5 acre (approximately 0.39 acre); Parcel number available
- Financial info: Accepts cash, conventional loans, and 1031 exchange; Second mortgage: none
- HOA & community: No association
Exterior
- Parking: Driveway
- Utilities: Co-op water; Rural water district; Septic; Power available (standard utilities)
- Home design: Single-family residence; One story; Not attached to another property
- Construction: Metal roof; Pillar/post/pier foundation; Preowned home (year built: preowned)
- Exterior features: Few trees; All-weather road access
Interior
- Kitchen: Electric range; Refrigerator
- Bedrooms: Primary bedroom on main level (1 bedroom total)
- Flooring: Laminate flooring
- Bathrooms: 1 full bathroom on main level
- Heating & cooling: Zoned heating; Zoned cooling; Ceiling fan(s)
- Interior features: Open floorplan; Decorative lighting; Window coverings; One living area; Room count: 4
- Laundry & utility: Full-size washer and dryer area; Washer included; Dryer included; Electric water heater
Neighborhood map
What this means for you Summary
Snapshot
- This is a 1-bed/1.0-bath single-family listed at $86k.
Deal economics
- At list price, monthly cash flow is $153 ($2k/yr) — positive.
- The deal already cash-flows at list — no discount required.
- Meets the 1% rule at list price ($879 rent vs $86k).
- Recommended offer: $85k (1.5% below list) — sets the bar for market timing.
- Cap rate 8.4% vs local median 1.6% in Lake Brownwood — top-decile yield for the area; either an underpriced asset or a hidden risk that comps aren't pricing in. Stress-test before assuming the spread holds.
Location & tenants
- Location reads 67/100 on livability (#513 in TX) — a middle-class / working-renter tenant base. Strengths: cost of living A+, housing A+, crime A-; Watch: health & safety D+, amenities F, commute F.
- Bangs ISD (rural): math 49% / reading 53% proficiency, ranked #178 of 826 in TX (top 22%) — acceptable for families but not a draw, mixed tenant base, ~2y average lease.
- Zoned schools: J B Stephens El (math 52% / reading 52%, grade C-, #742 of 4,322 statewide, top 19%, 418 students, 71% FRL) — zoned schools average 71% FRL vs 50% district-wide (21 pts higher); higher-poverty schools than district average — tighter screening recommended.
- Market conditions: 377 active listings in the ZIP; 142 units permitted in Brown County in 2024 (0 in 5+ unit buildings).
Forward outlook
- Local home prices are declining (-3.0%/yr); year-one equity from $598 of loan paydown is wiped out by about $3k of value loss. Plan a longer hold.
Negotiation context
- It's been on market 21 days — a 2% lower offer ($85k) is reasonable based on typical stale-listing flexibility.
- 2 sale attempts since 11y ago with the ask held roughly flat each time — persistent listings suggest the price (not the market) is what's stuck; bring a comps-based counter.
Risks & watch-outs
- Climate carrying-cost: severe wildfire risk; extreme-heat days projected 6→18/yr by 2055 (HVAC capex compounding) — expect insurance premiums to compound above CPI over the hold.
Questions for the listing agent
- Is there a deadline driving the sale (1031 exchange, divorce, estate, relocation)? That informs how much negotiation room exists.
- Schools are F-rated, which usually means shorter tenancies and higher turnover. Who's the typical renter profile here, and what's been the actual vacancy rate?
- What's the average days-on-market for RENTAL listings here right now (not sales)? A rising rental-DOM trend means longer vacancies and softer asking-rent achievability than the comps imply.
- What's the recent tenant-quality profile in this submarket — average credit score on applications, eviction rate, late-payment / NSF rate, and stable-employment percentage? A property-management company in the area should have these aggregated.
- How much new for-sale + rental construction is in the pipeline within 1–3 miles? Heavy new supply typically softens prices + rents 12–24 months out; constrained supply supports both.
Investment metrics
- 1% rule
- 1.02% ✓
- Cap rate
- 8.42%
- Cash-on-cash
- 7.60%
- DSCR
- 1.34
- GRM
- 8.2
CMA / ARV
- ARV (on-the-fly)
- $87,360
- Comps found
- 1
Show comp detail 1 sale within ~0.75 mi
| Address | Dist | Beds/Ba | Sqft | Sold | Price | $/sf | Match |
|---|---|---|---|---|---|---|---|
| 6853 Jordan Ln | 0.34mi | 1/1.0 | 728 (+8%) | 3mo | $95,000 | $130 | 68 |
Match score weights: distance 35% · size 25% · config 20% · recency 20%. Top-matched comps best support the ARV.
Projected returns pro-forma
-3.0% appreciation · 3.0% rent growth · sell at horizon
- IRR
- -4.7%
- Equity multiple
- 0.82×
- Total profit
- $-4,266
- Equity at exit
- $12,897
- IRR
- 4.9%
- Equity multiple
- 1.36×
- Total profit
- $8,780
- Equity at exit
- $7,479
Cash invested: $24,220 (down + closing). Projections, not guarantees.
Landlord ↔ Tenant lean methodology
- Overall (STATE)
- 87 Strongly Landlord-Friendly
- State Texas
- 87 Strongly Landlord-Friendly · R+5
- County
- — inherits STATE
- City
- — inherits STATE
ZIP-level market 76801
- Active inventory
- 377
- Price-to-rent
- 8.2×
Monthly cashflow live
- Estimated rent
- $879 medium interval (Pro) →
- Mortgage (P&I)
- −$454
- Tax from tax record
- −$52 /mo · $620/yr
- Insurance
- −$36
- HOA
- −$0
- Vacancy / Maint / Mgmt
- −$185
- Net cashflow
- $153
Break-even live
UW: 25.0% down · 7.5% · 30yr · 1.5% tax · 5.0% vac · 8.0% maint · 8.0% mgmt
Financing live
Cash to close
- Down payment
- $21,625
- Closing costs
- $2,595
- Reserves months
- —
- Total cash needed
- —
Loan-product check · same deal, 3 products live
Conventional
25% down · 7.5% · 30yr
- Down + closing
- —
- Monthly P&I
- —
- Monthly cashflow
- —
- DSCR
- —
- Eligible?
- —
Personal DTI + credit; lowest rate.
DSCR
20% down · 8.5% · 30yr
- Down + closing
- —
- Monthly P&I
- —
- Monthly cashflow
- —
- DSCR
- —
- Eligible?
- —
No personal income docs; deal must DSCR.
Hard money
10% down · 12.0% · 12mo
- Down + closing
- —
- Monthly P&I
- —
- Monthly cashflow
- —
- DSCR
- —
- Eligible?
- —
Short-term bridge; refi at stabilization.
Listing history 16 events
-
2026-06-09status $86,500 Pending 21 DOM
-
2026-06-08days on market $86,500 Active Option Contract 21 DOM
-
2026-06-08days on market $86,500 Active Option Contract 20 DOM
-
2026-06-05days on market $86,500 Active Option Contract 18 DOM
-
2026-06-03days on market $86,500 Active Option Contract 16 DOM
-
2026-06-02days on market $86,500 Active Option Contract 15 DOM
-
2026-06-01days on market $86,500 Active Option Contract 14 DOM
-
2026-05-31days on market $86,500 Active Option Contract 13 DOM
-
2026-05-18$86,500 Active
-
2021-12-09soldstatus
-
2021-03-31soldstatus
-
2016-01-05soldstatus
-
2015-09-28historical
-
2015-04-02$19,500 Active
-
2004-09-01soldstatus
-
1993-01-07soldstatus
ⓘ Source: listings_history table (triggers on properties + properties_extension) + one-shot
backfill from property_details.listing_events for pre-trigger history.
Tax reassessment forecast TX · Resets to sale price
- Current annual tax
- $620 · $52/mo
- Projected year-2 tax
- $1,583 · $132/mo
- Expected delta
- +$963/yr (+$80/mo · 155.4%)
ⓘ Screening estimate from a state-policy table — verify with the county assessor before closing.
Climate risk First Street
- Flood 1/10 Low FEMA zone X (unshaded) · 0% chance over 30 yrs
- Wildfire 8/10 Severe
- Heat 7/10 Severe 6 d/yr ≥107°F today · 18 d/yr by 30 yrs out
- Wind 4/10 Moderate 22% chance of damaging wind over 30 yrs
- Air quality 1/10 Low 0 unhealthy d/yr today · 0 by 30 yrs out
Nearby sold comps map
Loading sold comps map…
Walkable amenities ~0.75 mi
Loading nearby amenities…
Taxation est. · year 1
- Rental income
- $10,553
- − Mortgage interest
- −$4,845
- − Property taxes
- −$620
- − Insurance
- −$432
- − Repairs & maintenance
- −$844
- − Management
- −$844
- − Depreciation
- −$2,516
- Taxable income
- $450
- Est. tax owed @ 24.0%
- −$108
- After-tax cash flow
- $1,733/yr
For passive investors: Depreciation is non-cash, so a rental often shows a tax loss while cash-flowing — sheltering income. Rental losses are passive: they offset passive income freely, and up to $25,000/yr can offset ordinary (W-2) income if you actively participate and your MAGI is under $100k (phasing out to $0 by $150k); unused losses carry forward. On sale, claimed depreciation is recaptured at up to 25%, and gains may owe capital-gains tax (a 1031 exchange can defer both). Figures are a year-1 estimate at your 24.0% rate — not tax advice; consult a CPA.
Schools (NCES district)
- District
- Bangs ISD
- NCES district ID
- 4809390
- Math proficiency
- 49% ▲ 6.00%
- Reading proficiency
- 53% ▲ 8.00%
- Median HH income
- $43,702
- Composite
- 43.0/100
- National rank
- #3105
- State rank
- #178 of 826 in TX
Livability — Lake Brownwood
- Score
- 67/100
- State rank
- #513
- US rank
- #10141
Category grades
Schools grade is shown separately in the Schools card above.
Census & demographics
- Census place
- Lake Brownwood, TX
- Population (ZIP)
- 25,152
Population outlook (Brown County) Hauer SSP2
- Today (2025)
- 38,381 people
- By 2030
- 38,288 · -0.2%
- By 2040
- 38,120 · -0.7%
- By 2050
- 38,227 · -0.4%
- By 2075
- 39,362 · +2.6%
- By 2100
- 39,171 · +2.1%
Race, ethnicity, and origin ACS 2023
- Neighborhood character
- Predominantly White (66%)
- Race & ethnicity
- White 66% Hispanic / Latino 26% Two or more races 15% Black 4%
- Hispanic origin (detail)
- Mexican 23%
- Common ancestry
- Italian 12% Slovak 2% Lithuanian 1%
- Foreign-born
- 4% · Canada
- Languages at home
- 82% English-only · Spanish 17%
Political lean MEDSL · Brown
- 2024 margin
- Solid R (+73.9) · D 12.7% · R 86.6%
- 2008→2024 swing
- -12.5pp toward R · 2008: -61.5pp · 2024: -73.9pp
- All cycles
- 2024: R+73.9 2020: R+72.6 2016: R+74.5 2012: R+71.7 2008: R+61.5
Not yet ingested
- Civics
- —
Market trends
- HPI YoY
- ▼ -121.52%
- Current HPI
- 164.0992
- Rent YoY
- —
- Metro
- —
- State GDP YoY
- ▲ 3.95%
- F500 in state
- 110
Industry mix (Fortune 500 HQ in TX)
| Industry | F500 HQs | Revenue |
|---|---|---|
| Energy | 16 | $1,198B |
|
||
| Technology | 5 | $198B |
|
||
| Engineering / Construction | 4 | $72B |
|
||
| Energy Services | 3 | $60B |
|
||
| Utilities | 3 | $41B |
|
||
| Healthcare | 2 | $330B |
|
||
Price history
+343.6% since first listed8 events — show timeline
- 2026-05-18 Listed $86,500 NTREIS
- 2021-12-09 Sold (Public Records) — Public Records
- 2021-03-31 Sold (Public Records) — Public Records
- 2016-01-05 Sold (Public Records) — Public Records
- 2015-09-28 Listing Removed — NTREIS
- 2015-04-02 Listed $19,500 NTREIS
- 2004-09-01 Sold (Public Records) — Public Records
- 1993-01-07 Sold (Public Records) — Public Records
Property tax history
+2.4%/yrLatest (2025): $620 · -3.1% YoY. Source: county tax records.
Cash-flow waterfall
monthlySold comps — $/sqft
last 12 mo · ≤1 miLoading sold comps…