302 Cr 3832 · Hawkins, TX
Flood risk 1/10 · Minimal
- FEMA flood zone
- X (unshaded)
- Chance of flooding over 30 yrs
- 0.0%
- Est. flood insurance / yr
- $507 – $1,088
Fire risk 4/10 · Minor
- Est. fire insurance / yr
- $1,222 – $2,270
Heat risk 6/10 · Moderate
- Hot days now (above 111°F)
- 7 days/yr
- Hot days in 30 yrs
- 24 days/yr
Wind risk 6/10 · Moderate
- Chance of severe wind over 30 yrs
- 45.0%
Air-quality risk 2/10 · Minimal
- Unhealthy air days now
- 1 days/yr
- Unhealthy air days in 30 yrs
- 1 days/yr
Risk factors via First Street. Map © Google.
Why this score? — see what drove the D- grade
The composite is a weighted blend of 9 inputs, each scored 0–100. Each bar is that input's sub-score; the figure is the points it added to the 100-point composite (weight × sub-score).
- Cash flow +8.0/30.0
- ARV discount +7.5/15.0
- Appreciation +6.5/10.0
- Livability +3.7/5.0
- Schools +3.6/10.0
- Rent growth +2.5/5.0
- Condition / age +2.5/5.0
- DSCR +2.1/10.0
- 1% rule +1.2/10.0
$295,000
🖨 Deal sheet 📄 Offer letter ✓ Due diligence
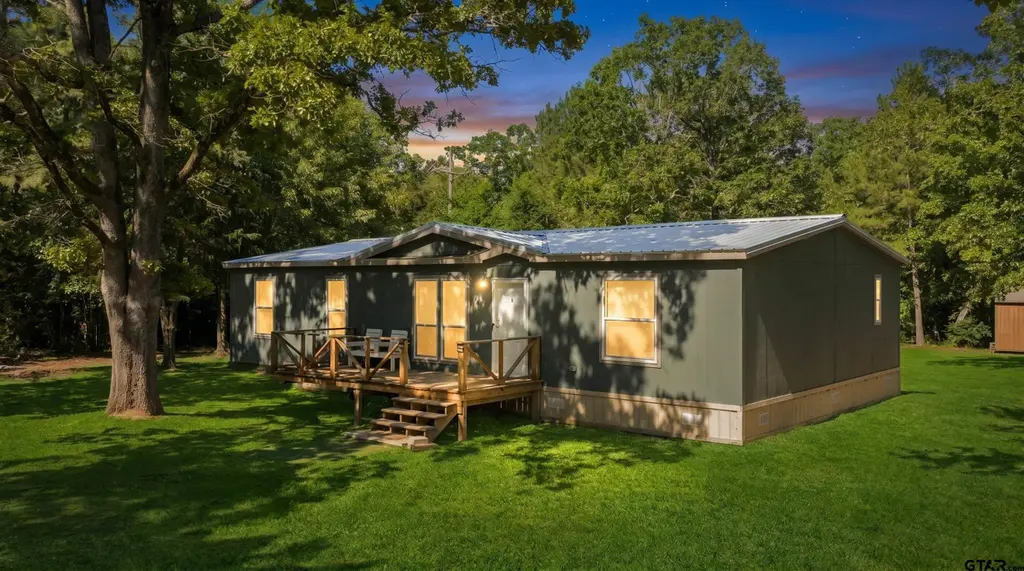
Listing remarks
Paradise awaits you - this beautiful home was built in 2024 and sits on 10 wooded acres in Hawkins. If you're in the market for you own private peaceful retreat, then you gotta see this place. Surrounded by mature trees and tucked away from the world, this property offers the kind of seclusion where you can truly relax. Looking to pee of the back porch without having to worry about the neighbors? Want to hunt from the comfort of your back porch? Then this is the place for you. Inside, the home is beautifully finished and practically brand new, featuring warm beam accents in the living area and a spacious open-concept kitchen and living room designed for gathering. The kitchen is a dream wit
Key facts
- Open-concept kitchen
- 10 wooded acres
- Tons of storage
Tags
Property features AI
Finance
- Financial info: Annual property tax listed
Exterior
- Utilities: Septic tank
- Home design: Single-story; Manufactured (mobile) home; Residential property
- Construction: Composition roof
- Exterior features: Porch; Wooded lot; Storage structure
Interior
- Kitchen: Dishwasher; Electric oven; Electric range; Microwave
- Flooring: Laminate flooring
- Bathrooms: 2 full bathrooms
- Heating & cooling: Central heating (electric); Central air; Ceiling fan(s)
- Interior features: Kitchen island; Walk-in closet(s)
Neighborhood map
What this means for you Summary
Snapshot
- This is a 3-bed/2.0-bath manufactured listed at $295k.
Deal economics
- At list price, monthly cash flow is $-298 ($-4k/yr) — negative.
- To cash-flow at today's rent, offer at most $242k (17.9% below list).
- To meet the 1% rule (rent ≥ 1% of price), the offer needs to be $183k (38.0% below list).
- Recommended offer: $183k (38.0% below list) — sets the bar for 1% rule.
Location & tenants
- Location reads 73/100 on livability (#196 in TX, #4,982 nationally) — a middle-class / working-renter tenant base. Strengths: cost of living A+, health & safety A+, crime A-; Watch: amenities F, commute F, employment D-.
- Hawkins ISD (rural): math 42% / reading 43% proficiency, ranked #339 of 826 in TX (top 41%) — families likely to look elsewhere, expect single-tenant / working-renter base with shorter leases.
- Zoned schools: Hawkins El (math 47% / reading 47%, grade D-, #1,006 of 4,322 statewide, top 25%, 383 students, 64% FRL); Hawkins H S / Middle (math 39% / reading 42%, grade F, #798 of 1,632 statewide, top 49%, 386 students, 59% FRL).
- Market conditions: 216 active listings in the ZIP; 72 units permitted in Wood County in 2024 (29 in 5+ unit buildings).
Forward outlook
- In year one you build about $11k of equity ($2k loan paydown + $9k appreciation (3.1% local appreciation)).
- Wood County population projected at +12% by 2050 — modest demand growth; plan on rents tracking national, not racing it.
- By year 4, paydown + projected appreciation supports a ~$38k cash-out refi (75% LTV) — recoverable capital for the next deal without selling this one.
Negotiation context
- It's been on market 30 days — a 2% lower offer ($291k) is reasonable based on typical stale-listing flexibility.
Risks & watch-outs
- Climate carrying-cost: major wind risk, 45% chance of damaging wind over 30y; extreme-heat days projected 7→24/yr by 2055 (HVAC capex compounding) — expect insurance premiums to compound above CPI over the hold.
Questions for the listing agent
- What do current leases actually rent for vs. the listed asking? Can we see a recent rent roll and the last 12 months of T-12 income?
- Is there a deadline driving the sale (1031 exchange, divorce, estate, relocation)? That informs how much negotiation room exists.
- Schools are D-rated, which usually means shorter tenancies and higher turnover. Who's the typical renter profile here, and what's been the actual vacancy rate?
- The area grade is low — what's the realistic commute time and amenity access for the typical tenant pool here? Any planned neighborhood developments (good or bad) we should know about?
- What's the average days-on-market for RENTAL listings here right now (not sales)? A rising rental-DOM trend means longer vacancies and softer asking-rent achievability than the comps imply.
- What's the recent tenant-quality profile in this submarket — average credit score on applications, eviction rate, late-payment / NSF rate, and stable-employment percentage? A property-management company in the area should have these aggregated.
- How much new for-sale + rental construction is in the pipeline within 1–3 miles? Heavy new supply typically softens prices + rents 12–24 months out; constrained supply supports both.
Investment metrics
- 1% rule
- 0.62% ✗
- Cap rate
- 5.08%
- Cash-on-cash
- -4.34%
- DSCR
- 0.81
- GRM
- 13.4
CMA / ARV
No comps found within radius.
Projected returns pro-forma
3.1% appreciation · 3.0% rent growth · sell at horizon
- IRR
- 3.7%
- Equity multiple
- 1.22×
- Total profit
- $17,884
- Equity at exit
- $134,250
- IRR
- 7.0%
- Equity multiple
- 2.07×
- Total profit
- $88,276
- Equity at exit
- $208,151
Cash invested: $82,600 (down + closing). Projections, not guarantees.
Landlord ↔ Tenant lean methodology
- Overall (STATE)
- 87 Strongly Landlord-Friendly
- State Texas
- 87 Strongly Landlord-Friendly · R+5
- County
- — inherits STATE
- City
- — inherits STATE
ZIP-level market 75765
- Home prices YoY
- 1.3%
- Active inventory
- 216
- Price-to-rent
- 13.4×
Monthly cashflow live
- Estimated rent
- $1,829 medium interval (Pro) →
- Mortgage (P&I)
- −$1,547
- Tax from tax record
- −$74 /mo · $885/yr
- Insurance
- −$123
- HOA
- −$0
- Vacancy / Maint / Mgmt
- −$384
- Net cashflow
- $-298
Break-even live
UW: 25.0% down · 7.5% · 30yr · 1.5% tax · 5.0% vac · 8.0% maint · 8.0% mgmt
Financing live
Cash to close
- Down payment
- $73,750
- Closing costs
- $8,850
- Reserves months
- —
- Total cash needed
- —
Loan-product check · same deal, 3 products live
Conventional
25% down · 7.5% · 30yr
- Down + closing
- —
- Monthly P&I
- —
- Monthly cashflow
- —
- DSCR
- —
- Eligible?
- —
Personal DTI + credit; lowest rate.
DSCR
20% down · 8.5% · 30yr
- Down + closing
- —
- Monthly P&I
- —
- Monthly cashflow
- —
- DSCR
- —
- Eligible?
- —
No personal income docs; deal must DSCR.
Hard money
10% down · 12.0% · 12mo
- Down + closing
- —
- Monthly P&I
- —
- Monthly cashflow
- —
- DSCR
- —
- Eligible?
- —
Short-term bridge; refi at stabilization.
Listing history 18 events
-
2026-06-19days on market $295,000 Active 30 DOM
-
2026-06-18days on market $295,000 Active 29 DOM
-
2026-06-17days on market $295,000 Active 28 DOM
-
2026-06-16days on market $295,000 Active 27 DOM
-
2026-06-15days on market $295,000 Active 26 DOM
-
2026-06-14days on market $295,000 Active 24 DOM
-
2026-06-13days on market $295,000 Active 23 DOM
-
2026-06-10days on market $295,000 Active 21 DOM
-
2026-06-09days on market $295,000 Active 20 DOM
-
2026-06-08days on market $295,000 Active 19 DOM
-
2026-06-07days on market $295,000 Active 18 DOM
-
2026-06-05days on market $295,000 Active 15 DOM
-
2026-06-03days on market $295,000 Active 14 DOM
-
2026-06-02days on market $295,000 Active 13 DOM
-
2026-06-01days on market $295,000 Active 12 DOM
-
2026-05-31days on market $295,000 Active 11 DOM
-
2026-05-30days on market $295,000 Active 10 DOM
-
2026-05-20$295,000 Active
ⓘ Source: listings_history table (triggers on properties + properties_extension) + one-shot
backfill from property_details.listing_events for pre-trigger history.
Tax reassessment forecast TX · Resets to sale price
- Current annual tax
- $885 · $74/mo
- Projected year-2 tax
- $5,398 · $450/mo
- Expected delta
- +$4,513/yr (+$376/mo · 509.7%)
ⓘ Screening estimate from a state-policy table — verify with the county assessor before closing.
Climate risk First Street
- Flood 1/10 Low FEMA zone X (unshaded) · 0% chance over 30 yrs
- Wildfire 4/10 Moderate
- Heat 6/10 Major 7 d/yr ≥111°F today · 24 d/yr by 30 yrs out
- Wind 6/10 Major 45% chance of damaging wind over 30 yrs
- Air quality 2/10 Low 1 unhealthy d/yr today · 1 by 30 yrs out
Nearby sold comps map
Loading sold comps map…
Walkable amenities ~0.75 mi
Loading nearby amenities…
Taxation est. · year 1
- Rental income
- $21,954
- − Mortgage interest
- −$16,525
- − Property taxes
- −$885
- − Insurance
- −$1,475
- − Repairs & maintenance
- −$1,756
- − Management
- −$1,756
- − Depreciation
- −$8,582
- Taxable loss
- −$9,026
- Est. tax savings @ 24.0%
- +$2,166
- After-tax cash flow
- $-1,415/yr
For passive investors: Depreciation is non-cash, so a rental often shows a tax loss while cash-flowing — sheltering income. Rental losses are passive: they offset passive income freely, and up to $25,000/yr can offset ordinary (W-2) income if you actively participate and your MAGI is under $100k (phasing out to $0 by $150k); unused losses carry forward. On sale, claimed depreciation is recaptured at up to 25%, and gains may owe capital-gains tax (a 1031 exchange can defer both). Figures are a year-1 estimate at your 24.0% rate — not tax advice; consult a CPA.
Schools (NCES district)
- District
- Hawkins ISD
- NCES district ID
- 4822770
- Math proficiency
- 42% ▼ -12.00%
- Reading proficiency
- 43% ▼ -6.00%
- Median HH income
- $43,119
- Composite
- 35.91/100
- National rank
- #4809
- State rank
- #339 of 826 in TX
Livability — Hawkins
- Score
- 73/100
- State rank
- #196
- US rank
- #4982
Category grades
Schools grade is shown separately in the Schools card above.
Census & demographics
- Population (ZIP)
- 8,195
Population outlook (Wood County) Hauer SSP2
- Today (2025)
- 46,480 people
- By 2030
- 47,796 · +2.8%
- By 2040
- 50,142 · +7.9%
- By 2050
- 52,122 · +12.1%
- By 2075
- 57,033 · +22.7%
- By 2100
- 56,418 · +21.4%
Race, ethnicity, and origin ACS 2023
- Neighborhood character
- Predominantly White (79%)
- Race & ethnicity
- White 79% Black 12% Hispanic / Latino 6% Two or more races 5%
- Hispanic origin (detail)
- Mexican 5%
- Common ancestry
- Lithuanian 2% Slovak 2% Serbian 1%
- Foreign-born
- 1% · Canada
- Languages at home
- 95% English-only · Spanish 4%
Political lean MEDSL · Wood
- 2024 margin
- Solid R (+69.7) · D 14.8% · R 84.6%
- 2008→2024 swing
- -15.5pp toward R · 2008: -54.2pp · 2024: -69.7pp
- All cycles
- 2024: R+69.7 2020: R+68.2 2016: R+70.0 2012: R+64.2 2008: R+54.2
Not yet ingested
- Civics
- —
Market trends
- HPI YoY
- ▲ 3.10%
- Current HPI
- 236.7688
- Rent YoY
- —
- Metro
- —
- State GDP YoY
- ▲ 3.95%
- F500 in state
- 110
Industry mix (Fortune 500 HQ in TX)
| Industry | F500 HQs | Revenue |
|---|---|---|
| Energy | 16 | $1,198B |
|
||
| Technology | 5 | $198B |
|
||
| Engineering / Construction | 4 | $72B |
|
||
| Energy Services | 3 | $60B |
|
||
| Utilities | 3 | $41B |
|
||
| Healthcare | 2 | $330B |
|
||
Price history
1 event — show timeline
- 2026-05-20 Listed $295,000 GTAR
Property tax history
-1.3%/yrLatest (2019): $885 · -4.9% YoY. Source: county tax records.
Cash-flow waterfall
monthlySold comps — $/sqft
last 12 mo · ≤1 miLoading sold comps…