 Triplex
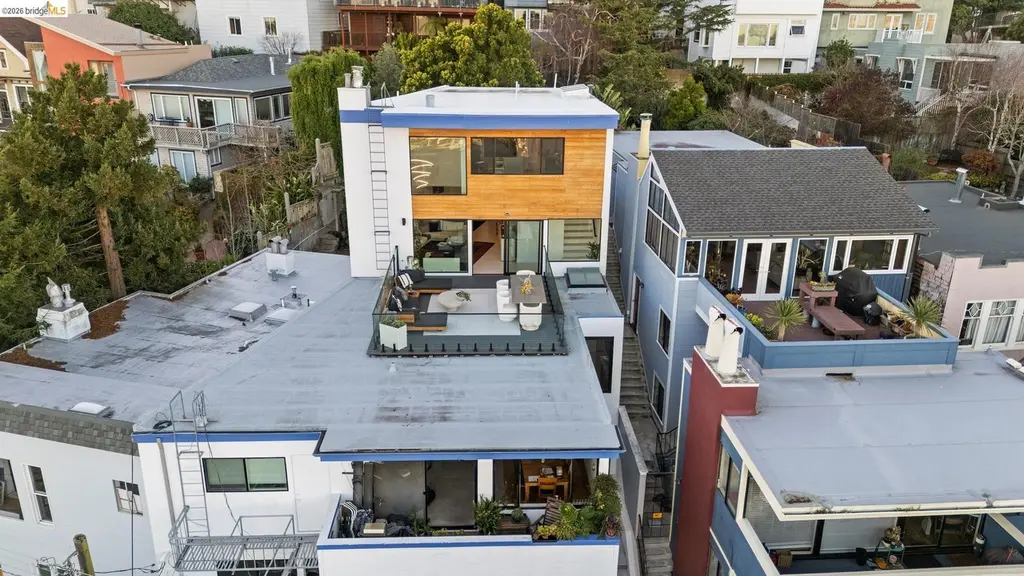
130 Grand View Ave · San Francisco, CA
Flood risk 1/10 · Minimal
- FEMA flood zone
- X (unshaded)
- Chance of flooding over 30 yrs
- 0.0%
- Est. flood insurance / yr
- $507 – $1,088
Fire risk 1/10 · Minimal
- Est. fire insurance / yr
- $659 – $1,223
Heat risk 2/10 · Minimal
- Hot days now (above 76°F)
- 7 days/yr
- Hot days in 30 yrs
- 17 days/yr
Wind risk 1/10 · Minimal
- Chance of severe wind over 30 yrs
- —
Air-quality risk 8/10 · Major
- Unhealthy air days now
- 15 days/yr
- Unhealthy air days in 30 yrs
- 15 days/yr
Risk factors via First Street. Map © Google.
Why this score? — see what drove the D grade
The composite is a weighted blend of 9 inputs, each scored 0–100. Each bar is that input's sub-score; the figure is the points it added to the 100-point composite (weight × sub-score).
- Appreciation +9.8/10.0
- ARV discount +7.5/15.0
- Cash flow +7.1/30.0
- Rent growth +5.0/5.0
- Schools +5.0/10.0
- Livability +3.8/5.0
- Condition / age +2.5/5.0
- DSCR +1.3/10.0
- 1% rule +1.1/10.0
$3,800,000
🖨 Deal sheet (PDF) 📄 Offer letter ✓ Due diligence
Multi-family units
County records classify this as Multi-Family (5+ Unit). Listing-text estimate: 3 units. estimate disagrees with records
5+ unit building — per-unit beds/baths from public records are typically unavailable; the breakdown below (if shown) is an estimate from the listing text.
Listing remarks MLS
Description Field Luxury Multi-Family Investment or TIC Opportunity in Eureka Valley. Discover a rare opportunity to own a 3-unit building in one of San Francisco's most desirable neighborhoods. This building is perfectly suited for a savvy investor looking for the whole building or buyers interested in independent Tenancy in Common (TIC) units. Ownership & Recent $1M+ Investment Owned by a dedicated partnership for the last 3 years, this property has undergone an extensive $1,000,000+ transformation focused on the spectacular top unit (Unit 3) and building-wide infrastructure. The Penthouse (Unit 3) Highlights: Expansion & Design: A full tri-level remodel featuring a modern open-plan layout and major structural enhancements. Outdoor Living: Direct access to an expansive, brand-new backyard and multiple extended decks designed to maximize the sweeping city views. Building-Wide Upgrades & Features: Modern Conveniences: Every unit features a new dishwasher and an in-unit
Key facts
- Tic opportunity
- 3 unit building
- Top unit
Tags
Neighborhood map
What this means for you Summary
Snapshot
- This is a 3 × 5-bed/4.5-bath units multifamily listed at $3.80M.
Deal economics
- At list price, monthly cash flow is $-5k ($-66k/yr) — negative. Per door: $-2k/mo.
- To cash-flow at today's rent, offer at most $2.84M (25.4% below list).
- To meet the 1% rule (rent ≥ 1% of price), the offer needs to be $2.32M (39.0% below list).
- Recommended offer: $2.32M (39.0% below list) — sets the bar for 1% rule.
- Cap rate 4.6% vs local median 2.1% in San Francisco — top-decile yield for the area; either an underpriced asset or a hidden risk that comps aren't pricing in. Stress-test before assuming the spread holds.
Location & tenants
- Location reads 76/100 on livability (#90 in CA, #3,143 nationally) — a middle-class / working-renter tenant base. Strengths: amenities A+, commute A+, employment A+; Watch: crime F, cost of living F.
- San Francisco Unified (urban): math 50% / reading 56% proficiency, ranked #322 of 1,400 in CA (top 23%) — acceptable for families but not a draw, mixed tenant base, ~2y average lease.
- Zoned schools: Lilienthal (Claire) Elementary (669 students, 19% FRL); Giannini (A.P.) Middle (1,192 students, 34% FRL); Lowell High (2,632 students, 37% FRL) — zoned schools average 30% FRL vs 49% district-wide (19 pts lower); this property's tenant base skews higher-income than the district average.
- Market conditions: Rents rising fast (+14.4%/yr); 121 active listings in the ZIP; high-income renter base; 750 units permitted in San Francisco County in 2024 (688 in 5+ unit buildings).
- At $23,182/mo this rent would consume 136% of the median local household income ($204k/yr) (locally 1336% of renters already pay >50% of income on rent) — very limited rent-growth headroom before tenants either downsize or default.
Forward outlook
- In year one you build about $388k of equity ($26k loan paydown + $361k appreciation (9.5% local appreciation)).
- San Francisco County population projected at +39% by 2050 — long-run rental-demand tailwind backs the buy-and-hold thesis.
- By year 2, paydown + projected appreciation supports a ~$622k cash-out refi (75% LTV) — recoverable capital for the next deal without selling this one.
Negotiation context
- It's been on market 80 days — a 6% lower offer ($3.57M) is reasonable based on typical stale-listing flexibility.
- 2 sale attempts since 6y ago with the ask held roughly flat each time — persistent listings suggest the price (not the market) is what's stuck; bring a comps-based counter.
- Current owner paid $1.88M; list at $3.80M implies a 103% gain — meaningful room to come down on a strong offer.
Questions for the listing agent
- What do current leases actually rent for vs. the listed asking? Can we see a recent rent roll and the last 12 months of T-12 income?
- It's been on market 80 days. Have you received any prior offers? Is the seller open to a 39% concession, seller financing, or rate buy-down credit?
- Can we see the unit-by-unit rent roll, current vacancy, and any below-market leases? What's the average tenancy length?
- What capital expenditures (roof, boiler, parking lot, exteriors) have been made in the last 5 years, and what's planned in the next 2?
- Built in 1961 — when were the roof, HVAC, electrical panel, plumbing, and water heater last replaced?
- Why hasn't it sold? Are there any deal-killer items the seller is aware of (foundation, flood, title, zoning, code violations)?
- Is there a deadline driving the sale (1031 exchange, divorce, estate, relocation)? That informs how much negotiation room exists.
- Schools are B-rated — typically a magnet for longer-tenancy family renters. What's the average tenant stay here, and is there a school-zone premium baked into asking?
- Crime grade is F in this area — have there been break-ins, vandalism, or insurance claims at this property in the last 3 years? What carrier currently insures it and at what premium?
- The area grade is low — what's the realistic commute time and amenity access for the typical tenant pool here? Any planned neighborhood developments (good or bad) we should know about?
- What's the average days-on-market for RENTAL listings here right now (not sales)? A rising rental-DOM trend means longer vacancies and softer asking-rent achievability than the comps imply.
- What's the recent tenant-quality profile in this submarket — average credit score on applications, eviction rate, late-payment / NSF rate, and stable-employment percentage? A property-management company in the area should have these aggregated.
- How much new apartment / multifamily construction is in the pipeline within 1–3 miles? Heavy new supply (>2% of stock underway) typically softens rents 12–24 months out; light construction supports rent growth.
Investment metrics
- 1% rule
- 0.61% ✗
- Cap rate
- 4.57%
- Cash-on-cash
- -6.16%
- DSCR
- 0.73
- GRM
- 13.7
CMA / ARV
- ARV (median comp)
- $2,130,236
- List price
- $3,800,000
- Delta
- 78.38%
- Verdict
- OVERPRICED
- Comps
- 20 within 1.0 mi
Projected returns pro-forma
9.51% appreciation · 8.0% rent growth · sell at horizon
- IRR
- 20.1%
- Equity multiple
- 2.61×
- Total profit
- $1,715,596
- Equity at exit
- $3,287,587
- IRR
- 19.4%
- Equity multiple
- 6.26×
- Total profit
- $5,596,059
- Equity at exit
- $6,950,146
Cash invested: $1,064,000 (down + closing). Projections, not guarantees.
Landlord ↔ Tenant lean methodology
- Overall (CITY)
- 0 Strongly Tenant-Friendly
- State California
- 18 Strongly Tenant-Friendly · D+13
- County
- — inherits STATE
- City San Francisco
- 0 Strongly Tenant-Friendly · D+57
ZIP-level market 94114
- Home prices YoY
- 4.4%
- Rents YoY
- 14.4%
- Active inventory
- 121
- Price-to-rent
- 41.0×
Monthly cashflow live
- Estimated rent
- $23,182 medium interval (Pro) →
- Mortgage (P&I)
- −$19,928
- Tax from tax record
- −$2,262 /mo · $27,146/yr
- Insurance
- −$1,583
- HOA
- −$0
- Vacancy / Maint / Mgmt
- −$4,868
- Net cashflow
- $-5,459
Break-even live
Sensitivity live
| Price | -10% $-3,308 | -5% $-4,384 | +0% $-5,459 | +5% $-6,535 | +10% $-7,610 |
|---|---|---|---|---|---|
| Rent | -10% $-7,291 | -5% $-6,375 | +0% $-5,459 | +5% $-4,544 | +10% $-3,628 |
| Rate | -1.0pp $-3,546 | -0.5pp $-4,493 | base $-5,459 | +0.5pp $-6,444 | +1.0pp $-7,446 |
3-unit breakdown (identical units grouped — click to expand)
| Units | Beds | Baths | Est. rent |
|---|---|---|---|
| 3× units | 5 | 4.5 | $23,181 |
| #1 | 5 | 4.5 | $7,727 |
| #2 | 5 | 4.5 | $7,727 |
| #3 | 5 | 4.5 | $7,727 |
| Total (3 units) | $23,182 | ||
UW: 25.0% down · 7.5% · 30yr · 1.5% tax · 5.0% vac · 8.0% maint · 8.0% mgmt
Financing live
Cash to close
- Down payment
- $950,000
- Closing costs
- $114,000
- Reserves months
- —
- Total cash needed
- —
Loan-product check · same deal, 3 products live
Conventional
25% down · 7.5% · 30yr
- Down + closing
- —
- Monthly P&I
- —
- Monthly cashflow
- —
- DSCR
- —
- Eligible?
- —
Personal DTI + credit; lowest rate.
DSCR
20% down · 8.5% · 30yr
- Down + closing
- —
- Monthly P&I
- —
- Monthly cashflow
- —
- DSCR
- —
- Eligible?
- —
No personal income docs; deal must DSCR.
Hard money
10% down · 12.0% · 12mo
- Down + closing
- —
- Monthly P&I
- —
- Monthly cashflow
- —
- DSCR
- —
- Eligible?
- —
Short-term bridge; refi at stabilization.
Listing history 22 events
-
2026-06-21days on market $3,800,000 Active 80 DOM
-
2026-06-18days on market $3,800,000 Active 77 DOM
-
2026-06-17days on market $3,800,000 Active 76 DOM
-
2026-06-16days on market $3,800,000 Active 75 DOM
-
2026-06-15days on market $3,800,000 Active 74 DOM
-
2026-06-13days on market $3,800,000 Active 72 DOM
-
2026-06-13days on market $3,800,000 Active 71 DOM
-
2026-06-09days on market $3,800,000 Active 68 DOM
-
2026-06-08days on market $3,800,000 Active 67 DOM
-
2026-06-07days on market $3,800,000 Active 66 DOM
-
2026-06-04days on market $3,800,000 Active 63 DOM
-
2026-06-03days on market $3,800,000 Active 62 DOM
-
2026-06-02days on market $3,800,000 Active 61 DOM
-
2026-06-01days on market $3,800,000 Active 60 DOM
-
2026-05-31days on market $3,800,000 Active 59 DOM
-
2026-04-02$3,800,000 Active 995-char remark
Show marketing remark (995 chars)
Description Field Luxury Multi-Family Investment or TIC Opportunity in Eureka Valley. Discover a rare opportunity to own a 3-unit building in one of San Francisco's most desirable neighborhoods. This building is perfectly suited for a savvy investor looking for the whole building or buyers interested in independent Tenancy in Common (TIC) units. Ownership & Recent $1M+ Investment Owned by a dedicated partnership for the last 3 years, this property has undergone an extensive $1,000,000+ transformation focused on the spectacular top unit (Unit 3) and building-wide infrastructure. The Penthouse (Unit 3) Highlights: Expansion & Design: A full tri-level remodel featuring a modern open-plan layout and major structural enhancements. Outdoor Living: Direct access to an expansive, brand-new backyard and multiple extended decks designed to maximize the sweeping city views. Building-Wide Upgrades & Features: Modern Conveniences: Every unit features a new dishwasher and an in-unit
-
2021-01-20soldstatus $1,875,000 Closed 471-char remark
Show marketing remark (471 chars)
130 Grand View Avenue is an opportunity to own a 3-Unit building in San Francisco's desirable Eureka Valley neighborhood. The property has stunning, sweeping views of the city from all units. The building is comprised of a tri-level Two Bedroom Penthouse Unit with bonus room, 2-One Bedroom Units, and a 3+ Car Carport with additional storage space. The Penthouse Unit features a large front deck with city views and direct access to a back deck and lovely backyard area.
-
2021-01-19soldstatus $1,875,000
-
2020-12-29status Pending 471-char remark
Show marketing remark (471 chars)
130 Grand View Avenue is an opportunity to own a 3-Unit building in San Francisco's desirable Eureka Valley neighborhood. The property has stunning, sweeping views of the city from all units. The building is comprised of a tri-level Two Bedroom Penthouse Unit with bonus room, 2-One Bedroom Units, and a 3+ Car Carport with additional storage space. The Penthouse Unit features a large front deck with city views and direct access to a back deck and lovely backyard area.
-
2020-10-26price $1,995,000 471-char remark
Show marketing remark (471 chars)
130 Grand View Avenue is an opportunity to own a 3-Unit building in San Francisco's desirable Eureka Valley neighborhood. The property has stunning, sweeping views of the city from all units. The building is comprised of a tri-level Two Bedroom Penthouse Unit with bonus room, 2-One Bedroom Units, and a 3+ Car Carport with additional storage space. The Penthouse Unit features a large front deck with city views and direct access to a back deck and lovely backyard area.
-
2020-10-09price $2,145,000 471-char remark
Show marketing remark (471 chars)
130 Grand View Avenue is an opportunity to own a 3-Unit building in San Francisco's desirable Eureka Valley neighborhood. The property has stunning, sweeping views of the city from all units. The building is comprised of a tri-level Two Bedroom Penthouse Unit with bonus room, 2-One Bedroom Units, and a 3+ Car Carport with additional storage space. The Penthouse Unit features a large front deck with city views and direct access to a back deck and lovely backyard area.
-
2020-09-21$2,295,000 Active 471-char remark
Show marketing remark (471 chars)
130 Grand View Avenue is an opportunity to own a 3-Unit building in San Francisco's desirable Eureka Valley neighborhood. The property has stunning, sweeping views of the city from all units. The building is comprised of a tri-level Two Bedroom Penthouse Unit with bonus room, 2-One Bedroom Units, and a 3+ Car Carport with additional storage space. The Penthouse Unit features a large front deck with city views and direct access to a back deck and lovely backyard area.
ⓘ Source: listings_history table (triggers on properties + properties_extension) + one-shot
backfill from property_details.listing_events for pre-trigger history.
Tax reassessment forecast CA · Resets to sale price
- Current annual tax
- $27,146 · $2,262/mo
- Projected year-2 tax
- $28,880 · $2,407/mo
- Expected delta
- +$1,734/yr (+$145/mo · 6.4%)
ⓘ Screening estimate from a state-policy table — verify with the county assessor before closing.
Climate risk First Street
- Flood 1/10 Low FEMA zone X (unshaded) · 0% chance over 30 yrs
- Wildfire 1/10 Low
- Heat 2/10 Low 7 d/yr ≥76°F today · 17 d/yr by 30 yrs out
- Wind 1/10 Low
- Air quality 8/10 Severe 15 unhealthy d/yr today · 15 by 30 yrs out
Nearby sold comps map
Loading sold comps map…
Walkable amenities ~0.75 mi
Loading nearby amenities…
Taxation est. · year 1
- Rental income
- $278,184
- − Mortgage interest
- −$212,859
- − Property taxes
- −$27,146
- − Insurance
- −$19,000
- − Repairs & maintenance
- −$22,255
- − Management
- −$22,255
- − Depreciation
- −$110,545
- Taxable loss
- −$135,876
- Est. tax savings @ 24.0%
- +$32,610
- After-tax cash flow
- $-32,902/yr
For passive investors: Depreciation is non-cash, so a rental often shows a tax loss while cash-flowing — sheltering income. Rental losses are passive: they offset passive income freely, and up to $25,000/yr can offset ordinary (W-2) income if you actively participate and your MAGI is under $100k (phasing out to $0 by $150k); unused losses carry forward. On sale, claimed depreciation is recaptured at up to 25%, and gains may owe capital-gains tax (a 1031 exchange can defer both). Figures are a year-1 estimate at your 24.0% rate — not tax advice; consult a CPA.
Schools (NCES district)
- District
- San Francisco Unified
- NCES district ID
- 0634410
- Math proficiency
- 50% ▬ 0.00%
- Reading proficiency
- 56% ▲ 1.00%
- Median HH income
- $81,249
- Composite
- 50.14/100
- National rank
- #4088
- State rank
- #322 of 1400 in CA
Livability — San Francisco
- Score
- 76/100
- State rank
- #90
- US rank
- #3143
Category grades
Schools grade is shown separately in the Schools card above.
Census & demographics
- Census place
- San Francisco, CA
- County
- San Francisco County · 827,552 people
- City population
- 827,552
- Metro
- San Francisco-Oakland-Berkeley, CA
- Population (ZIP)
- 33,020
- Household income
- $204,134
- Rent vs Own
- Severe rent burden
- 1336.0
Population outlook (San Francisco County) Hauer SSP2
- Today (2025)
- 1,030,936 people
- By 2030
- 1,110,409 · +7.7%
- By 2040
- 1,270,010 · +23.2%
- By 2050
- 1,435,001 · +39.2%
- By 2075
- 1,779,074 · +72.6%
- By 2100
- 1,966,767 · +90.8%
Race, ethnicity, and origin ACS 2023
- Neighborhood character
- Predominantly White (65%)
- Race & ethnicity
- White 65% Asian 14% Two or more races 12% Hispanic / Latino 10% Black 2%
- Hispanic origin (detail)
- Mexican 5%
- Common ancestry
- Lithuanian 4% Italian 4% Romanian 3%
- Foreign-born
- 20% · Canada, China, Vietnam
- Languages at home
- 77% English-only · Spanish 6% Chinese 4% Other Indo-European 4%
Political lean MEDSL · San Francisco
- 2024 margin
- Solid D (+64.8) · D 80.3% · R 15.5% · Other 4.1%
- 2008→2024 swing
- -5.7pp toward R · 2008: 70.5pp · 2024: 64.8pp
- All cycles
- 2024: D+64.8 2020: D+72.5 2016: D+76.1 2012: D+70.2 2008: D+70.5
Not yet ingested
- Civics
- —
Market trends
- HPI YoY
- ▲ 9.51%
- Current HPI
- 223.6988
- Rent YoY
- ▲ 14.40%
- Metro
- San Francisco-Oakland-Berkeley, CA
- State GDP YoY
- ▲ 3.21%
- F500 in state
- 116
Industry mix (Fortune 500 HQ in CA)
| Industry | F500 HQs | Revenue |
|---|---|---|
| Technology | 27 | $1,492B |
|
||
| Financial Services | 3 | $174B |
|
||
| Retail | 3 | $44B |
|
||
| Insurance | 3 | $26B |
|
||
| Media / Entertainment | 2 | $115B |
|
||
| Pharmaceuticals / Biotech | 2 | $62B |
|
||
Price history
+65.6% since first listed7 events — show timeline
- 2026-04-02 Listed $3,800,000 bridgeMLS, Bay East AOR, or Contra Costa AOR
- 2021-01-20 Sold (MLS) $1,875,000 San Francisco MLS
- 2021-01-19 Sold (Public Records) $1,875,000 Public Records
- 2020-12-29 Pending — San Francisco MLS
- 2020-10-26 Price Changed $1,995,000 San Francisco MLS
- 2020-10-09 Price Changed $2,145,000 San Francisco MLS
- 2020-09-21 Listed $2,295,000 San Francisco MLS
Property tax history
+16.5%/yrLatest (2025): $27,146 · +3.1% YoY. Source: county tax records.
Cash-flow waterfall
monthlySold comps — $/sqft
last 12 mo · ≤1 miLoading sold comps…