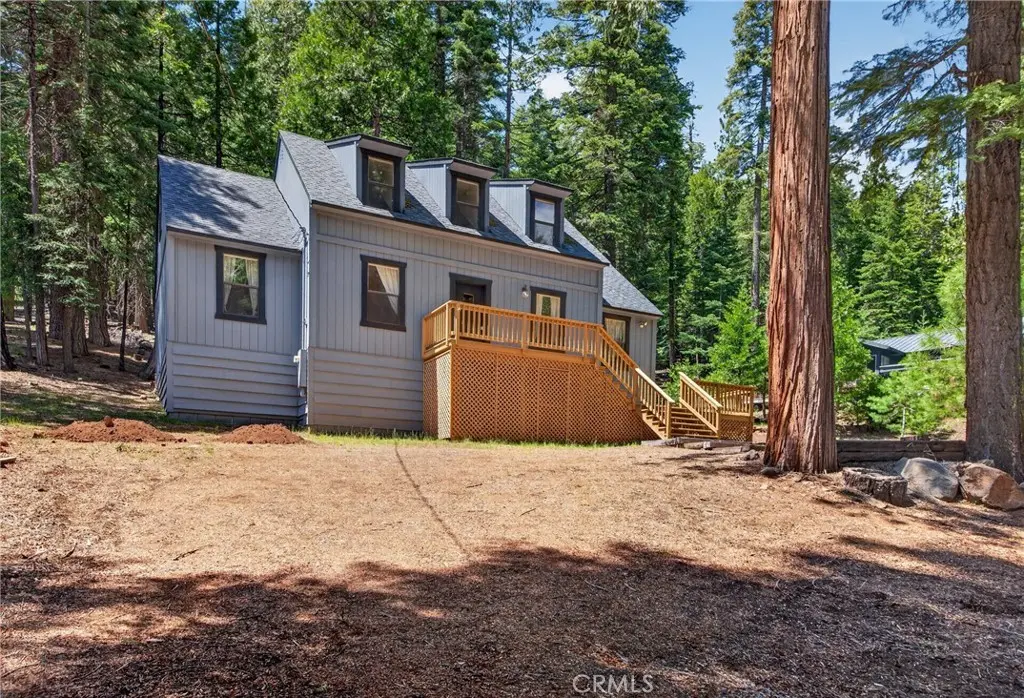
627 Cedar Canyon Rd · Lake Almanor Country Club, CA
Flood risk 1/10 · Minimal
- FEMA flood zone
- X (unshaded)
- Chance of flooding over 30 yrs
- 0.0%
- Est. flood insurance / yr
- $473 – $860
Fire risk 4/10 · Minor
- Est. fire insurance / yr
- $659 – $1,223
Heat risk 3/10 · Minor
- Hot days now (above 89°F)
- 7 days/yr
- Hot days in 30 yrs
- 17 days/yr
Wind risk 1/10 · Minimal
- Chance of severe wind over 30 yrs
- —
Air-quality risk 10/10 · Severe
- Unhealthy air days now
- 21 days/yr
- Unhealthy air days in 30 yrs
- 25 days/yr
Risk factors via First Street. Map © Google.
Why this score? — see what drove the C grade
The composite is a weighted blend of 9 inputs, each scored 0–100. Each bar is that input's sub-score; the figure is the points it added to the 100-point composite (weight × sub-score).
- Cash flow +16.8/30.0
- ARV discount +15.0/15.0
- Appreciation +5.7/10.0
- DSCR +5.2/10.0
- 1% rule +4.3/10.0
- Schools +2.8/10.0
- Livability +2.7/5.0
- Rent growth +2.5/5.0
- Condition / age +2.5/5.0
$459,000
🖨 Deal sheet 📄 Offer letter ✓ Due diligence
Listing remarks
Welcome to your perfect mountain escape in the highly sought-after Lake Almanor Country Club! This beautifully maintained 4 bedroom, 2.5 bath home offers the ideal blend of comfort, recreation and natural beauty~all just a short 5 minute walk to public beach access on stunning Lake Almanor. Step inside and immediately feel at home with a cozy fireplace that anchors the inviting living space, perfect for relaxing after a day on the lake or enjoying peaceful mountain evenings. The home features a formal dining room, ideal for hosting gatherings and holiday meals, while the well designed layout offers both functionality and charm throughout. The spacious primary suite includes its own private
Key facts
- 0.73 acre lot
- 2 garage spots
- Built 1983
Property features AI
Finance
- Other: Located in a community with lake, park, mountainous terrain, fishing and watersports
- HOA & community: Part of LACC association; Annual association fee; Association amenities include golf, tennis, pickleball, bocce ball, clubhouse, playground, hiking and biking trails, picnic and outdoor cooking/barbecue areas, security and watersports
Exterior
- Parking: Front-entry garage with two doors; 2 garage spaces (2 total parking spaces)
- Security: Card/code access; Guarded community; Gated community with attendant; Community security amenity
- Utilities: Propane; Septic tank
- Home design: House; Two stories; Entry on level 1; No common walls
- Construction: Year built from assessor's data
- Exterior features: Porch (including rear porch); Deck; Patio; Treed lot; Up slope from street; Has lake rights, beach access and lake on/near lot; Has view
Interior
- Kitchen: Garbage disposal; Microwave; Refrigerator; Dishwasher; Formal dining area; Tile counters
- Bedrooms: Main floor primary bedroom; Main floor bedrooms (3 on main level); Additional bedrooms include loft and bonus room
- Flooring: Carpet
- Bathrooms: 2 full bathrooms; 1 half bathroom; Bathrooms include bathtub and shower
- Heating & cooling: Fireplace heating (fireplace located in family room)
- Interior features: Wet bar; High ceilings (9+ feet); Tile counters; Cathedral/vaulted ceilings; Two levels; Stairs entry; Main level has 2 bathrooms and 3 bedrooms; Card/code access and guarded gated community with attendant
- Laundry & utility: Laundry inside; Laundry in closet
Neighborhood map
What this means for you Summary
Snapshot
- This is a 4-bed/2.5-bath single-family listed at $459k.
Deal economics
- At list price, monthly cash flow is $295 ($4k/yr) — positive.
- The deal already cash-flows at list — no discount required.
- To meet the 1% rule (rent ≥ 1% of price), the offer needs to be $425k (7.4% below list).
- Recommended offer: $425k (7.4% below list) — sets the bar for 1% rule.
- Cap rate 7.1% vs local median 3.2% in Lake Almanor Country Club — top-decile yield for the area; either an underpriced asset or a hidden risk that comps aren't pricing in. Stress-test before assuming the spread holds.
Location & tenants
- Location reads 54/100 on livability (#895 in CA) — a working-class tenant base; expect higher turnover. Strengths: employment A+, crime B+; Watch: amenities F, commute F, cost of living F.
- Plumas Unified (rural): math 21% / reading 44% proficiency, ranked #306 of 517 in CA (top 59%) — families likely to look elsewhere, expect single-tenant / working-renter base with shorter leases.
- Market conditions: 240 active listings in the ZIP; 1 comparable units currently listed for rent nearby; 39 units permitted in Plumas County in 2024 (0 in 5+ unit buildings).
Forward outlook
- In year one you build about $9k of equity ($3k loan paydown + $6k appreciation (1.4% local appreciation)).
- Plumas County population projected at -42% by 2050 — secular population decline; favor cash flow + early exit over multi-decade hold.
- At projected returns (1.4% appreciation + 3.0% rent growth), your $129k cash investment doubles in ~8 years — after that, you're playing with house money.
- By year 4, paydown + projected appreciation supports a ~$34k cash-out refi (75% LTV) — recoverable capital for the next deal without selling this one.
Negotiation context
- It's been on market 43 days — a 3% lower offer ($445k) is reasonable based on typical stale-listing flexibility.
- Current owner paid $114k; list at $459k implies a 303% gain — meaningful room to come down on a strong offer.
Questions for the listing agent
- It's been on market 43 days. Have you received any prior offers? Is the seller open to a 7% concession, seller financing, or rate buy-down credit?
- What does the HOA fee cover, when was the last increase, and are there any pending special assessments or reserve-fund shortfalls?
- Is there a deadline driving the sale (1031 exchange, divorce, estate, relocation)? That informs how much negotiation room exists.
- What's the average days-on-market for RENTAL listings here right now (not sales)? A rising rental-DOM trend means longer vacancies and softer asking-rent achievability than the comps imply.
- What's the recent tenant-quality profile in this submarket — average credit score on applications, eviction rate, late-payment / NSF rate, and stable-employment percentage? A property-management company in the area should have these aggregated.
- How much new for-sale + rental construction is in the pipeline within 1–3 miles? Heavy new supply typically softens prices + rents 12–24 months out; constrained supply supports both.
Investment metrics
- 1% rule
- 0.93% ✗
- Cap rate
- 7.06%
- Cash-on-cash
- 2.75%
- DSCR
- 1.12
- GRM
- 9.0
CMA / ARV
- ARV (median comp)
- $587,977
- List price
- $459,000
- Delta
- -21.94%
- Verdict
- UNDERPRICED
- Comps
- 20 within 1.0 mi
Show comp detail 12 sales within ~0.75 mi
| Address | Dist | Beds/Ba | Sqft | Sold | Price | $/sf | Match |
|---|---|---|---|---|---|---|---|
| 608 Cedar Canyon Road Rd | 0.15mi | 3/2.5 (-1) | 1,851 (-2%) | 1mo | $585,865 | $317 | 83 |
| 637 Peninsula Drive Dr | 0.32mi | 3/3.0 (-1) | 1,885 (-1%) | 10mo | $650,000 | $345 | 69 |
| 666 Peninsula Drive Dr | 0.25mi | 4/3.0 | 1,976 (+4%) | 13mo | $1,400,000 | $709 | 68 |
| 625 Deep Forest Rd | 0.37mi | 3/2.0 (-1) | 1,944 (+2%) | 7mo | $540,000 | $278 | 66 |
| 711 Lake Ridge Road Rd | 0.40mi | 3/2.5 (-1) | 2,000 (+5%) | 4mo | $556,000 | $278 | 64 |
| 601 Peninsula Drive Dr | 0.43mi | 4/2.5 | 2,106 (+11%) | 2mo | $782,000 | $371 | 60 |
| 620 Clifford Drive Dr | 0.59mi | 3/2.0 (-1) | 1,917 (+1%) | 12mo | $710,000 | $370 | 54 |
| 603 Lake Ridge Road Rd | 0.32mi | 4/2.5 | 2,160 (+14%) | 10mo | $350,000 | $162 | 53 |
| 602 Lake Ridge Road Rd | 0.27mi | 3/2.0 (-1) | 1,624 (-14%) | 9mo | $545,000 | $336 | 49 |
| 540 Peninsula Drive Dr | 0.50mi | 3/2.0 (-1) | 1,668 (-12%) | 8mo | $685,000 | $411 | 43 |
| 642 W Burnt Cedar Road Rd | 0.70mi | 3/2.5 (-1) | 1,698 (-10%) | 8mo | $566,000 | $333 | 39 |
| 544 Ponderosa Dr | 0.50mi | 3/2.0 (-1) | 1,615 (-15%) | 10mo | $425,000 | $263 | 36 |
Match score weights: distance 35% · size 25% · config 20% · recency 20%. Top-matched comps best support the ARV.
Projected returns pro-forma
1.38% appreciation · 3.0% rent growth · sell at horizon
- IRR
- 5.4%
- Equity multiple
- 1.28×
- Total profit
- $35,870
- Equity at exit
- $165,769
- IRR
- 9.4%
- Equity multiple
- 2.18×
- Total profit
- $152,243
- Equity at exit
- $227,487
Cash invested: $128,520 (down + closing). Projections, not guarantees.
Landlord ↔ Tenant lean methodology
- Overall (STATE)
- 18 Strongly Tenant-Friendly
- State California
- 18 Strongly Tenant-Friendly · D+13
- County
- — inherits STATE
- City
- — inherits STATE
ZIP-level market 96137
- Home prices YoY
- 0.9%
- Active inventory
- 240
- Price-to-rent
- 9.0×
Monthly cashflow live
- Estimated rent
- $4,250 medium interval (Pro) →
- Mortgage (P&I)
- −$2,407
- Tax from tax record
- −$216 /mo · $2,588/yr
- Insurance
- −$191
- HOA
- −$249
- Vacancy / Maint / Mgmt
- −$892
- Net cashflow
- $295
Break-even live
UW: 25.0% down · 7.5% · 30yr · 1.5% tax · 5.0% vac · 8.0% maint · 8.0% mgmt
Financing live
Cash to close
- Down payment
- $114,750
- Closing costs
- $13,770
- Reserves months
- —
- Total cash needed
- —
Loan-product check · same deal, 3 products live
Conventional
25% down · 7.5% · 30yr
- Down + closing
- —
- Monthly P&I
- —
- Monthly cashflow
- —
- DSCR
- —
- Eligible?
- —
Personal DTI + credit; lowest rate.
DSCR
20% down · 8.5% · 30yr
- Down + closing
- —
- Monthly P&I
- —
- Monthly cashflow
- —
- DSCR
- —
- Eligible?
- —
No personal income docs; deal must DSCR.
Hard money
10% down · 12.0% · 12mo
- Down + closing
- —
- Monthly P&I
- —
- Monthly cashflow
- —
- DSCR
- —
- Eligible?
- —
Short-term bridge; refi at stabilization.
Rent comps 1 comps
| Address | Beds | Baths | Sqft | Rent | $/sqft | DOM | Units | Dist |
|---|---|---|---|---|---|---|---|---|
| 601 W Burnt Cedar Rd Westwood, CA | 3.0 | 3.0 | 2100 | $4,250 | $2.02 | 44d | 1 | 0.61mi |
HOA detail
- Monthly dues
- $249 · $2,988/yr
Listing history 19 events
-
2026-06-19days on market $459,000 Active 43 DOM
-
2026-06-18days on market $459,000 Active 42 DOM
-
2026-06-17days on market $459,000 Active 41 DOM
-
2026-06-16days on market $459,000 Active 40 DOM
-
2026-06-15days on market $459,000 Active 39 DOM
-
2026-06-14days on market $459,000 Active 37 DOM
-
2026-06-13days on market $459,000 Active 36 DOM
-
2026-06-10days on market $459,000 Active 34 DOM
-
2026-06-09days on market $459,000 Active 33 DOM
-
2026-06-08days on market $459,000 Active 32 DOM
-
2026-06-07days on market $459,000 Active 31 DOM
-
2026-06-05days on market $459,000 Active 28 DOM
-
2026-06-03days on market $459,000 Active 27 DOM
-
2026-06-02days on market $459,000 Active 26 DOM
-
2026-06-01days on market $459,000 Active 25 DOM
-
2026-05-31days on market $459,000 Active 24 DOM
-
2026-05-30days on market $459,000 Active 23 DOM
-
2026-05-07$459,000 Active 1508-char remark
-
1990-04-10soldstatus $114,000
ⓘ Source: listings_history table (triggers on properties + properties_extension) + one-shot
backfill from property_details.listing_events for pre-trigger history.
Tax reassessment forecast CA · Resets to sale price
- Current annual tax
- $2,588 · $216/mo
- Projected year-2 tax
- $3,488 · $291/mo
- Expected delta
- +$900/yr (+$75/mo · 34.8%)
ⓘ Screening estimate from a state-policy table — verify with the county assessor before closing.
Climate risk First Street
- Flood 1/10 Low FEMA zone X (unshaded) · 0% chance over 30 yrs
- Wildfire 4/10 Moderate
- Heat 3/10 Moderate 7 d/yr ≥89°F today · 17 d/yr by 30 yrs out
- Wind 1/10 Low
- Air quality 10/10 Extreme 21 unhealthy d/yr today · 25 by 30 yrs out
Nearby sold comps map
Loading sold comps map…
Walkable amenities ~0.75 mi
Loading nearby amenities…
Taxation est. · year 1
- Rental income
- $51,000
- − Mortgage interest
- −$25,711
- − Property taxes
- −$2,588
- − Insurance
- −$2,295
- − Repairs & maintenance
- −$4,080
- − Management
- −$4,080
- − HOA
- −$2,988
- − Depreciation
- −$13,353
- Taxable loss
- −$4,095
- Est. tax savings @ 24.0%
- +$983
- After-tax cash flow
- $4,517/yr
For passive investors: Depreciation is non-cash, so a rental often shows a tax loss while cash-flowing — sheltering income. Rental losses are passive: they offset passive income freely, and up to $25,000/yr can offset ordinary (W-2) income if you actively participate and your MAGI is under $100k (phasing out to $0 by $150k); unused losses carry forward. On sale, claimed depreciation is recaptured at up to 25%, and gains may owe capital-gains tax (a 1031 exchange can defer both). Figures are a year-1 estimate at your 24.0% rate — not tax advice; consult a CPA.
Schools (NCES district)
- District
- Plumas Unified
- NCES district ID
- 0631170
- Math proficiency
- 21% ▼ -11.00%
- Reading proficiency
- 44% ▬ 0.00%
- Median HH income
- $46,935
- Composite
- 27.89/100
- National rank
- #6870
- State rank
- #306 of 517 in CA
Livability — Lake Almanor Country Club
- Score
- 54/100
- State rank
- #895
- US rank
- #23890
Category grades
Schools grade is shown separately in the Schools card above.
Census & demographics
- Census place
- Lake Almanor Country Club, CA
- Population (ZIP)
- 2,717
Population outlook (Plumas County) Hauer SSP2
- Today (2025)
- 15,564 people
- By 2030
- 14,014 · -10.0%
- By 2040
- 11,197 · -28.1%
- By 2050
- 9,069 · -41.7%
- By 2075
- 5,573 · -64.2%
- By 2100
- 3,392 · -78.2%
Race, ethnicity, and origin ACS 2023
- Neighborhood character
- Predominantly White (81%)
- Race & ethnicity
- White 81% Hispanic / Latino 10% Two or more races 8% Native American 4%
- Hispanic origin (detail)
- Mexican 5%
- Common ancestry
- Slovak 4% Lithuanian 3% Italian 2%
- Foreign-born
- 4% · Canada
- Languages at home
- 93% English-only · Spanish 5% Other Indo-European 1%
Political lean MEDSL · Plumas
- 2024 margin
- R (+16.9) · D 39.9% · R 56.9% · Other 3.2%
- 2008→2024 swing
- -5.0pp toward R · 2008: -12.0pp · 2024: -16.9pp
- All cycles
- 2024: R+16.9 2020: R+16.7 2016: R+21.0 2012: R+17.2 2008: R+12.0
Not yet ingested
- Civics
- —
Market trends
- HPI YoY
- ▲ 1.38%
- Current HPI
- 153.1005
- Rent YoY
- —
- Metro
- —
- State GDP YoY
- ▲ 3.21%
- F500 in state
- 116
Industry mix (Fortune 500 HQ in CA)
| Industry | F500 HQs | Revenue |
|---|---|---|
| Technology | 27 | $1,492B |
|
||
| Financial Services | 3 | $174B |
|
||
| Retail | 3 | $44B |
|
||
| Insurance | 3 | $26B |
|
||
| Media / Entertainment | 2 | $115B |
|
||
| Pharmaceuticals / Biotech | 2 | $62B |
|
||
Price history
+302.6% since first listed2 events — show timeline
- 2026-05-07 Listed $459,000 CRMLS
- 1990-04-10 Sold (Public Records) $114,000 Public Records
Property tax history
+2.8%/yrLatest (2025): $2,588 · -0.5% YoY. Source: county tax records.
Cash-flow waterfall
monthlySold comps — $/sqft
last 12 mo · ≤1 miLoading sold comps…