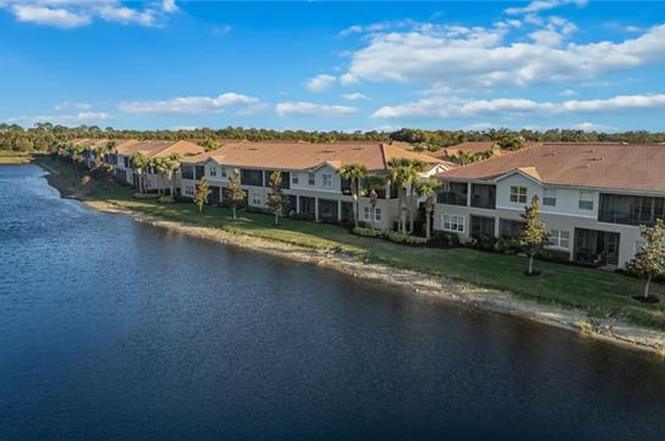
6553 Monterey Pt #204 · Vineyards, FL
Flood risk 4/10 · Minor
- FEMA flood zone
- X (unshaded)
- Chance of flooding over 30 yrs
- 0.13%
- Est. flood insurance / yr
- $507 – $1,088
Fire risk 1/10 · Minimal
- Est. fire insurance / yr
- $947 – $1,759
Heat risk 10/10 · Severe
- Hot days now (above 107°F)
- 7 days/yr
- Hot days in 30 yrs
- 31 days/yr
Wind risk 10/10 · Severe
- Chance of severe wind over 30 yrs
- 99.0%
Air-quality risk 2/10 · Minimal
- Unhealthy air days now
- 2 days/yr
- Unhealthy air days in 30 yrs
- 2 days/yr
Risk factors via First Street. Map © Google.
Why this score? — see what drove the C- grade
The composite is a weighted blend of 9 inputs, each scored 0–100. Each bar is that input's sub-score; the figure is the points it added to the 100-point composite (weight × sub-score).
- Cash flow +16.9/30.0
- ARV discount +7.5/15.0
- 1% rule +6.0/10.0
- DSCR +5.2/10.0
- Schools +5.0/10.0
- Condition / age +4.0/5.0
- Livability +3.2/5.0
- Rent growth +2.7/5.0
- Appreciation +0.0/10.0
$565,000
🖨 Deal sheet (PDF) 📄 Offer letter ✓ Due diligence
Listing remarks
AMAZING VALUE!! Located in the highly sought-after, gated community of Marbella Lakes in the heart of Naples, this rarely available second floor “Napoli” coach home represents one of the most compelling values in the neighborhood, offering peaceful privacy with no road noise and an abundance of natural light throughout. Perfectly positioned within the community, this spacious and meticulously maintained 3-bedroom plus den, 2.5-bath residence with a private two-car garage truly lives like a single-family home and is available with a negotiable furnishings package for immediate enjoyment. Freshly painted in a crisp, contemporary palette, the kitchen showcases expansive shaker sty
Key facts
- Gated community
- Natural light
- Large pantry
Tags
Neighborhood map
What this means for you Summary
Snapshot
- This is a 3-bed/2.5-bath condo listed at $565k. Condition is rated good.
Deal economics
- At list price, monthly cash flow is $368 ($4k/yr) — positive.
- The deal already cash-flows at list — no discount required.
- Meets the 1% rule at list price ($6k rent vs $565k).
- Recommended offer: $557k (1.5% below list) — sets the bar for market timing.
Location & tenants
- Location reads 64/100 on livability (#679 in FL) — a middle-class / working-renter tenant base. Strengths: crime A+, employment A+, housing A-; Watch: health & safety D, amenities F, commute F.
- Collier (suburban): math 60% / reading 56% proficiency, ranked #16 of 73 in FL (top 22%) — acceptable for families but not a draw, mixed tenant base, ~2y average lease.
- Zoned schools: Poinciana Elementary School (math 64% / reading 63%, grade B, #564 of 2,144 statewide, top 27%, 507 students, 55% FRL); Gulfview Middle School (math 78% / reading 68%, grade A, #44 of 571 statewide, top 8%, 582 students, 40% FRL); Naples High School (math 47% / reading 52%, grade D, #179 of 667 statewide, top 29%, 1,719 students, 39% FRL).
- Market conditions: Rents flat; 334 active listings in the ZIP; 24 comparable units currently listed for rent nearby; rentals at typical pace (median 25d on market — plan ~3-4 weeks tenant-placement turnaround); solid renter incomes; 3,520 units permitted in Collier County in 2024 (959 in 5+ unit buildings).
- At $6,210/mo this rent would consume 81% of the median local household income ($92k/yr) (locally 780% of renters already pay >50% of income on rent) — very limited rent-growth headroom before tenants either downsize or default.
Forward outlook
- Local home prices are declining (-3.0%/yr); year-one equity from $4k of loan paydown is wiped out by about $17k of value loss. Plan a longer hold.
- Collier County population projected at +30% by 2050 — long-run rental-demand tailwind backs the buy-and-hold thesis.
Negotiation context
- It's been on market 17 days — a 2% lower offer ($557k) is reasonable based on typical stale-listing flexibility.
Risks & watch-outs
- Climate carrying-cost: severe wind risk, 99% chance of damaging wind over 30y; extreme-heat days projected 7→31/yr by 2055 (HVAC capex compounding) — expect insurance premiums to compound above CPI over the hold.
Questions for the listing agent
- What does the HOA fee cover, when was the last increase, and are there any pending special assessments or reserve-fund shortfalls?
- Any open or pending special assessments — roof, HVAC, plumbing, elevator, façade? What's the per-unit balance and payoff schedule, and is the seller paying it off at close or rolling it to the buyer?
- Is there a deadline driving the sale (1031 exchange, divorce, estate, relocation)? That informs how much negotiation room exists.
- What's the average days-on-market for RENTAL listings here right now (not sales)? A rising rental-DOM trend means longer vacancies and softer asking-rent achievability than the comps imply.
- What's the recent tenant-quality profile in this submarket — average credit score on applications, eviction rate, late-payment / NSF rate, and stable-employment percentage? A property-management company in the area should have these aggregated.
- How much new apartment / multifamily construction is in the pipeline within 1–3 miles? Heavy new supply (>2% of stock underway) typically softens rents 12–24 months out; light construction supports rent growth.
Investment metrics
- 1% rule
- 1.10% ✓
- Cap rate
- 7.08%
- Cash-on-cash
- 2.79%
- DSCR
- 1.12
- GRM
- 7.6
CMA / ARV
No comps found within radius.
Projected returns pro-forma
-3.0% appreciation · 0.85% rent growth · sell at horizon
- IRR
- -14.6%
- Equity multiple
- 0.49×
- Total profit
- $-80,756
- Equity at exit
- $84,243
- IRR
- -10.5%
- Equity multiple
- 0.43×
- Total profit
- $-89,834
- Equity at exit
- $48,851
Cash invested: $158,200 (down + closing). Projections, not guarantees.
Landlord ↔ Tenant lean methodology
- Overall (STATE)
- 87 Strongly Landlord-Friendly
- State Florida
- 87 Strongly Landlord-Friendly · R+3
- County
- — inherits STATE
- City
- — inherits STATE
ZIP-level market 34105
- Home prices YoY
- -30.5%
- Rents YoY
- 0.8%
- Active inventory
- 334
- Price-to-rent
- 7.6×
Monthly cashflow live
- Estimated rent
- $6,210 high interval (Pro) →
- Mortgage (P&I)
- −$2,963
- Tax est. 1.5%
- −$706 /mo · $8,475/yr
- Insurance
- −$235
- HOA
- −$633
- Vacancy / Maint / Mgmt
- −$1,304
- Net cashflow
- $368
Break-even live
Sensitivity live
| Price | -10% $759 | -5% $564 | +0% $368 | +5% $173 | +10% $-22 |
|---|---|---|---|---|---|
| Rent | -10% $-122 | -5% $123 | +0% $368 | +5% $614 | +10% $859 |
| Rate | -1.0pp $653 | -0.5pp $512 | base $368 | +0.5pp $222 | +1.0pp $73 |
UW: 25.0% down · 7.5% · 30yr · 1.5% tax · 5.0% vac · 8.0% maint · 8.0% mgmt
Financing live
Cash to close
- Down payment
- $141,250
- Closing costs
- $16,950
- Reserves months
- —
- Total cash needed
- —
Loan-product check · same deal, 3 products live
Conventional
25% down · 7.5% · 30yr
- Down + closing
- —
- Monthly P&I
- —
- Monthly cashflow
- —
- DSCR
- —
- Eligible?
- —
Personal DTI + credit; lowest rate.
DSCR
20% down · 8.5% · 30yr
- Down + closing
- —
- Monthly P&I
- —
- Monthly cashflow
- —
- DSCR
- —
- Eligible?
- —
No personal income docs; deal must DSCR.
Hard money
10% down · 12.0% · 12mo
- Down + closing
- —
- Monthly P&I
- —
- Monthly cashflow
- —
- DSCR
- —
- Eligible?
- —
Short-term bridge; refi at stabilization.
Rent comps 24 comps
| Address | Beds | Baths | Sqft | Rent | $/sqft | DOM | Units | Dist |
|---|---|---|---|---|---|---|---|---|
| 6559 Monterey Pt Naples, FL | 3.0 | 2.0 | 2300 | $9,000 | $3.91 | 22d | 1 | 0.07mi |
| 6548 Monterey Pt Unit 204 Naples, FL | 3.0 | 2.5 | 2288 | $6,000 | $2.62 | 15d | 1 | 0.07mi |
| 6542 Marbella Dr Naples, FL | 3.0 | 2.5 | 2144 | $6,250 | $2.92 | 25d | 1 | 0.16mi |
| 6525 Monterey Pt Unit 203 Naples, FL | 3.0 | 2.5 | 2288 | $5,250 | $2.29 | 15d | 1 | 0.18mi |
| 12839 Carrington Cir Unit 8-102 Naples, FL | 3.0 | 2.0 | 2063 | $6,500 | $3.15 | 25d | 1 | 0.28mi |
| 836 Hampton Cir #171 Naples, FL | 3.0 | 2.5 | 1580 | $5,000 | $3.16 | 22d | 1 | 0.36mi |
| 836 Hampton Cir #171 Naples, FL | 3.0 | 2.5 | 1580 | $5,000 | $3.16 | 25d | 1 | 0.36mi |
| 6670 Marbella Ln Naples, FL | 3.0 | 3.0 | 2439 | $8,400 | $3.44 | 25d | 1 | 0.47mi |
| 12667 Biscayne Ct Naples, FL | 4.0 | 3.5 | 2600 | $8,500 | $3.27 | 25d | 1 | 0.68mi |
| 1256 Carpazi Ct #502 Naples, FL | 3.0 | 2.0 | 1744 | $2,495 | $1.43 | 25d | 1 | 0.69mi |
| 1256 Carpazi Ct Unit 502 Naples, FL | 3.0 | 2.0 | 1744 | $2,495 | $1.43 | 15d | 1 | 0.69mi |
| 1299 Verde Dr Unit 1503 Naples, FL | 3.0 | 2.0 | 1744 | $4,200 | $2.41 | 15d | 1 | 0.70mi |
| 1303 Verde Dr Unit 1603 Naples, FL | 3.0 | 2.0 | 1877 | $2,500 | $1.33 | 15d | 1 | 0.72mi |
| 13078 Pembroke Dr Naples, FL | 3.0 | 2.5 | 2024 | $6,500 | $3.21 | 25d | 1 | 0.80mi |
| 12885 Brynwood Way Naples, FL | 3.0 | 3.0 | 2489 | $10,000 | $4.02 | 25d | 1 | 0.84mi |
| 12848 Brynwood Way Naples, FL | 4.0 | 2.5 | 2689 | $6,000 | $2.23 | 25d | 1 | 0.88mi |
| 4752 Stratford Ct #1404 Naples, FL | 3.0 | 3.0 | 2686 | $8,500 | $3.16 | 25d | 1 | 0.89mi |
| 12914 Brynwood Preserve Ln Naples, FL | 2.0 | 2.0 | 1720 | $7,000 | $4.07 | 25d | 1 | 0.89mi |
| 4740 Stratford Ct #1603 Naples, FL | 3.0 | 3.0 | 2686 | $14,000 | $5.21 | 25d | 1 | 0.90mi |
| 12832 Brynwood Way Naples, FL | 3.0 | 2.0 | 1714 | $5,250 | $3.06 | 15d | 1 | 0.91mi |
| 12902 Brynwood Preserve Ln Naples, FL | 3.0 | 3.0 | 2100 | $7,500 | $3.57 | 25d | 1 | 0.91mi |
| 5858 Star Grass Ln Naples, FL | 4.0 | 2.0 | 2432 | $12,000 | $4.93 | 25d | 1 | 1.22mi |
| 3099 Lancaster Dr Unit 7-701 Naples, FL | 2.0 | 2.0 | 2160 | $10,000 | $4.63 | 25d | 1 | 1.41mi |
| 5065 Kensington High St Naples, FL | 3.0 | 3.0 | 2661 | $20,000 | $7.52 | 25d | 1 | 1.43mi |
HOA detail condo
- Monthly dues
- $633 · $7,596/yr
- Likely covers
- security
- Assessments
- None detected in remarks — confirm with the listing agent.
Listing history 2 events
-
2026-06-03remarks 687-char remark
-
2026-06-03$565,000 Pending 17 DOM
ⓘ Source: listings_history table (triggers on properties + properties_extension) + one-shot
backfill from property_details.listing_events for pre-trigger history.
Climate risk First Street
- Flood 4/10 Moderate FEMA zone X (unshaded) · 13% chance over 30 yrs
- Wildfire 1/10 Low
- Heat 10/10 Extreme 7 d/yr ≥107°F today · 31 d/yr by 30 yrs out
- Wind 10/10 Extreme 99% chance of damaging wind over 30 yrs
- Air quality 2/10 Low 2 unhealthy d/yr today · 2 by 30 yrs out
Nearby sold comps map
Loading sold comps map…
Walkable amenities ~0.75 mi
Loading nearby amenities…
Taxation est. · year 1
- Rental income
- $74,522
- − Mortgage interest
- −$31,649
- − Property taxes
- −$8,475
- − Insurance
- −$2,825
- − Repairs & maintenance
- −$5,962
- − Management
- −$5,962
- − HOA
- −$7,596
- − Depreciation
- −$16,436
- Taxable loss
- −$4,382
- Est. tax savings @ 24.0%
- +$1,052
- After-tax cash flow
- $5,473/yr
For passive investors: Depreciation is non-cash, so a rental often shows a tax loss while cash-flowing — sheltering income. Rental losses are passive: they offset passive income freely, and up to $25,000/yr can offset ordinary (W-2) income if you actively participate and your MAGI is under $100k (phasing out to $0 by $150k); unused losses carry forward. On sale, claimed depreciation is recaptured at up to 25%, and gains may owe capital-gains tax (a 1031 exchange can defer both). Figures are a year-1 estimate at your 24.0% rate — not tax advice; consult a CPA.
Condition & rehab AI · 13 photos
This well-maintained and updated condo is in good condition with no major repairs needed. Painting the exterior will further enhance its curb appeal and value.
Value-add opportunities
- Both Paint the exterior siding and trim — Painting the exterior will improve curb appeal and increase both resale and rental value.
Renovation cost estimate screening
Value-add ROI direction
- Both Paint the exterior siding and trim — Painting the exterior will improve curb appeal and increase both resale and rental value. ↑
ⓘ Cost ranges are severity-bucket heuristics (US national rule-of-thumb). Get contractor quotes + a written scope before underwriting a rehab budget.
Schools (NCES district)
- District
- Collier
- NCES district ID
- 1200330
- Math proficiency
- 60% ▼ -4.00%
- Reading proficiency
- 56% ▼ -2.00%
- Median HH income
- $58,275
- Composite
- 50.23/100
- National rank
- #1892
- State rank
- #16 of 73 in FL
Livability — Vineyards
- Score
- 64/100
- State rank
- #679
- US rank
- #14101
Category grades
Schools grade is shown separately in the Schools card above.
Census & demographics
- County
- Collier County · 396,295 people
- Metro
- Naples-Marco Island, FL
- Population (ZIP)
- 15,441
- Household income
- $92,214
- Rent vs Own
- Severe rent burden
- 780.0
Population outlook (Collier County) Hauer SSP2
- Today (2025)
- 420,858 people
- By 2030
- 450,054 · +6.9%
- By 2040
- 502,232 · +19.3%
- By 2050
- 544,932 · +29.5%
- By 2075
- 627,203 · +49.0%
- By 2100
- 659,015 · +56.6%
Race, ethnicity, and origin ACS 2023
- Neighborhood character
- Predominantly White (79%)
- Race & ethnicity
- White 79% Hispanic / Latino 14% Two or more races 7% Asian 5%
- Hispanic origin (detail)
- Mexican 3% Puerto Rican 1% Cuban 3% Salvadoran 1%
- Common ancestry
- Romanian 3% Lithuanian 3% Italian 3%
- Foreign-born
- 22% · Canada, China, Jamaica
- Languages at home
- 77% English-only · Spanish 11% Other Indo-European 3% Russian/Polish/Slavic 3%
Political lean MEDSL · Collier
- 2024 margin
- Solid R (+33.1) · D 33.1% · R 66.2%
- 2008→2024 swing
- -10.6pp toward R · 2008: -22.5pp · 2024: -33.1pp
- All cycles
- 2024: R+33.1 2020: R+24.7 2016: R+26.0 2012: R+30.1 2008: R+22.5
Not yet ingested
- Civics
- —
Market trends
- HPI YoY
- ▼ -124.65%
- Current HPI
- 283.9084
- Rent YoY
- ▲ 0.85%
- Metro
- Naples-Marco Island, FL
- State GDP YoY
- ▲ 3.28%
- F500 in state
- 36
Industry mix (Fortune 500 HQ in FL)
| Industry | F500 HQs | Revenue |
|---|---|---|
| Industrial Technology | 2 | $29B |
|
||
| Insurance | 2 | $17B |
|
||
| Retail | 1 | $60B |
|
||
| Technology Distribution | 1 | $58B |
|
||
| Homebuilding | 1 | $35B |
|
||
| Technology Manufacturing | 1 | $35B |
|
||
Price history
3 events — show timeline
- 2026-05-19 Pending — NAPLESMLS
- 2026-03-16 Pending — NAPLESMLS
- 2026-02-27 Listed $565,000 NAPLESMLS
Cash-flow waterfall
monthlySold comps — $/sqft
last 12 mo · ≤1 miLoading sold comps…