126 N 500 E #81 · Vernal, UT
Flood risk 1/10 · Minimal
- FEMA flood zone
- X (unshaded)
- Chance of flooding over 30 yrs
- 0.0%
- Est. flood insurance / yr
- $507 – $1,088
Fire risk 5/10 · Moderate
- Est. fire insurance / yr
- $453 – $841
Heat risk 3/10 · Minor
- Hot days now (above 93°F)
- 7 days/yr
- Hot days in 30 yrs
- 21 days/yr
Wind risk 1/10 · Minimal
- Chance of severe wind over 30 yrs
- —
Air-quality risk 3/10 · Minor
- Unhealthy air days now
- 3 days/yr
- Unhealthy air days in 30 yrs
- 3 days/yr
Risk factors via First Street. Map © Google.
Why this score? — see what drove the D+ grade
The composite is a weighted blend of 9 inputs, each scored 0–100. Each bar is that input's sub-score; the figure is the points it added to the 100-point composite (weight × sub-score).
- Cash flow +17.6/30.0
- ARV discount +7.5/15.0
- DSCR +5.5/10.0
- 1% rule +4.7/10.0
- Condition / age +4.0/5.0
- Livability +3.8/5.0
- Rent growth +3.5/5.0
- Schools +3.1/10.0
- Appreciation +0.0/10.0
$164,900
🖨 Deal sheet 📄 Offer letter ✓ Due diligence
Listing remarks
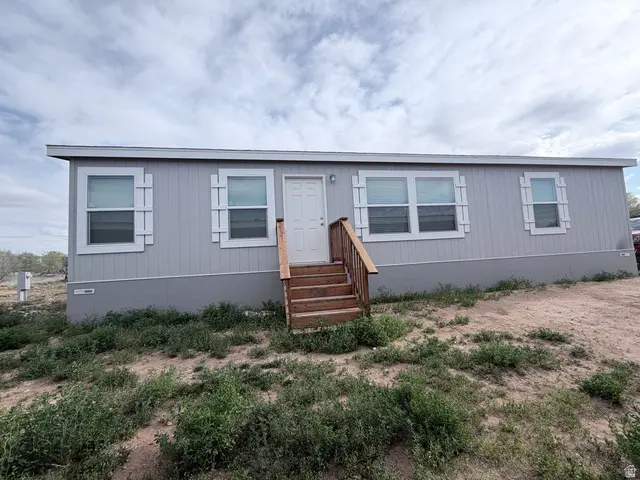
Welcome to this spacious, brand-new double-wide home offering 1,300 sq. ft. of comfortable living space with a bright open-concept layout. This 3-bedroom, 2-bath home features walk-in closets in every bedroom, providing ample storage throughout. Located in East Meadows Mobile Home Park, this home combines modern living with affordability. Monthly lot rent is just $480 and includes water, sewer, and trash services. Don't miss the opportunity to own this move-in-ready home in a great community!
Key facts
- Move-in-ready home
- Walk-in closets
- Open-concept layout
Tags
Property features AI
Finance
- Other: Approximately 1300 above-grade finished area
- Financial info: REO / Bank owned
Exterior
- Parking: Uncovered parking; Three open parking spaces (total 3 spaces)
- Security: Fire alarm
- Utilities: Natural gas connected; Electricity connected; Sewer connected; Water connected (culinary)
- Home design: Single-level living; Mobile home; Property is built/standing; Single-family zoning
- Construction: Asphalt roof
- Exterior features: Paved road access
Interior
- Kitchen: Refrigerator; Free standing range/oven
- Bedrooms: Three main-level bedrooms; Primary bedroom on the 1st floor
- Flooring: Carpet
- Bathrooms: One full bathroom; One three-quarter bathroom
- Heating & cooling: Forced air heating; Gas central heating
- Interior features: Fire alarm; Walk-in closet; Range/Oven (free standing); Blinds
- Laundry & utility: Electric dryer hookup
Neighborhood map
What this means for you Summary
Snapshot
- This is a 3-bed/2.0-bath manufactured listed at $165k. Condition is rated good.
Deal economics
- At list price, monthly cash flow is $130 ($2k/yr) — positive.
- The deal already cash-flows at list — no discount required.
- To meet the 1% rule (rent ≥ 1% of price), the offer needs to be $161k (2.6% below list).
- Recommended offer: $161k (2.6% below list) — sets the bar for 1% rule.
Location & tenants
- Location reads 75/100 on livability (#60 in UT, #3,813 nationally) — a middle-class / working-renter tenant base. Strengths: commute A+, cost of living A+, amenities A; Watch: crime D+, health & safety D+, employment F.
- Uintah District (town): math 34% / reading 34% proficiency, ranked #60 of 80 in UT (top 75%) — families likely to look elsewhere, expect single-tenant / working-renter base with shorter leases.
- Zoned schools: Naples School (math 39% / reading 36%, grade F, #352 of 585 statewide, top 60%, 502 students, 56% FRL); Uintah Middle School (math 37% / reading 42%, grade F, #75 of 138 statewide, top 56%, 669 students, 40% FRL); Uintah High (math 18% / reading 36%, grade F, #131 of 171 statewide, top 79%, 1,808 students, 31% FRL).
- Market conditions: Rents rising fast (+4.1%/yr); 276 active listings in the ZIP; solid renter incomes; 85 units permitted in Uintah County in 2024 (0 in 5+ unit buildings).
Forward outlook
- Local home prices are declining (-3.0%/yr); year-one equity from $1k of loan paydown is wiped out by about $5k of value loss. Plan a longer hold.
- Uintah County population projected at +72% by 2050 — long-run rental-demand tailwind backs the buy-and-hold thesis.
Negotiation context
- It's been on market 23 days — a 2% lower offer ($162k) is reasonable based on typical stale-listing flexibility.
- 2 sale attempts with the ask held roughly flat each time — persistent listings suggest the price (not the market) is what's stuck; bring a comps-based counter.
Risks & watch-outs
- Climate carrying-cost: moderate wildfire risk — expect insurance premiums to compound above CPI over the hold.
Questions for the listing agent
- Is there a deadline driving the sale (1031 exchange, divorce, estate, relocation)? That informs how much negotiation room exists.
- Schools are D-rated, which usually means shorter tenancies and higher turnover. Who's the typical renter profile here, and what's been the actual vacancy rate?
- Crime grade is D in this area — have there been break-ins, vandalism, or insurance claims at this property in the last 3 years? What carrier currently insures it and at what premium?
- The area grade is low — what's the realistic commute time and amenity access for the typical tenant pool here? Any planned neighborhood developments (good or bad) we should know about?
- What's the average days-on-market for RENTAL listings here right now (not sales)? A rising rental-DOM trend means longer vacancies and softer asking-rent achievability than the comps imply.
- What's the recent tenant-quality profile in this submarket — average credit score on applications, eviction rate, late-payment / NSF rate, and stable-employment percentage? A property-management company in the area should have these aggregated.
- How much new for-sale + rental construction is in the pipeline within 1–3 miles? Heavy new supply typically softens prices + rents 12–24 months out; constrained supply supports both.
Investment metrics
- 1% rule
- 0.97% ✗
- Cap rate
- 7.24%
- Cash-on-cash
- 3.37%
- DSCR
- 1.15
- GRM
- 8.6
CMA / ARV
No comps found within radius.
Projected returns pro-forma
-3.0% appreciation · 4.07% rent growth · sell at horizon
- IRR
- -9.8%
- Equity multiple
- 0.64×
- Total profit
- $-16,681
- Equity at exit
- $24,587
- IRR
- 1.0%
- Equity multiple
- 1.08×
- Total profit
- $3,551
- Equity at exit
- $14,258
Cash invested: $46,172 (down + closing). Projections, not guarantees.
Landlord ↔ Tenant lean methodology
- Overall (STATE)
- 86 Strongly Landlord-Friendly
- State Utah
- 86 Strongly Landlord-Friendly · R+15
- County
- — inherits STATE
- City
- — inherits STATE
ZIP-level market 84078
- Rents YoY
- 4.1%
- Active inventory
- 276
- Price-to-rent
- 8.6×
Monthly cashflow live
- Estimated rent
- $1,607 medium interval (Pro) →
- Mortgage (P&I)
- −$865
- Tax est. 1.5%
- −$206 /mo · $2,474/yr
- Insurance
- −$69
- HOA
- −$0
- Vacancy / Maint / Mgmt
- −$337
- Net cashflow
- $130
Break-even live
UW: 25.0% down · 7.5% · 30yr · 1.5% tax · 5.0% vac · 8.0% maint · 8.0% mgmt
Financing live
Cash to close
- Down payment
- $41,225
- Closing costs
- $4,947
- Reserves months
- —
- Total cash needed
- —
Loan-product check · same deal, 3 products live
Conventional
25% down · 7.5% · 30yr
- Down + closing
- —
- Monthly P&I
- —
- Monthly cashflow
- —
- DSCR
- —
- Eligible?
- —
Personal DTI + credit; lowest rate.
DSCR
20% down · 8.5% · 30yr
- Down + closing
- —
- Monthly P&I
- —
- Monthly cashflow
- —
- DSCR
- —
- Eligible?
- —
No personal income docs; deal must DSCR.
Hard money
10% down · 12.0% · 12mo
- Down + closing
- —
- Monthly P&I
- —
- Monthly cashflow
- —
- DSCR
- —
- Eligible?
- —
Short-term bridge; refi at stabilization.
Listing history 17 events
-
2026-06-19days on market $164,900 Active 23 DOM
-
2026-06-18days on market $164,900 Active 22 DOM
-
2026-06-17days on market $164,900 Active 21 DOM
-
2026-06-16days on market $164,900 Active 20 DOM
-
2026-06-15days on market $164,900 Active 19 DOM
-
2026-06-14days on market $164,900 Active 17 DOM
-
2026-06-12days on market $164,900 Active 16 DOM
-
2026-06-09days on market $164,900 Active 13 DOM
-
2026-06-08days on market $164,900 Active 12 DOM
-
2026-06-07days on market $164,900 Active 11 DOM
-
2026-06-02days on market $164,900 Active 6 DOM
-
2026-06-01days on market $164,900 Active 5 DOM
-
2026-05-31days on market $164,900 Active 4 DOM
-
2026-05-30days on market $164,900 Active 3 DOM
-
2026-05-27$164,900 Active
-
2026-05-19historical
-
2026-04-11$169,000 Active
ⓘ Source: listings_history table (triggers on properties + properties_extension) + one-shot
backfill from property_details.listing_events for pre-trigger history.
Climate risk First Street
- Flood 1/10 Low FEMA zone X (unshaded) · 0% chance over 30 yrs
- Wildfire 5/10 Major
- Heat 3/10 Moderate 7 d/yr ≥93°F today · 21 d/yr by 30 yrs out
- Wind 1/10 Low
- Air quality 3/10 Moderate 3 unhealthy d/yr today · 3 by 30 yrs out
Nearby sold comps map
Loading sold comps map…
Walkable amenities ~0.75 mi
Loading nearby amenities…
Taxation est. · year 1
- Rental income
- $19,282
- − Mortgage interest
- −$9,237
- − Property taxes
- −$2,474
- − Insurance
- −$824
- − Repairs & maintenance
- −$1,543
- − Management
- −$1,543
- − Depreciation
- −$4,797
- Taxable loss
- −$1,135
- Est. tax savings @ 24.0%
- +$272
- After-tax cash flow
- $1,830/yr
For passive investors: Depreciation is non-cash, so a rental often shows a tax loss while cash-flowing — sheltering income. Rental losses are passive: they offset passive income freely, and up to $25,000/yr can offset ordinary (W-2) income if you actively participate and your MAGI is under $100k (phasing out to $0 by $150k); unused losses carry forward. On sale, claimed depreciation is recaptured at up to 25%, and gains may owe capital-gains tax (a 1031 exchange can defer both). Figures are a year-1 estimate at your 24.0% rate — not tax advice; consult a CPA.
Condition & rehab AI · 1 photo
This move-in-ready, brand-new double-wide home in East Meadows Mobile Home Park is in excellent condition with no visible repairs or maintenance needed. It offers ample storage, modern living, and affordable monthly lot rent. Potential buyers and renters will appreciate the home's curb appeal and energy-efficient features.
Value-add opportunities
- Both Painting the exterior and interior walls — Fresh paint can enhance the curb appeal and interior aesthetics, making the home more attractive to potential buyers and renters.
- Both Landscaping improvements — A well-maintained yard can increase the home's curb appeal and make it more attractive to potential buyers and renters.
- Both Upgrading the HVAC system — A newer, more efficient HVAC system can improve comfort and energy efficiency, making the home more attractive to potential buyers and renters.
- Both Adding a small patio or deck — An outdoor living space can increase the home's appeal and functionality, making it more attractive to potential buyers and renters.
- Both Upgrading the kitchen appliances — Modern, energy-efficient appliances can improve the home's functionality and make it more attractive to potential buyers and renters.
- Both Upgrading the bathrooms with modern fixtures — Modern, energy-efficient fixtures can improve the home's functionality and make it more attractive to potential buyers and renters.
Renovation cost estimate screening
Value-add ROI direction
- Both Painting the exterior and interior walls — Fresh paint can enhance the curb appeal and interior aesthetics, making the home more attractive to potential buyers and renters. ↑
- Both Landscaping improvements — A well-maintained yard can increase the home's curb appeal and make it more attractive to potential buyers and renters. ↑
- Both Upgrading the HVAC system — A newer, more efficient HVAC system can improve comfort and energy efficiency, making the home more attractive to potential buyers and renters. ↑
- Both Adding a small patio or deck — An outdoor living space can increase the home's appeal and functionality, making it more attractive to potential buyers and renters. ↑
- Both Upgrading the kitchen appliances — Modern, energy-efficient appliances can improve the home's functionality and make it more attractive to potential buyers and renters. ↑
- Both Upgrading the bathrooms with modern fixtures — Modern, energy-efficient fixtures can improve the home's functionality and make it more attractive to potential buyers and renters. ↑
ⓘ Cost ranges are severity-bucket heuristics (US national rule-of-thumb). Get contractor quotes + a written scope before underwriting a rehab budget.
Schools (NCES district)
- District
- Uintah District
- NCES district ID
- 4901080
- Math proficiency
- 34% ▼ -4.00%
- Reading proficiency
- 34% ▼ -4.00%
- Median HH income
- $62,125
- Composite
- 30.69/100
- National rank
- #6177
- State rank
- #60 of 80 in UT
Livability — Vernal
- Score
- 75/100
- State rank
- #60
- US rank
- #3813
Category grades
Schools grade is shown separately in the Schools card above.
Census & demographics
- Census place
- Vernal, UT
- County
- Uintah County · 30,975 people
- City population
- 30,975
- Metro
- Vernal, UT
- Population (ZIP)
- 30,975
- Household income
- $75,113
- Rent vs Own
- Severe rent burden
- 223.0
Population outlook (Uintah County) Hauer SSP2
- Today (2025)
- 49,582 people
- By 2030
- 56,006 · +13.0%
- By 2040
- 70,034 · +41.2%
- By 2050
- 85,323 · +72.1%
- By 2075
- 124,396 · +150.9%
- By 2100
- 154,630 · +211.9%
Race, ethnicity, and origin ACS 2023
- Neighborhood character
- Predominantly White (83%)
- Race & ethnicity
- White 83% Hispanic / Latino 8% Two or more races 8% Native American 3%
- Hispanic origin (detail)
- Mexican 7%
- Common ancestry
- Italian 6% Slovak 3% Portuguese 1%
- Foreign-born
- 2% · Canada
- Languages at home
- 96% English-only · Spanish 3% Other Asian/Pacific 1%
Political lean MEDSL · Uintah
- 2024 margin
- Solid R (+73.6) · D 12.3% · R 85.9% · Other 1.8%
- 2008→2024 swing
- -4.8pp toward R · 2008: -68.8pp · 2024: -73.6pp
- All cycles
- 2024: R+73.6 2020: R+75.8 2016: R+68.9 2012: R+81.3 2008: R+68.8
Not yet ingested
- Civics
- —
Market trends
- HPI YoY
- ▼ -304.65%
- Current HPI
- 197.5429
- Rent YoY
- ▲ 4.07%
- Metro
- Vernal, UT
- State GDP YoY
- ▲ 3.54%
- F500 in state
- 2
Industry mix (Fortune 500 HQ in UT)
| Industry | F500 HQs | Revenue |
|---|---|---|
| Financial Services | 1 | $3B |
|
||
Price history
-2.4% since first listed3 events — show timeline
- 2026-05-27 Listed $164,900 WFRMLS
- 2026-05-19 Listing Removed — WFRMLS
- 2026-04-11 Listed $169,000 WFRMLS
Cash-flow waterfall
monthlySold comps — $/sqft
last 12 mo · ≤1 miLoading sold comps…