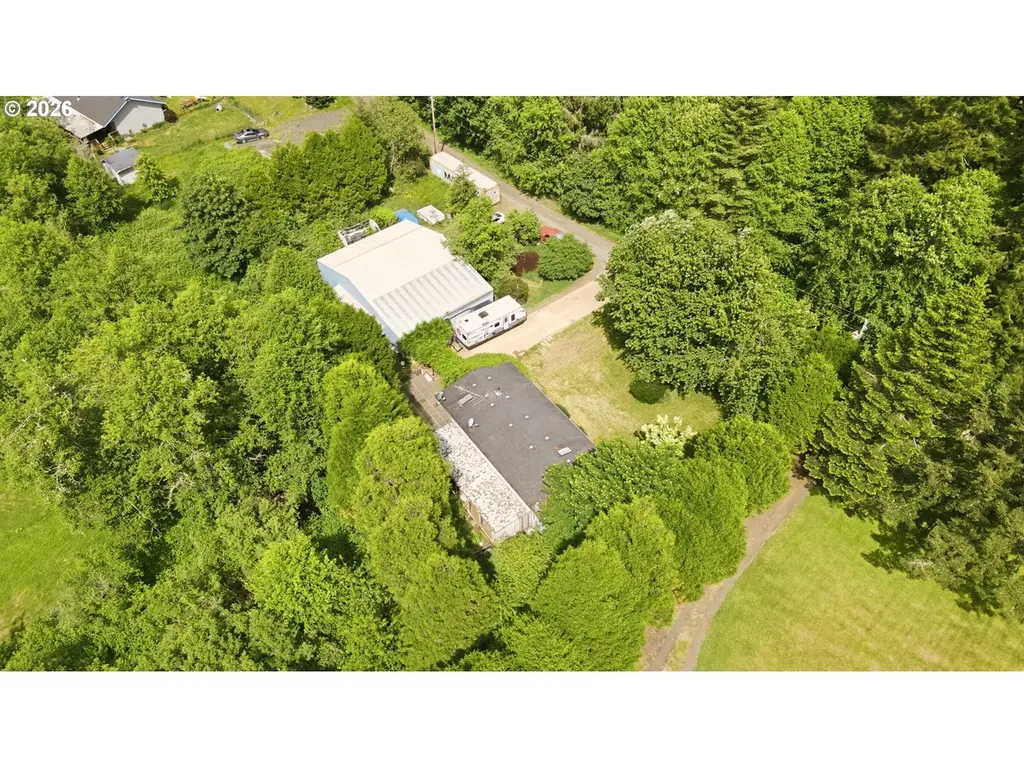
82520 Vinemaple Rd · Seaside, OR
Flood risk 3/10 · Minor
- FEMA flood zone
- AE
- Chance of flooding over 30 yrs
- 0.18%
- Est. flood insurance / yr
- $2,026 – $9,024
Fire risk 1/10 · Minimal
- Est. fire insurance / yr
- $498 – $926
Heat risk 1/10 · Minimal
- Hot days now (above 86°F)
- 7 days/yr
- Hot days in 30 yrs
- 14 days/yr
Wind risk 1/10 · Minimal
- Chance of severe wind over 30 yrs
- —
Air-quality risk 6/10 · Moderate
- Unhealthy air days now
- 8 days/yr
- Unhealthy air days in 30 yrs
- 8 days/yr
Risk factors via First Street. Map © Google.
Why this score? — see what drove the C- grade
The composite is a weighted blend of 9 inputs, each scored 0–100. Each bar is that input's sub-score; the figure is the points it added to the 100-point composite (weight × sub-score).
- ARV discount +15.0/15.0
- Appreciation +10.0/10.0
- Cash flow +9.8/30.0
- Livability +4.0/5.0
- DSCR +2.8/10.0
- Schools +2.8/10.0
- Rent growth +2.5/5.0
- Condition / age +2.5/5.0
- 1% rule +2.0/10.0
$279,900
🖨 Deal sheet 📄 Offer letter ✓ Due diligence
Listing remarks MLS
Skillfully maintained single level,huge deck overlooks sloping green lawns, cheerful brook. Honor your RVs, hobbies, dreams inside 54x40 pole barn, concrete floor,bathrm, 4+ indoor parking. 2 carports! Irrigated garden space. Quiet street, good schools, near hiking, lakes. 35 mins ocean beaches, crabs, clams. Bakers General Store (gas), Elderberry Inn, Camp 18, Oneys nearby.
Key facts
- 1 acre property
- Mature landscaping
- Open lawn areas
Tags
Property features AI
Finance
- Other: Zoned RA-1; Lot approximately 1 acre (approx. 200 x 239); Waterfront: creek (Cow Creek)
Exterior
- Parking: Off-street parking with RV access/parking; Three total parking spaces; Detached oversized carport (3-car)
- Security: Security lights
- Utilities: Shared well water; Septic tank sewer; Electric service
- Home design: Single-family residence (residential); View of creek and woods; Property listed in fixer condition; Main living area on one level
- Construction: Built in 1992; Composition and metal roof; Block foundation with skirting
- Exterior features: Covered deck; Garden and greenhouse; Workshop; Security lights; Sprinkler system; Yard; Creek on the property (Cow Creek); Level lot with trees; Paved road access; T-111 siding
Interior
- Kitchen: Dishwasher; Free-standing range; Free-standing refrigerator; Pantry
- Bedrooms: Primary bedroom on main level with vaulted ceiling and attached bathroom; Second bedroom on main level with walk-in closet; Third bedroom on main level
- Bathrooms: Two full bathrooms (both on the main level)
- Heating & cooling: Forced-air heating; Heat pump cooling
- Interior features: One-level living with walk-in shower; Soaking tub; Laundry area; Washer and dryer included; Double-pane windows with vinyl frames; Crawl space foundation
- Laundry & utility: Main-level utility room; Washer/Dryer included; Hot water provided by electricity
Neighborhood map
What this means for you Summary
Snapshot
- This is a 2-bed/2.0-bath single-family listed at $280k.
Deal economics
- At list price, monthly cash flow is $-639 ($-8k/yr) — negative.
- To cash-flow at today's rent, offer at most $167k (40.3% below list).
- To meet the 1% rule (rent ≥ 1% of price), the offer needs to be $196k (29.9% below list).
- Recommended offer: $167k (40.3% below list) — sets the bar for cash-flow.
- Cap rate 5.5% vs local median 2.5% in Seaside — top-decile yield for the area; either an underpriced asset or a hidden risk that comps aren't pricing in. Stress-test before assuming the spread holds.
Location & tenants
- Location reads 79/100 on livability (#60 in OR, #2,085 nationally) — a middle-class / working-renter tenant base. Strengths: amenities A+, commute A+, health & safety A+; Watch: employment C-, crime D+, cost of living D+.
- Jewell SD 8 (rural): math 20% / reading 40% proficiency, ranked #158 of 183 in OR (top 86%) — families likely to look elsewhere, expect single-tenant / working-renter base with shorter leases.
- Market conditions: 226 active listings in the ZIP; 98 units permitted in Clatsop County in 2024 (0 in 5+ unit buildings).
- This rent runs 39% of the median local income ($60k/yr) — at the standard rent-burdened threshold; future hikes will face affordability resistance.
Forward outlook
- In year one you build about $30k of equity ($2k loan paydown + $28k appreciation (10.0% local appreciation)).
- By year 2, paydown + projected appreciation supports a ~$48k cash-out refi (75% LTV) — recoverable capital for the next deal without selling this one.
Negotiation context
- Only 14 days on market — expect competitive offers; lowballing is unlikely to land.
- 3 sale attempts since 24y ago with the ask held roughly flat each time — persistent listings suggest the price (not the market) is what's stuck; bring a comps-based counter.
- Current owner paid $147k; list at $280k implies a 90% gain — meaningful room to come down on a strong offer.
Risks & watch-outs
- Watch-outs: flood insurance adds $460/mo.
- Climate carrying-cost: in FEMA flood zone AE (mandatory federal flood insurance) — expect insurance premiums to compound above CPI over the hold.
Questions for the listing agent
- What do current leases actually rent for vs. the listed asking? Can we see a recent rent roll and the last 12 months of T-12 income?
- What's the actual annual flood-insurance premium (NFIP or private), and is the property in a SFHA with mandatory coverage?
- Is there a deadline driving the sale (1031 exchange, divorce, estate, relocation)? That informs how much negotiation room exists.
- Schools are D-rated, which usually means shorter tenancies and higher turnover. Who's the typical renter profile here, and what's been the actual vacancy rate?
- Crime grade is D in this area — have there been break-ins, vandalism, or insurance claims at this property in the last 3 years? What carrier currently insures it and at what premium?
- What's the average days-on-market for RENTAL listings here right now (not sales)? A rising rental-DOM trend means longer vacancies and softer asking-rent achievability than the comps imply.
- What's the recent tenant-quality profile in this submarket — average credit score on applications, eviction rate, late-payment / NSF rate, and stable-employment percentage? A property-management company in the area should have these aggregated.
- How much new for-sale + rental construction is in the pipeline within 1–3 miles? Heavy new supply typically softens prices + rents 12–24 months out; constrained supply supports both.
Investment metrics
- 1% rule
- 0.70% ✗
- Cap rate
- 5.53%
- Cash-on-cash
- -2.73%
- DSCR
- 0.88
- GRM
- 11.9
CMA / ARV
- ARV (on-the-fly)
- $456,750
- Comps found
- 1
Show comp detail 1 sale within ~0.75 mi
| Address | Dist | Beds/Ba | Sqft | Sold | Price | $/sf | Match |
|---|---|---|---|---|---|---|---|
| 82403 Vinemaple Rd | 0.20mi | 3/1.0 (+1) | 1,428 (-2%) | 22mo | $450,000 | $315 | 60 |
Match score weights: distance 35% · size 25% · config 20% · recency 20%. Top-matched comps best support the ARV.
Projected returns pro-forma
10.0% appreciation · 3.0% rent growth · sell at horizon
- IRR
- 17.4%
- Equity multiple
- 2.43×
- Total profit
- $111,947
- Equity at exit
- $252,156
- IRR
- 16.5%
- Equity multiple
- 5.62×
- Total profit
- $362,026
- Equity at exit
- $543,784
Cash invested: $78,372 (down + closing). Projections, not guarantees.
Landlord ↔ Tenant lean methodology
- Overall (STATE)
- 28 Tenant-Leaning
- State Oregon
- 28 Tenant-Leaning · D+6
- County
- — inherits STATE
- City
- — inherits STATE
ZIP-level market 97138
- Home prices YoY
- 2.6%
- Active inventory
- 226
- Price-to-rent
- 11.9×
Monthly cashflow live
- Estimated rent
- $1,962 medium interval (Pro) →
- Mortgage (P&I)
- −$1,468
- Tax from tax record
- −$144 /mo · $1,728/yr
- Insurance
- −$117
- Flood insurance flood zone
- −$460 /mo · $5,525/yr
- HOA
- −$0
- Vacancy / Maint / Mgmt
- −$412
- Net cashflow
- $-639
Break-even live
UW: 25.0% down · 7.5% · 30yr · 1.5% tax · 5.0% vac · 8.0% maint · 8.0% mgmt
Financing live
Cash to close
- Down payment
- $69,975
- Closing costs
- $8,397
- Reserves months
- —
- Total cash needed
- —
Loan-product check · same deal, 3 products live
Conventional
25% down · 7.5% · 30yr
- Down + closing
- —
- Monthly P&I
- —
- Monthly cashflow
- —
- DSCR
- —
- Eligible?
- —
Personal DTI + credit; lowest rate.
DSCR
20% down · 8.5% · 30yr
- Down + closing
- —
- Monthly P&I
- —
- Monthly cashflow
- —
- DSCR
- —
- Eligible?
- —
No personal income docs; deal must DSCR.
Hard money
10% down · 12.0% · 12mo
- Down + closing
- —
- Monthly P&I
- —
- Monthly cashflow
- —
- DSCR
- —
- Eligible?
- —
Short-term bridge; refi at stabilization.
Listing history 11 events
-
2026-06-19days on market $279,900 Active 14 DOM
-
2026-06-18days on market $279,900 Active 13 DOM
-
2026-06-17days on market $279,900 Active 12 DOM
-
2026-06-16days on market $279,900 Active 11 DOM
-
2026-06-15days on market $279,900 Active 10 DOM
-
2026-06-14days on market $279,900 Active 8 DOM
-
2026-06-12days on market $279,900 Active 7 DOM
-
2026-06-09days on market $279,900 Active 4 DOM
-
2026-06-08days on market $279,900 Active 3 DOM
-
2026-06-07remarks 693-char remark
-
2026-06-07$279,900 Active 2 DOM
ⓘ Source: listings_history table (triggers on properties + properties_extension) + one-shot
backfill from property_details.listing_events for pre-trigger history.
Tax reassessment forecast OR · Resets to sale price
- Current annual tax
- $1,728 · $144/mo
- Projected year-2 tax
- $2,715 · $226/mo
- Expected delta
- +$987/yr (+$82/mo · 57.1%)
ⓘ Screening estimate from a state-policy table — verify with the county assessor before closing.
Climate risk First Street
- Flood 3/10 Moderate FEMA zone AE · 18% chance over 30 yrs
- Wildfire 1/10 Low
- Heat 1/10 Low 7 d/yr ≥86°F today · 14 d/yr by 30 yrs out
- Wind 1/10 Low
- Air quality 6/10 Major 8 unhealthy d/yr today · 8 by 30 yrs out
Nearby sold comps map
Loading sold comps map…
Walkable amenities ~0.75 mi
Loading nearby amenities…
Taxation est. · year 1
- Rental income
- $23,547
- − Mortgage interest
- −$15,679
- − Property taxes
- −$1,728
- − Insurance
- −$6,925
- − Repairs & maintenance
- −$1,884
- − Management
- −$1,884
- − Depreciation
- −$8,143
- Taxable loss
- −$12,695
- Est. tax savings @ 24.0%
- +$3,047
- After-tax cash flow
- $-4,618/yr
For passive investors: Depreciation is non-cash, so a rental often shows a tax loss while cash-flowing — sheltering income. Rental losses are passive: they offset passive income freely, and up to $25,000/yr can offset ordinary (W-2) income if you actively participate and your MAGI is under $100k (phasing out to $0 by $150k); unused losses carry forward. On sale, claimed depreciation is recaptured at up to 25%, and gains may owe capital-gains tax (a 1031 exchange can defer both). Figures are a year-1 estimate at your 24.0% rate — not tax advice; consult a CPA.
Schools (NCES district)
- District
- Jewell SD 8
- NCES district ID
- 4106750
- Math proficiency
- 20% ▼ -5.00%
- Reading proficiency
- 40% ▼ -5.00%
- Median HH income
- $42,626
- Composite
- 28.3/100
- National rank
- #12151
- State rank
- #158 of 183 in OR
Livability — Seaside
- Score
- 79/100
- State rank
- #60
- US rank
- #2085
Category grades
Schools grade is shown separately in the Schools card above.
Census & demographics
- County
- Clatsop County · 29,028 people
- Metro
- Astoria, OR
- Population (ZIP)
- 11,035
- Household income
- $60,411
- Rent vs Own
- Severe rent burden
- 573.0
Population outlook (Clatsop County) Hauer SSP2
- Today (2025)
- 39,212 people
- By 2030
- 39,765 · +1.4%
- By 2040
- 40,121 · +2.3%
- By 2050
- 40,032 · +2.1%
- By 2075
- 39,123 · -0.2%
- By 2100
- 35,965 · -8.3%
Race, ethnicity, and origin ACS 2023
- Neighborhood character
- Predominantly White (89%)
- Race & ethnicity
- White 89% Hispanic / Latino 7% Two or more races 5% Black 1% Asian 1%
- Hispanic origin (detail)
- Mexican 4% Puerto Rican 1%
- Common ancestry
- Lithuanian 5% Portuguese 3% Scottish 3%
- Foreign-born
- 3% · Canada, China
- Languages at home
- 95% English-only · Spanish 3% German/W. Germanic 1%
Political lean MEDSL · Clatsop
- 2024 margin
- D (+11.4) · D 54.1% · R 42.8% · Other 3.1%
- 2008→2024 swing
- -7.6pp toward R · 2008: 18.9pp · 2024: 11.4pp
- All cycles
- 2024: D+11.4 2020: D+11.3 2016: D+6.1 2012: D+14.6 2008: D+18.9
Not yet ingested
- Civics
- —
Market trends
- HPI YoY
- ▲ 26.11%
- Current HPI
- 1014.65
- Rent YoY
- —
- Metro
- Astoria, OR
- State GDP YoY
- ▲ 2.05%
- F500 in state
- 2
Industry mix (Fortune 500 HQ in OR)
| Industry | F500 HQs | Revenue |
|---|---|---|
| Consumer Goods | 1 | $51B |
|
||
Price history
+79.5% since first listed6 events — show timeline
- 2026-06-05 Listed $279,900 RMLS
- 2014-12-22 Sold (MLS) $147,000 RMLS
- 2014-12-19 Sold (Public Records) $146,500 Public Records
- 2013-05-10 Listed $157,500 RMLS
- 2003-03-24 Sold (MLS) $155,900 RMLS
- 2002-04-15 Listed $155,900 RMLS
Property tax history
+4.8%/yrLatest (2025): $1,728 · +0.4% YoY. Source: county tax records.
Cash-flow waterfall
monthlySold comps — $/sqft
last 12 mo · ≤1 miLoading sold comps…