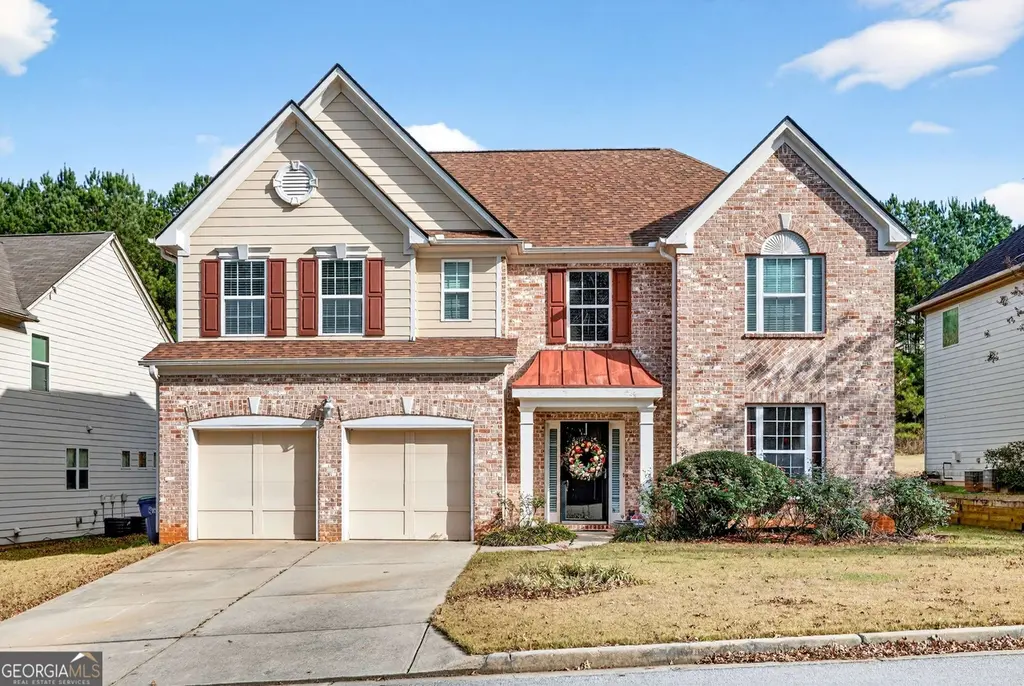
5625 Jamerson Dr · South Fulton, GA
Flood risk 1/10 · Minimal
- FEMA flood zone
- X (unshaded)
- Chance of flooding over 30 yrs
- 0.0%
- Est. flood insurance / yr
- $507 – $1,088
Fire risk 3/10 · Minor
- Est. fire insurance / yr
- $963 – $1,789
Heat risk 6/10 · Moderate
- Hot days now (above 103°F)
- 7 days/yr
- Hot days in 30 yrs
- 18 days/yr
Wind risk 5/10 · Moderate
- Chance of severe wind over 30 yrs
- 26.0%
Air-quality risk 3/10 · Minor
- Unhealthy air days now
- 3 days/yr
- Unhealthy air days in 30 yrs
- 4 days/yr
Risk factors via First Street. Map © Google.
Why this score? — see what drove the D+ grade
The composite is a weighted blend of 9 inputs, each scored 0–100. Each bar is that input's sub-score; the figure is the points it added to the 100-point composite (weight × sub-score).
- ARV discount +13.9/15.0
- Appreciation +10.0/10.0
- Cash flow +8.3/30.0
- Schools +4.5/10.0
- Rent growth +2.7/5.0
- Livability +2.5/5.0
- Condition / age +2.5/5.0
- DSCR +2.2/10.0
- 1% rule +2.1/10.0
$375,000
🖨 Deal sheet (PDF) 📄 Offer letter ✓ Due diligence
Listing remarks
Searching for a 4-bed single-family home in Atlanta that fits the pace of a growing household? 5625 Jamerson Drive offers nearly 3,000 square feet of flexible living space, a new roof, in a location that blends everyday convenience with recreation, culture, and outdoor lifestyle amenities. This 4-bedroom, 2.5-bath home offers approximately 2,912 square feet of thoughtfully designed living space with the flexibility today's households need. The spacious layout makes it easy to create room for gathering, work-from-home needs, study zones, play areas, and quiet downtime. The eat-in kitchen serves as the natural heart of the home, perfect for busy weekday mornings, casual meals, and staying con
Key facts
- 0.23 acre lot
- Garage
- Community pool
Property features AI
Finance
- Other: Road frontage on a city street with asphalt surface; Directions: Use GPS
- HOA & community: Homeowners association with an annual fee of $700; HOA includes access to pool and tennis; Community amenities include clubhouse, playground, sidewalks, street lights, and tennis courts
Exterior
- Parking: Garage with garage door opener and garage facing front
- Utilities: Public water; Public sewer; 110-volt electric; Cable available; Natural gas available; Phone service available
- Home design: Two-story single-family home; Fee simple ownership; Resale property; Brick front with cement siding; Composition roof; Slab foundation
- Construction: Brick front and cement siding construction; Composition roof; Slab foundation
- Exterior features: Patio; Rain gutters
Interior
- Kitchen: Eat-in kitchen with island; Stained cabinets; Pantry; Open view to family room; Dishwasher; Gas oven; Microwave; Range hood; Refrigerator
- Bedrooms: Oversized primary bedroom; Four bedrooms on the upper level
- Flooring: Carpet; Laminate
- Bathrooms: Two full bathrooms; One half bathroom; Primary bathroom with double vanity, separate tub and shower, and whirlpool tub
- Heating & cooling: Central heating (natural gas); Central air conditioning
- Interior features: Entrance foyer with two-story entry; High ceilings throughout (including 9 ft. ceilings on lower, main and upper levels); Tray ceiling(s); High-speed internet available; Low-flow plumbing fixtures; Walk-in closet(s); One factory-built fireplace with gas starter; Double vanity in bathrooms
- Laundry & utility: Laundry room located in hall on the main level; Gas water heater
Neighborhood map
What this means for you Summary
Snapshot
- This is a 4-bed/2.5-bath single-family listed at $375k.
Deal economics
- At list price, monthly cash flow is $-345 ($-4k/yr) — negative.
- To cash-flow at today's rent, offer at most $314k (16.2% below list).
- To meet the 1% rule (rent ≥ 1% of price), the offer needs to be $267k (28.8% below list).
- Recommended offer: $267k (28.8% below list) — sets the bar for 1% rule.
Location & tenants
- Location reads: area grade D — affects rentability + tenant quality, not the cash-flow math above.
- Fulton County (suburban): math 49% / reading 53% proficiency, ranked #12 of 174 in GA (top 7%) — acceptable for families but not a draw, mixed tenant base, ~2y average lease.
- Zoned schools: Amana Academy School (math 47% / reading 52%, grade D, #264 of 1,228 statewide, top 23%, 731 students, 30% FRL, charter); Sandtown Middle School (math 24% / reading 35%, grade F, #249 of 470 statewide, top 55%, 1,057 students, 57% FRL); Westlake High School (math 27% / reading 5%, grade F, #287 of 424 statewide, top 68%, 2,461 students, 43% FRL) — zoned schools at 43% FRL track the district average.
- Zoned-school proficiency averages 32% at this address vs 51% district-wide (-19 pts) — the specific schools serving this property underperform the Fulton County average; the district grade overstates school quality for this exact location.
- Market conditions: Rents flat; 655 active listings in the ZIP; 5 comparable units currently listed for rent nearby; rentals leasing fast (median 7d on market — plan ~1-2 weeks tenant-placement turnaround); 11,565 units permitted in Fulton County in 2024 (8,159 in 5+ unit buildings).
- At $2,669/mo this rent would consume 48% of the median local household income ($67k/yr) (locally 4258% of renters already pay >50% of income on rent) — very limited rent-growth headroom before tenants either downsize or default.
Forward outlook
- In year one you build about $40k of equity ($3k loan paydown + $38k appreciation (10.0% local appreciation)).
- Fulton County population projected at +38% by 2050 — long-run rental-demand tailwind backs the buy-and-hold thesis.
- By year 2, paydown + projected appreciation supports a ~$64k cash-out refi (75% LTV) — recoverable capital for the next deal without selling this one.
Negotiation context
- It's been on market 21 days — a 2% lower offer ($369k) is reasonable based on typical stale-listing flexibility.
- 8 sale attempts since 7y ago with the ask held roughly flat each time — persistent listings suggest the price (not the market) is what's stuck; bring a comps-based counter.
- Current owner paid $240k; list at $375k implies a 56% gain — meaningful room to come down on a strong offer.
Risks & watch-outs
- Climate carrying-cost: moderate wind risk, 26% chance of damaging wind over 30y; extreme-heat days projected 7→18/yr by 2055 (HVAC capex compounding) — expect insurance premiums to compound above CPI over the hold.
Questions for the listing agent
- What do current leases actually rent for vs. the listed asking? Can we see a recent rent roll and the last 12 months of T-12 income?
- What does the HOA fee cover, when was the last increase, and are there any pending special assessments or reserve-fund shortfalls?
- Is there a deadline driving the sale (1031 exchange, divorce, estate, relocation)? That informs how much negotiation room exists.
- The area grade is low — what's the realistic commute time and amenity access for the typical tenant pool here? Any planned neighborhood developments (good or bad) we should know about?
- What's the average days-on-market for RENTAL listings here right now (not sales)? A rising rental-DOM trend means longer vacancies and softer asking-rent achievability than the comps imply.
- What's the recent tenant-quality profile in this submarket — average credit score on applications, eviction rate, late-payment / NSF rate, and stable-employment percentage? A property-management company in the area should have these aggregated.
- How much new for-sale + rental construction is in the pipeline within 1–3 miles? Heavy new supply typically softens prices + rents 12–24 months out; constrained supply supports both.
Investment metrics
- 1% rule
- 0.71% ✗
- Cap rate
- 5.19%
- Cash-on-cash
- -3.94%
- DSCR
- 0.82
- GRM
- 11.7
CMA / ARV
- ARV (on-the-fly)
- $436,800
- Comps found
- 12
Show comp detail 12 sales within ~0.75 mi
| Address | Dist | Beds/Ba | Sqft | Sold | Price | $/sf | Match |
|---|---|---|---|---|---|---|---|
| 4286 Rosehall Ct | 0.20mi | 5/3.0 (+1) | 3,052 (+5%) | 3mo | $425,000 | $139 | 74 |
| 4435 Bellwood Cir | 0.20mi | 4/2.5 | 3,133 (+8%) | 12mo | $427,000 | $136 | 68 |
| 5587 Rosehall Pl #177 | 0.45mi | 5/3.0 (+1) | 3,021 (+4%) | 9mo | $432,390 | $143 | 58 |
| 5587 Rosehall Pl | 0.45mi | 5/3.0 (+1) | 3,021 (+4%) | 9mo | $432,390 | $143 | 58 |
| 4081 Trimrose Ct | 0.60mi | 5/3.0 (+1) | 2,987 (+3%) | 6mo | $470,500 | $158 | 56 |
| 5571 Rosehall Pl | 0.51mi | 5/3.0 (+1) | 3,021 (+4%) | 16mo | $477,914 | $158 | 50 |
| 5531 Rosehall Pl #169 | 0.60mi | 5/3.0 (+1) | 3,021 (+4%) | 16mo | $410,000 | $136 | 46 |
| 5531 Rosehall Pl | 0.60mi | 5/3.0 (+1) | 3,021 (+4%) | 16mo | $410,000 | $136 | 46 |
| 5603 Rosehall Pl Lot 180 | 0.45mi | 5/3.0 (+1) | 2,570 (-12%) | 9mo | $384,990 | $150 | 45 |
| 5551 Rosehall Pl | 0.56mi | 5/3.0 (+1) | 2,570 (-12%) | 15mo | $405,000 | $158 | 35 |
| 5551 Rosehall Pl #172 | 0.56mi | 5/3.0 (+1) | 2,570 (-12%) | 15mo | $405,000 | $158 | 35 |
| 5547 Rosehall Pl | 0.57mi | 5/3.0 (+1) | 2,570 (-12%) | 15mo | $415,790 | $162 | 34 |
Match score weights: distance 35% · size 25% · config 20% · recency 20%. Top-matched comps best support the ARV.
Projected returns pro-forma
10.0% appreciation · 0.95% rent growth · sell at horizon
- IRR
- 20.9%
- Equity multiple
- 2.68×
- Total profit
- $176,840
- Equity at exit
- $337,830
- IRR
- 18.6%
- Equity multiple
- 6.03×
- Total profit
- $527,887
- Equity at exit
- $728,543
Cash invested: $105,000 (down + closing). Projections, not guarantees.
Landlord ↔ Tenant lean methodology
- Overall (STATE)
- 90 Strongly Landlord-Friendly
- State Georgia
- 90 Strongly Landlord-Friendly · R+3
- County
- — inherits STATE
- City
- — inherits STATE
ZIP-level market 30349
- Home prices YoY
- 4.6%
- Rents YoY
- 0.9%
- Active inventory
- 655
- Price-to-rent
- 11.7×
Monthly cashflow live
- Estimated rent
- $2,669 high interval (Pro) →
- Mortgage (P&I)
- −$1,967
- Tax from tax record
- −$272 /mo · $3,267/yr
- Insurance
- −$156
- HOA
- −$58
- Vacancy / Maint / Mgmt
- −$560
- Net cashflow
- $-345
Break-even live
Sensitivity live
| Price | -10% $-132 | -5% $-239 | +0% $-345 | +5% $-451 | +10% $-557 |
|---|---|---|---|---|---|
| Rent | -10% $-556 | -5% $-450 | +0% $-345 | +5% $-239 | +10% $-134 |
| Rate | -1.0pp $-156 | -0.5pp $-249 | base $-345 | +0.5pp $-442 | +1.0pp $-541 |
UW: 25.0% down · 7.5% · 30yr · 1.5% tax · 5.0% vac · 8.0% maint · 8.0% mgmt
Financing live
Cash to close
- Down payment
- $93,750
- Closing costs
- $11,250
- Reserves months
- —
- Total cash needed
- —
Loan-product check · same deal, 3 products live
Conventional
25% down · 7.5% · 30yr
- Down + closing
- —
- Monthly P&I
- —
- Monthly cashflow
- —
- DSCR
- —
- Eligible?
- —
Personal DTI + credit; lowest rate.
DSCR
20% down · 8.5% · 30yr
- Down + closing
- —
- Monthly P&I
- —
- Monthly cashflow
- —
- DSCR
- —
- Eligible?
- —
No personal income docs; deal must DSCR.
Hard money
10% down · 12.0% · 12mo
- Down + closing
- —
- Monthly P&I
- —
- Monthly cashflow
- —
- DSCR
- —
- Eligible?
- —
Short-term bridge; refi at stabilization.
Rent comps 5 comps
| Address | Beds | Baths | Sqft | Rent | $/sqft | DOM | Units | Dist |
|---|---|---|---|---|---|---|---|---|
| 5539 Rosehall Pl Atlanta, GA | 4.0 | 3.0 | 2706 | $3,000 | $1.11 | 7d | 1 | 0.62mi |
| 385 Yasmine Cv Atlanta, GA | 4.0 | 2.5 | 2120 | $2,495 | $1.18 | 45d | 1 | 0.95mi |
| 5259 Cantbury Way Atlanta, GA | 4.0 | 2.5 | 2578 | $2,445 | $0.95 | 24d | 1 | 1.34mi |
| 5163 Rapahoe Trl Atlanta, GA | 4.0 | 2.5 | 2060 | $2,525 | $1.23 | 0d | 1 | 1.37mi |
| 538 Jadetree Ln Atlanta, GA | 5.0 | 3.0 | 2576 | $2,900 | $1.13 | 3d | 1 | 1.38mi |
HOA detail
- Monthly dues
- $58 · $696/yr
Listing history 50 events
-
2026-06-09days on market $375,000 Active 21 DOM
-
2026-06-08days on market $375,000 Active 20 DOM
-
2026-06-07days on market $375,000 Active 19 DOM
-
2026-06-04days on market $375,000 Active 16 DOM
-
2026-06-03days on market $375,000 Active 15 DOM
-
2026-06-01days on market $375,000 Active 13 DOM
-
2026-05-31days on market $375,000 Active 12 DOM
-
2026-05-19$375,000 Active 1797-char remark
-
2026-05-19$375,000 New 1797-char remark
-
2026-05-18historical $375,000 1797-char remark
-
2026-05-18historical $375,000 1797-char remark
-
2026-05-12historical
-
2026-04-14price $374,900
-
2026-03-29price $379,900
-
2026-01-03price $385,000
-
2025-12-15$395,000 New
-
2025-12-14historical
-
2025-10-31historical
-
2025-10-31historical
-
2025-06-30$399,900 Active
-
2025-06-29price $399,900
-
2025-06-29historical
-
2025-06-12status Back On Market
-
2025-06-11historical
-
2025-06-11historical
-
2025-03-11$400,000 New
-
2025-03-11$400,000 Active
-
2020-01-15soldstatus $239,900
-
2020-01-13soldstatus $239,900 Closed
-
2020-01-13soldstatus $239,900 Sold
-
2019-11-13status Under Contract
-
2019-11-13status Pending
-
2019-11-01price $235,000
-
2019-10-31price $235,000
-
2019-10-18price $239,000
-
2019-10-17price $239,000
-
2019-09-27price $240,000
-
2019-09-27price $240,000
-
2019-09-13price $245,000
-
2019-09-12price $245,000
-
2019-08-30price $249,000
-
2019-08-29price $249,000
-
2019-08-16price $253,000
-
2019-08-15price $253,000
-
2019-08-02price $258,000
-
2019-08-01price $258,000
-
2019-07-19price $261,000
-
2019-07-18price $261,000
-
2019-07-05price $263,000
-
2019-07-04price $263,000
ⓘ Source: listings_history table (triggers on properties + properties_extension) + one-shot
backfill from property_details.listing_events for pre-trigger history.
Tax reassessment forecast GA · Resets to sale price
- Current annual tax
- $3,267 · $272/mo
- Projected year-2 tax
- $3,450 · $288/mo
- Expected delta
- +$183/yr (+$15/mo · 5.6%)
ⓘ Screening estimate from a state-policy table — verify with the county assessor before closing.
Climate risk First Street
- Flood 1/10 Low FEMA zone X (unshaded) · 0% chance over 30 yrs
- Wildfire 3/10 Moderate
- Heat 6/10 Major 7 d/yr ≥103°F today · 18 d/yr by 30 yrs out
- Wind 5/10 Major 26% chance of damaging wind over 30 yrs
- Air quality 3/10 Moderate 3 unhealthy d/yr today · 4 by 30 yrs out
Nearby sold comps map
Loading sold comps map…
Walkable amenities ~0.75 mi
Loading nearby amenities…
Taxation est. · year 1
- Rental income
- $32,025
- − Mortgage interest
- −$21,006
- − Property taxes
- −$3,267
- − Insurance
- −$1,875
- − Repairs & maintenance
- −$2,562
- − Management
- −$2,562
- − HOA
- −$696
- − Depreciation
- −$10,909
- Taxable loss
- −$10,852
- Est. tax savings @ 24.0%
- +$2,604
- After-tax cash flow
- $-1,532/yr
For passive investors: Depreciation is non-cash, so a rental often shows a tax loss while cash-flowing — sheltering income. Rental losses are passive: they offset passive income freely, and up to $25,000/yr can offset ordinary (W-2) income if you actively participate and your MAGI is under $100k (phasing out to $0 by $150k); unused losses carry forward. On sale, claimed depreciation is recaptured at up to 25%, and gains may owe capital-gains tax (a 1031 exchange can defer both). Figures are a year-1 estimate at your 24.0% rate — not tax advice; consult a CPA.
Schools (NCES district)
- District
- Fulton County
- NCES district ID
- 1302280
- Math proficiency
- 49% ▼ -2.00%
- Reading proficiency
- 53% ▬ 0.00%
- Median HH income
- $68,035
- Composite
- 45.33/100
- National rank
- #2640
- State rank
- #12 of 174 in GA
Livability — South Fulton
No livability data for this city. (Only ~50 U.S. cities are tracked.)
Census & demographics
- Census place
- South Fulton, GA
- County
- Fulton County · 1,094,430 people
- City population
- 25,130
- Metro
- Atlanta-Sandy Springs-Alpharetta, GA
- Population (ZIP)
- 79,872
- Household income
- $67,023
- Rent vs Own
- Severe rent burden
- 4258.0
Population outlook (Fulton County) Hauer SSP2
- Today (2025)
- 1,203,707 people
- By 2030
- 1,299,706 · +8.0%
- By 2040
- 1,488,256 · +23.6%
- By 2050
- 1,664,580 · +38.3%
- By 2075
- 2,036,072 · +69.2%
- By 2100
- 2,222,402 · +84.6%
Race, ethnicity, and origin ACS 2023
- Neighborhood character
- Predominantly Black (89%)
- Race & ethnicity
- Black 89% Hispanic / Latino 5% Two or more races 4% White 3%
- Foreign-born
- 9% · Canada
- Languages at home
- 88% English-only · Spanish 6% French/Haitian/Cajun 1%
Political lean MEDSL · Fulton
- 2024 margin
- Solid D (+44.9) · D 71.9% · R 27.0% · Other 1.1%
- 2008→2024 swing
- +9.8pp toward D · 2008: 35.0pp · 2024: 44.9pp
- All cycles
- 2024: D+44.9 2020: D+46.4 2016: D+42.1 2012: D+29.6 2008: D+35.0
Not yet ingested
- Civics
- —
Market trends
- HPI YoY
- ▲ 18.01%
- Current HPI
- 407.99
- Rent YoY
- ▲ 0.95%
- Metro
- Atlanta-Sandy Springs-Alpharetta, GA
- State GDP YoY
- ▲ 2.66%
- F500 in state
- 28
Industry mix (Fortune 500 HQ in GA)
| Industry | F500 HQs | Revenue |
|---|---|---|
| Paper / Packaging | 2 | $29B |
|
||
| Retail | 1 | $160B |
|
||
| Transportation / Logistics | 1 | $91B |
|
||
| Airlines | 1 | $62B |
|
||
| Consumer Goods | 1 | $47B |
|
||
| Utilities | 1 | $25B |
|
||
Price history
+63.0% since first listed45 events — show timeline
- 2026-06-10 Listing Removed — GAMLS
- 2026-05-19 Listed $375,000 GAMLS
- 2026-05-18 Coming Soon — GAMLS
- 2026-05-12 Listing Removed — GAMLS
- 2026-04-14 Price Changed $374,900 GAMLS
- 2026-03-29 Price Changed $379,900 GAMLS
- 2026-01-03 Price Changed $385,000 GAMLS
- 2025-12-15 Listed $395,000 GAMLS
- 2025-12-14 Coming Soon — GAMLS
- 2025-10-31 Listing Removed — FMLS
- 2025-10-31 Listing Removed — GAMLS
- 2025-06-30 Listed $399,900 FMLS
- 2025-06-29 Price Changed $399,900 GAMLS
- 2025-06-29 Coming Soon — FMLS
- 2025-06-12 Relisted — GAMLS
- 2025-06-11 Listing Removed — FMLS
- 2025-06-11 Listing Removed — GAMLS
- 2025-03-11 Listed $400,000 FMLS
- 2025-03-11 Listed $400,000 GAMLS
- 2020-01-15 Sold (Public Records) $239,900 Public Records
- 2020-01-13 Sold (MLS) $239,900 GAMLS
- 2020-01-13 Sold (MLS) $239,900 FMLS
- 2019-11-13 Pending — GAMLS
- 2019-11-13 Pending — FMLS
- 2019-11-01 Price Changed $235,000 GAMLS
- 2019-10-31 Price Changed $235,000 FMLS
- 2019-10-18 Price Changed $239,000 GAMLS
- 2019-10-17 Price Changed $239,000 FMLS
- 2019-09-27 Price Changed $240,000 GAMLS
- 2019-09-27 Price Changed $240,000 FMLS
- 2019-09-13 Price Changed $245,000 GAMLS
- 2019-09-12 Price Changed $245,000 FMLS
- 2019-08-30 Price Changed $249,000 GAMLS
- 2019-08-29 Price Changed $249,000 FMLS
- 2019-08-16 Price Changed $253,000 GAMLS
- 2019-08-15 Price Changed $253,000 FMLS
- 2019-08-02 Price Changed $258,000 GAMLS
- 2019-08-01 Price Changed $258,000 FMLS
- 2019-07-19 Price Changed $261,000 GAMLS
- 2019-07-18 Price Changed $261,000 FMLS
- 2019-07-05 Price Changed $263,000 GAMLS
- 2019-07-04 Price Changed $263,000 FMLS
- 2019-06-20 Listed $265,000 GAMLS
- 2019-06-20 Listed $265,000 FMLS
- 2019-06-05 Sold (Public Records) $230,000 Public Records
Property tax history
+0.4%/yrLatest (2025): $3,267 · +3.4% YoY. Source: county tax records.
Cash-flow waterfall
monthlySold comps — $/sqft
last 12 mo · ≤1 miLoading sold comps…