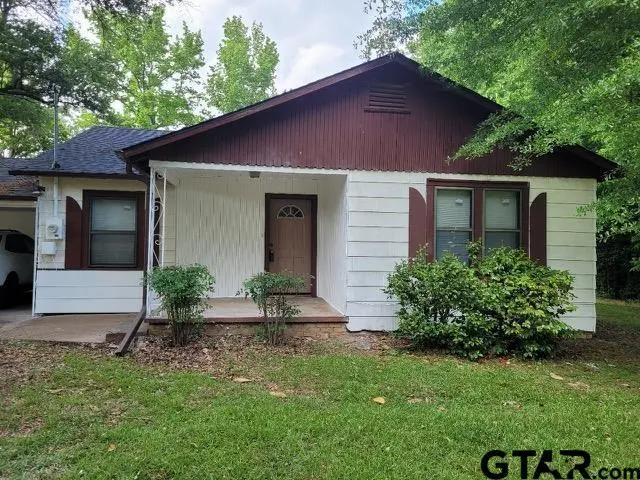
803 W Noble · Troup, TX
Flood risk 1/10 · Minimal
- FEMA flood zone
- X (unshaded)
- Chance of flooding over 30 yrs
- 0.0%
- Est. flood insurance / yr
- $507 – $1,088
Fire risk 5/10 · Moderate
- Est. fire insurance / yr
- $1,222 – $2,270
Heat risk 7/10 · Major
- Hot days now (above 110°F)
- 7 days/yr
- Hot days in 30 yrs
- 25 days/yr
Wind risk 6/10 · Moderate
- Chance of severe wind over 30 yrs
- 66.0%
Air-quality risk 2/10 · Minimal
- Unhealthy air days now
- 0 days/yr
- Unhealthy air days in 30 yrs
- 1 days/yr
Risk factors via First Street. Map © Google.
Why this score? — see what drove the D grade
The composite is a weighted blend of 9 inputs, each scored 0–100. Each bar is that input's sub-score; the figure is the points it added to the 100-point composite (weight × sub-score).
- ARV discount +15.0/15.0
- Cash flow +9.1/30.0
- Schools +4.6/10.0
- Livability +3.4/5.0
- DSCR +2.5/10.0
- Rent growth +2.5/5.0
- Condition / age +2.5/5.0
- 1% rule +2.2/10.0
- Appreciation +0.0/10.0
$159,900
🖨 Deal sheet 📄 Offer letter ✓ Due diligence
Listing remarks MLS
Just outside of Tyler, in the quiet community of Troup this 1940's home is full of character and ready for its next chapter. Sitting on four city lots, the property offers beautiful mature trees and plenty of space to make it your own. Fenced all the way around and gated with a two car carport. This home could use a few updates and is being sold as is, making it a great opportunity for investors, flippers or buyers wanting a chance to create their own space. So much potential! With a new roof and a new storage building outside, some of the details have already been completed. The large back room has its own exterior entry and full bath perfect for a young college student, aging parent, so many options! Call today for your private showing!
Key facts
- Built 1947
- Listed 83 days
Neighborhood map
What this means for you Summary
Snapshot
- This is a 3-bed/1.0-bath single-family listed at $160k.
Deal economics
- At list price, monthly cash flow is $-122 ($-1k/yr) — negative.
- To cash-flow at today's rent, offer at most $138k (13.5% below list).
- To meet the 1% rule (rent ≥ 1% of price), the offer needs to be $115k (28.1% below list).
- Recommended offer: $115k (28.1% below list) — sets the bar for 1% rule.
Location & tenants
- Location reads 68/100 on livability (#503 in TX) — a middle-class / working-renter tenant base. Strengths: cost of living A+, housing A+, crime B+; Watch: schools C-, amenities F, commute F.
- Troup ISD (rural): math 52% / reading 56% proficiency, ranked #128 of 826 in TX (top 16%) — acceptable for families but not a draw, mixed tenant base, ~2y average lease.
- Market conditions: 209 active listings in the ZIP; 2 comparable units currently listed for rent nearby; 595 units permitted in Smith County in 2024 (45 in 5+ unit buildings).
Forward outlook
- Local home prices are declining (-3.0%/yr); year-one equity from $1k of loan paydown is wiped out by about $5k of value loss. Plan a longer hold.
- Smith County population projected at +24% by 2050 — long-run rental-demand tailwind backs the buy-and-hold thesis.
Negotiation context
- It's been on market 84 days — a 6% lower offer ($150k) is reasonable based on typical stale-listing flexibility.
- 4 sale attempts since 9y ago with the ask held roughly flat each time — persistent listings suggest the price (not the market) is what's stuck; bring a comps-based counter.
Risks & watch-outs
- Watch-outs: built in 1947 — expect roof / HVAC / electrical / plumbing capex.
- Climate carrying-cost: major wind risk, 66% chance of damaging wind over 30y; moderate wildfire risk; extreme-heat days projected 7→25/yr by 2055 (HVAC capex compounding) — expect insurance premiums to compound above CPI over the hold.
Questions for the listing agent
- What do current leases actually rent for vs. the listed asking? Can we see a recent rent roll and the last 12 months of T-12 income?
- It's been on market 84 days. Have you received any prior offers? Is the seller open to a 28% concession, seller financing, or rate buy-down credit?
- Built in 1947 — when were the roof, HVAC, electrical panel, plumbing, and water heater last replaced?
- Why hasn't it sold? Are there any deal-killer items the seller is aware of (foundation, flood, title, zoning, code violations)?
- Is there a deadline driving the sale (1031 exchange, divorce, estate, relocation)? That informs how much negotiation room exists.
- The area grade is low — what's the realistic commute time and amenity access for the typical tenant pool here? Any planned neighborhood developments (good or bad) we should know about?
- What's the average days-on-market for RENTAL listings here right now (not sales)? A rising rental-DOM trend means longer vacancies and softer asking-rent achievability than the comps imply.
- What's the recent tenant-quality profile in this submarket — average credit score on applications, eviction rate, late-payment / NSF rate, and stable-employment percentage? A property-management company in the area should have these aggregated.
- How much new for-sale + rental construction is in the pipeline within 1–3 miles? Heavy new supply typically softens prices + rents 12–24 months out; constrained supply supports both.
Investment metrics
- 1% rule
- 0.72% ✗
- Cap rate
- 5.38%
- Cash-on-cash
- -3.26%
- DSCR
- 0.85
- GRM
- 11.6
CMA / ARV
- ARV (median comp)
- $231,968
- List price
- $159,900
- Delta
- -31.07%
- Verdict
- UNDERPRICED
- Comps
- 6 within 1.0 mi
Show comp detail 1 sale within ~0.75 mi
| Address | Dist | Beds/Ba | Sqft | Sold | Price | $/sf | Match |
|---|---|---|---|---|---|---|---|
| 414 Tara Ln | 0.61mi | 3/2.0 | 1,474 (+1%) | 9mo | $214,900 | $146 | 58 |
Match score weights: distance 35% · size 25% · config 20% · recency 20%. Top-matched comps best support the ARV.
Projected returns pro-forma
-3.0% appreciation · 3.0% rent growth · sell at horizon
- IRR
- -21.8%
- Equity multiple
- 0.25×
- Total profit
- $-33,694
- Equity at exit
- $23,842
- IRR
- -15.6%
- Equity multiple
- 0.12×
- Total profit
- $-39,442
- Equity at exit
- $13,825
Cash invested: $44,772 (down + closing). Projections, not guarantees.
Landlord ↔ Tenant lean methodology
- Overall (STATE)
- 87 Strongly Landlord-Friendly
- State Texas
- 87 Strongly Landlord-Friendly · R+5
- County
- — inherits STATE
- City
- — inherits STATE
ZIP-level market 75789
- Home prices YoY
- -15.9%
- Active inventory
- 209
- Price-to-rent
- 11.6×
Monthly cashflow live
- Estimated rent
- $1,150 medium interval (Pro) →
- Mortgage (P&I)
- −$839
- Tax from tax record
- −$125 /mo · $1,501/yr
- Insurance
- −$67
- HOA
- −$0
- Vacancy / Maint / Mgmt
- −$242
- Net cashflow
- $-122
Break-even live
UW: 25.0% down · 7.5% · 30yr · 1.5% tax · 5.0% vac · 8.0% maint · 8.0% mgmt
Financing live
Cash to close
- Down payment
- $39,975
- Closing costs
- $4,797
- Reserves months
- —
- Total cash needed
- —
Loan-product check · same deal, 3 products live
Conventional
25% down · 7.5% · 30yr
- Down + closing
- —
- Monthly P&I
- —
- Monthly cashflow
- —
- DSCR
- —
- Eligible?
- —
Personal DTI + credit; lowest rate.
DSCR
20% down · 8.5% · 30yr
- Down + closing
- —
- Monthly P&I
- —
- Monthly cashflow
- —
- DSCR
- —
- Eligible?
- —
No personal income docs; deal must DSCR.
Hard money
10% down · 12.0% · 12mo
- Down + closing
- —
- Monthly P&I
- —
- Monthly cashflow
- —
- DSCR
- —
- Eligible?
- —
Short-term bridge; refi at stabilization.
Rent comps 2 comps
| Address | Beds | Baths | Sqft | Rent | $/sqft | DOM | Units | Dist |
|---|---|---|---|---|---|---|---|---|
| 105 S Beulah St Troup, TX | 3.0 | 2.0 | 1200 | $1,150 | $0.96 | 44d | 1 | 0.09mi |
| 105 S Beulah St Troup, TX | 3.0 | 2.0 | 1200 | $1,150 | $0.96 | 21d | 1 | 0.09mi |
Listing history 27 events
-
2026-06-18days on market $159,900 Active 84 DOM
-
2026-06-17days on market $159,900 Active 83 DOM
-
2026-06-16days on market $159,900 Active 82 DOM
-
2026-06-15days on market $159,900 Active 81 DOM
-
2026-06-15days on market $159,900 Active 80 DOM
-
2026-06-13days on market $159,900 Active 79 DOM
-
2026-06-12days on market $159,900 Active 78 DOM
-
2026-06-09days on market $159,900 Active 75 DOM
-
2026-06-08days on market $159,900 Active 74 DOM
-
2026-06-08days on market $159,900 Active 73 DOM
-
2026-06-07days on market $159,900 Active 72 DOM
-
2026-06-03days on market $159,900 Active 69 DOM
-
2026-06-02days on market $159,900 Active 68 DOM
-
2026-06-01days on market $159,900 Active 67 DOM
-
2026-05-31days on market $159,900 Active 66 DOM
-
2026-03-27$159,900 Active 748-char remark
Show marketing remark (748 chars)
Just outside of Tyler, in the quiet community of Troup this 1940's home is full of character and ready for its next chapter. Sitting on four city lots, the property offers beautiful mature trees and plenty of space to make it your own. Fenced all the way around and gated with a two car carport. This home could use a few updates and is being sold as is, making it a great opportunity for investors, flippers or buyers wanting a chance to create their own space. So much potential! With a new roof and a new storage building outside, some of the details have already been completed. The large back room has its own exterior entry and full bath perfect for a young college student, aging parent, so many options! Call today for your private showing!
-
2025-05-27price $178,000
-
2025-05-20price $178,500
-
2025-05-03price $177,500
-
2025-04-07price $178,000
-
2025-01-01status Active
-
2025-01-01price $179,000
-
2023-06-12$183,000
-
2017-08-09soldstatus
-
2017-08-08soldstatus
-
2017-06-01$85,000
-
2006-04-20soldstatus
ⓘ Source: listings_history table (triggers on properties + properties_extension) + one-shot
backfill from property_details.listing_events for pre-trigger history.
Tax reassessment forecast TX · Resets to sale price
- Current annual tax
- $1,501 · $125/mo
- Projected year-2 tax
- $2,926 · $244/mo
- Expected delta
- +$1,425/yr (+$119/mo · 94.9%)
ⓘ Screening estimate from a state-policy table — verify with the county assessor before closing.
Climate risk First Street
- Flood 1/10 Low FEMA zone X (unshaded) · 0% chance over 30 yrs
- Wildfire 5/10 Major
- Heat 7/10 Severe 7 d/yr ≥110°F today · 25 d/yr by 30 yrs out
- Wind 6/10 Major 66% chance of damaging wind over 30 yrs
- Air quality 2/10 Low 0 unhealthy d/yr today · 1 by 30 yrs out
Nearby sold comps map
Loading sold comps map…
Walkable amenities ~0.75 mi
Loading nearby amenities…
Taxation est. · year 1
- Rental income
- $13,800
- − Mortgage interest
- −$8,957
- − Property taxes
- −$1,501
- − Insurance
- −$800
- − Repairs & maintenance
- −$1,104
- − Management
- −$1,104
- − Depreciation
- −$4,652
- Taxable loss
- −$4,317
- Est. tax savings @ 24.0%
- +$1,036
- After-tax cash flow
- $-425/yr
For passive investors: Depreciation is non-cash, so a rental often shows a tax loss while cash-flowing — sheltering income. Rental losses are passive: they offset passive income freely, and up to $25,000/yr can offset ordinary (W-2) income if you actively participate and your MAGI is under $100k (phasing out to $0 by $150k); unused losses carry forward. On sale, claimed depreciation is recaptured at up to 25%, and gains may owe capital-gains tax (a 1031 exchange can defer both). Figures are a year-1 estimate at your 24.0% rate — not tax advice; consult a CPA.
Schools (NCES district)
- District
- Troup ISD
- NCES district ID
- 4843230
- Math proficiency
- 52% ▼ -6.00%
- Reading proficiency
- 56% ▲ 1.00%
- Median HH income
- $45,280
- Composite
- 45.64/100
- National rank
- #2585
- State rank
- #128 of 826 in TX
Livability — Troup
- Score
- 68/100
- State rank
- #503
- US rank
- #9973
Category grades
Schools grade is shown separately in the Schools card above.
Census & demographics
- Census place
- Troup, TX
- Population (ZIP)
- 8,332
Population outlook (Smith County) Hauer SSP2
- Today (2025)
- 248,890 people
- By 2030
- 261,665 · +5.1%
- By 2040
- 286,114 · +15.0%
- By 2050
- 308,006 · +23.8%
- By 2075
- 354,171 · +42.3%
- By 2100
- 372,828 · +49.8%
Race, ethnicity, and origin ACS 2023
- Neighborhood character
- Predominantly White (72%)
- Race & ethnicity
- White 72% Hispanic / Latino 14% Black 11% Two or more races 7%
- Hispanic origin (detail)
- Mexican 13%
- Common ancestry
- Italian 2% Slovak 1% Iranian 1%
- Foreign-born
- 6% · Canada
- Languages at home
- 88% English-only · Spanish 12%
Political lean MEDSL · Smith
- 2024 margin
- Solid R (+45.1) · D 27.0% · R 72.1%
- 2008→2024 swing
- -5.6pp toward R · 2008: -39.5pp · 2024: -45.1pp
- All cycles
- 2024: R+45.1 2020: R+39.4 2016: R+43.9 2012: R+46.9 2008: R+39.5
Not yet ingested
- Civics
- —
Market trends
- HPI YoY
- ▼ -43.00%
- Current HPI
- 226.8341
- Rent YoY
- —
- Metro
- —
- State GDP YoY
- ▲ 3.95%
- F500 in state
- 110
Industry mix (Fortune 500 HQ in TX)
| Industry | F500 HQs | Revenue |
|---|---|---|
| Energy | 16 | $1,198B |
|
||
| Technology | 5 | $198B |
|
||
| Engineering / Construction | 4 | $72B |
|
||
| Energy Services | 3 | $60B |
|
||
| Utilities | 3 | $41B |
|
||
| Healthcare | 2 | $330B |
|
||
Price history
+88.1% since first listed12 events — show timeline
- 2026-03-27 Listed $159,900 GTAR
- 2025-05-27 Price Changed $178,000 GTAR
- 2025-05-20 Price Changed $178,500 GTAR
- 2025-05-03 Price Changed $177,500 GTAR
- 2025-04-07 Price Changed $178,000 GTAR
- 2025-01-01 Relisted — GTAR
- 2025-01-01 Price Changed $179,000 GTAR
- 2023-06-12 Listed $183,000 GTAR
- 2017-08-09 Sold (Public Records) — Public Records
- 2017-08-08 Sold (MLS) — GTAR
- 2017-06-01 Listed $85,000 GTAR
- 2006-04-20 Sold (Public Records) — Public Records
Property tax history
+1.9%/yrLatest (2024): $1,501 · +15.2% YoY. Source: county tax records.
Cash-flow waterfall
monthlySold comps — $/sqft
last 12 mo · ≤1 miLoading sold comps…