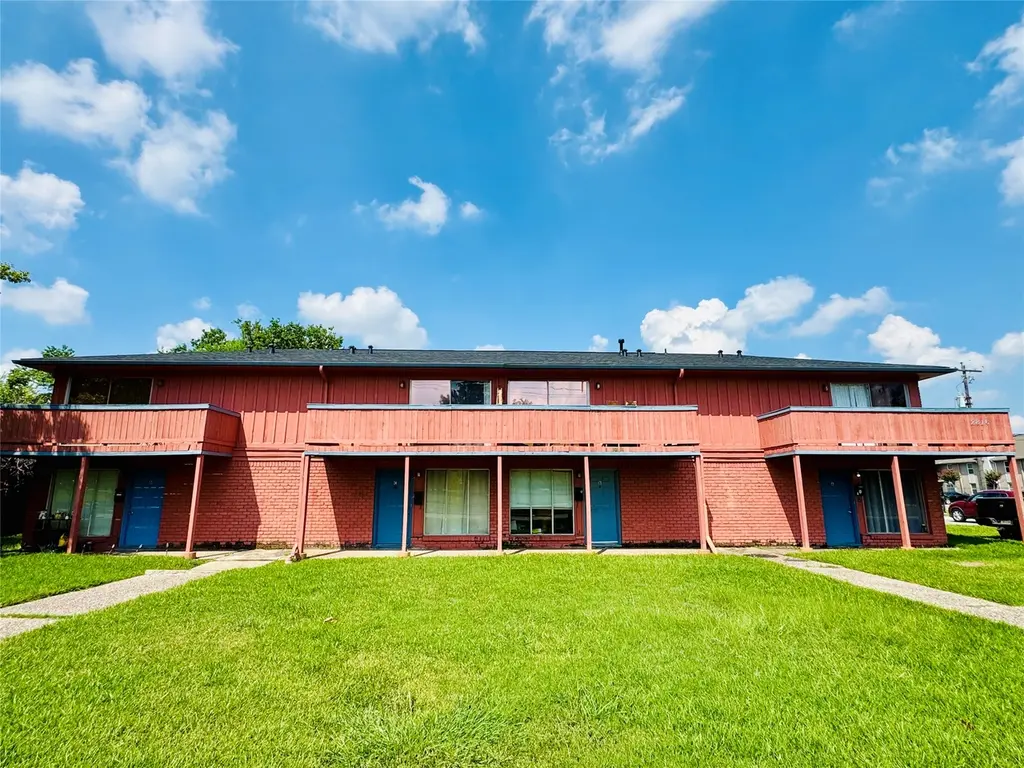
 Fourplex
2816 Lafferty Rd #4 · Pasadena, TX
Flood risk 6/10 · Moderate
- FEMA flood zone
- AE
- Chance of flooding over 30 yrs
- 0.74%
- Est. flood insurance / yr
- $1,737 – $8,500
Fire risk 1/10 · Minimal
- Est. fire insurance / yr
- $1,222 – $2,270
Heat risk 9/10 · Severe
- Hot days now (above 109°F)
- 7 days/yr
- Hot days in 30 yrs
- 24 days/yr
Wind risk 9/10 · Severe
- Chance of severe wind over 30 yrs
- 99.0%
Air-quality risk 2/10 · Minimal
- Unhealthy air days now
- 2 days/yr
- Unhealthy air days in 30 yrs
- 2 days/yr
Risk factors via First Street. Map © Google.
Why this score? — see what drove the D grade
The composite is a weighted blend of 9 inputs, each scored 0–100. Each bar is that input's sub-score; the figure is the points it added to the 100-point composite (weight × sub-score).
- Cash flow +19.4/30.0
- DSCR +6.1/10.0
- 1% rule +5.6/10.0
- Livability +3.3/5.0
- Schools +2.6/10.0
- Rent growth +2.5/5.0
- Condition / age +2.5/5.0
- ARV discount +2.0/15.0
- Appreciation +0.0/10.0
$495,000
🖨 Deal sheet 📄 Offer letter ✓ Due diligence
Multi-family units
County records classify this as Multi-Family (2-4 Unit). Listing-text estimate: 4 units. confirmed
Listing remarks MLS
Exceptional opportunity! This fully leased 4-plex offers four spacious 2-bedroom, 2-bath units, each designed for comfortable living with functional layouts in a 2 story townhome style property with modern amenities and onsite laundry room. All units have there own private balcony, patio and covered parking area. A brand new roof was recently installed, all leases are currently month to month providing options for the new owner. Ideally situated directly in front of a beautiful city park featuring tennis courts, baseball fields, and a water park—providing endless outdoor activities just steps from the property. Bailey Elementary school is located 1 block away. Strong rental potential, unbeatable location, and proximity to recreation and education make this property a standout addition to any portfolio. Property has prelim docs available for a future built on the location.
Key facts
- Brand new roof
- Private balcony
- Fully leased 4-plex
Tags
Neighborhood map
What this means for you Summary
Snapshot
- This is a 4 × 2-bed/2-bath units multifamily listed at $495k.
Deal economics
- At list price, monthly cash flow is $123 ($1k/yr) — positive. Per door: $31/mo.
- The deal already cash-flows at list — no discount required.
- Meets the 1% rule at list price ($5k rent vs $495k).
- Recommended offer: $450k (9.0% below list) — sets the bar for market timing.
- Cap rate 7.6% vs local median 3.4% in Pasadena — top-decile yield for the area; either an underpriced asset or a hidden risk that comps aren't pricing in. Stress-test before assuming the spread holds.
Location & tenants
- Location reads 66/100 on livability (#600 in TX) — a middle-class / working-renter tenant base. Strengths: cost of living A+, housing A+; Watch: schools D+, employment D+, crime F.
- Pasadena ISD (suburban): math 29% / reading 32% proficiency, ranked #612 of 826 in TX (top 74%) — families likely to look elsewhere, expect single-tenant / working-renter base with shorter leases; 71% free/reduced lunch — lower-income household profile, screen leases tightly.
- Market conditions: 99 active listings in the ZIP; 29,883 units permitted in Harris County in 2024 (8,621 in 5+ unit buildings).
- At $5,261/mo this rent would consume 101% of the median local household income ($62k/yr) (locally 1285% of renters already pay >50% of income on rent) — very limited rent-growth headroom before tenants either downsize or default.
Forward outlook
- Local home prices are declining (-3.0%/yr); year-one equity from $3k of loan paydown is wiped out by about $15k of value loss. Plan a longer hold.
- Harris County population projected at +47% by 2050 — long-run rental-demand tailwind backs the buy-and-hold thesis.
Negotiation context
- It's been on market 91 days — a 9% lower offer ($450k) is reasonable based on typical stale-listing flexibility.
- 4 sale attempts since 5y ago with the ask held roughly flat each time — persistent listings suggest the price (not the market) is what's stuck; bring a comps-based counter.
Risks & watch-outs
- Watch-outs: flood insurance adds $427/mo.
- Climate carrying-cost: in FEMA flood zone AE (mandatory federal flood insurance); severe wind risk, 99% chance of damaging wind over 30y; extreme-heat days projected 7→24/yr by 2055 (HVAC capex compounding) — expect insurance premiums to compound above CPI over the hold.
Questions for the listing agent
- It's been on market 91 days. Have you received any prior offers? Is the seller open to a 9% concession, seller financing, or rate buy-down credit?
- Can we see the unit-by-unit rent roll, current vacancy, and any below-market leases? What's the average tenancy length?
- What capital expenditures (roof, boiler, parking lot, exteriors) have been made in the last 5 years, and what's planned in the next 2?
- Built in 1964 — when were the roof, HVAC, electrical panel, plumbing, and water heater last replaced?
- What's the actual annual flood-insurance premium (NFIP or private), and is the property in a SFHA with mandatory coverage?
- Why hasn't it sold? Are there any deal-killer items the seller is aware of (foundation, flood, title, zoning, code violations)?
- Is there a deadline driving the sale (1031 exchange, divorce, estate, relocation)? That informs how much negotiation room exists.
- Schools are D-rated, which usually means shorter tenancies and higher turnover. Who's the typical renter profile here, and what's been the actual vacancy rate?
- Crime grade is F in this area — have there been break-ins, vandalism, or insurance claims at this property in the last 3 years? What carrier currently insures it and at what premium?
- The area grade is low — what's the realistic commute time and amenity access for the typical tenant pool here? Any planned neighborhood developments (good or bad) we should know about?
- What's the average days-on-market for RENTAL listings here right now (not sales)? A rising rental-DOM trend means longer vacancies and softer asking-rent achievability than the comps imply.
- What's the recent tenant-quality profile in this submarket — average credit score on applications, eviction rate, late-payment / NSF rate, and stable-employment percentage? A property-management company in the area should have these aggregated.
- How much new apartment / multifamily construction is in the pipeline within 1–3 miles? Heavy new supply (>2% of stock underway) typically softens rents 12–24 months out; light construction supports rent growth.
Investment metrics
- 1% rule
- 1.06% ✓
- Cap rate
- 7.63%
- Cash-on-cash
- 4.76%
- DSCR
- 1.21
- GRM
- 7.8
CMA / ARV
- ARV (median comp)
- $441,317
- List price
- $495,000
- Delta
- 12.16%
- Verdict
- OVERPRICED
- Comps
- 4 within 2.0 mi
Projected returns pro-forma
-3.0% appreciation · 3.0% rent growth · sell at horizon
- IRR
- -14.5%
- Equity multiple
- 0.48×
- Total profit
- $-71,904
- Equity at exit
- $73,806
- IRR
- -5.6%
- Equity multiple
- 0.63×
- Total profit
- $-50,651
- Equity at exit
- $42,799
Cash invested: $138,600 (down + closing). Projections, not guarantees.
Landlord ↔ Tenant lean methodology
- Overall (STATE)
- 87 Strongly Landlord-Friendly
- State Texas
- 87 Strongly Landlord-Friendly · R+5
- County
- — inherits STATE
- City
- — inherits STATE
ZIP-level market 77502
- Home prices YoY
- -14.2%
- Active inventory
- 99
- Price-to-rent
- 31.4×
Monthly cashflow live
- Estimated rent
- $5,261 high interval (Pro) →
- Mortgage (P&I)
- −$2,596
- Tax from tax record
- −$804 /mo · $9,651/yr
- Insurance
- −$206
- Flood insurance flood zone
- −$427 /mo · $5,118/yr
- HOA
- −$0
- Vacancy / Maint / Mgmt
- −$1,105
- Net cashflow
- $123
Break-even live
4-unit breakdown (identical units grouped — click to expand)
| Units | Beds | Baths | Est. rent |
|---|---|---|---|
| 4× units | 2 | 2 | $5,260 |
| #1 | 2 | 2 | $1,315 |
| #2 | 2 | 2 | $1,315 |
| #3 | 2 | 2 | $1,315 |
| #4 | 2 | 2 | $1,315 |
| Total (4 units) | $5,261 | ||
UW: 25.0% down · 7.5% · 30yr · 1.5% tax · 5.0% vac · 8.0% maint · 8.0% mgmt
Financing live
Cash to close
- Down payment
- $123,750
- Closing costs
- $14,850
- Reserves months
- —
- Total cash needed
- —
Loan-product check · same deal, 3 products live
Conventional
25% down · 7.5% · 30yr
- Down + closing
- —
- Monthly P&I
- —
- Monthly cashflow
- —
- DSCR
- —
- Eligible?
- —
Personal DTI + credit; lowest rate.
DSCR
20% down · 8.5% · 30yr
- Down + closing
- —
- Monthly P&I
- —
- Monthly cashflow
- —
- DSCR
- —
- Eligible?
- —
No personal income docs; deal must DSCR.
Hard money
10% down · 12.0% · 12mo
- Down + closing
- —
- Monthly P&I
- —
- Monthly cashflow
- —
- DSCR
- —
- Eligible?
- —
Short-term bridge; refi at stabilization.
Listing history 27 events
-
2026-06-18days on market $495,000 Active 91 DOM
-
2026-06-17days on market $495,000 Active 90 DOM
-
2026-06-16days on market $495,000 Active 89 DOM
-
2026-06-15days on market $495,000 Active 88 DOM
-
2026-06-13days on market $495,000 Active 86 DOM
-
2026-06-10days on market $495,000 Active 82 DOM
-
2026-06-08days on market $495,000 Active 81 DOM
-
2026-06-07days on market $495,000 Active 80 DOM
-
2026-06-04days on market $495,000 Active 77 DOM
-
2026-06-03days on market $495,000 Active 76 DOM
-
2026-06-02days on market $495,000 Active 75 DOM
-
2026-06-01days on market $495,000 Active 74 DOM
-
2026-05-31days on market $495,000 Active 73 DOM
-
2026-03-19$495,000 Active 894-char remark
Show marketing remark (894 chars)
Exceptional opportunity! This fully leased 4-plex offers four spacious 2-bedroom, 2-bath units, each designed for comfortable living with functional layouts in a 2 story townhome style property with modern amenities and onsite laundry room. All units have there own private balcony, patio and covered parking area. A brand new roof was recently installed, all leases are currently month to month providing options for the new owner. Ideally situated directly in front of a beautiful city park featuring tennis courts, baseball fields, and a water park—providing endless outdoor activities just steps from the property. Bailey Elementary school is located 1 block away. Strong rental potential, unbeatable location, and proximity to recreation and education make this property a standout addition to any portfolio. Property has prelim docs available for a future built on the location.
-
2025-12-31historical
-
2025-09-03$495,000 Active
-
2022-07-05historical
-
2022-05-09status Active
-
2022-05-03status Pending
-
2022-04-22status Option Pending
-
2021-10-19price $495,000
-
2021-07-12$480,000 Active
-
2018-01-25soldstatus
-
2016-05-06soldstatus
-
2014-12-19soldstatus
-
2003-02-05soldstatus
-
1988-01-02soldstatus
ⓘ Source: listings_history table (triggers on properties + properties_extension) + one-shot
backfill from property_details.listing_events for pre-trigger history.
Tax reassessment forecast TX · Resets to sale price
- Current annual tax
- $9,651 · $804/mo
- Projected year-2 tax
- $9,651 · $804/mo
- Expected delta
- $0/yr ($0/mo · 0.0%)
ⓘ Screening estimate from a state-policy table — verify with the county assessor before closing.
Climate risk First Street
- Flood 6/10 Major FEMA zone AE · 74% chance over 30 yrs
- Wildfire 1/10 Low
- Heat 9/10 Extreme 7 d/yr ≥109°F today · 24 d/yr by 30 yrs out
- Wind 9/10 Extreme 99% chance of damaging wind over 30 yrs
- Air quality 2/10 Low 2 unhealthy d/yr today · 2 by 30 yrs out
Nearby sold comps map
Loading sold comps map…
Walkable amenities ~0.75 mi
Loading nearby amenities…
Taxation est. · year 1
- Rental income
- $63,132
- − Mortgage interest
- −$27,728
- − Property taxes
- −$9,651
- − Insurance
- −$7,594
- − Repairs & maintenance
- −$5,051
- − Management
- −$5,051
- − Depreciation
- −$14,400
- Taxable loss
- −$6,342
- Est. tax savings @ 24.0%
- +$1,522
- After-tax cash flow
- $3,001/yr
For passive investors: Depreciation is non-cash, so a rental often shows a tax loss while cash-flowing — sheltering income. Rental losses are passive: they offset passive income freely, and up to $25,000/yr can offset ordinary (W-2) income if you actively participate and your MAGI is under $100k (phasing out to $0 by $150k); unused losses carry forward. On sale, claimed depreciation is recaptured at up to 25%, and gains may owe capital-gains tax (a 1031 exchange can defer both). Figures are a year-1 estimate at your 24.0% rate — not tax advice; consult a CPA.
Schools (NCES district)
- District
- Pasadena ISD
- NCES district ID
- 4834320
- Math proficiency
- 29% ▼ -17.00%
- Reading proficiency
- 32% ▼ -9.00%
- Median HH income
- $45,163
- Composite
- 26.15/100
- National rank
- #7275
- State rank
- #612 of 826 in TX
Livability — Pasadena
- Score
- 66/100
- State rank
- #600
- US rank
- #11438
Category grades
Schools grade is shown separately in the Schools card above.
Census & demographics
- Census place
- Pasadena, TX
- County
- Harris County · 4,702,590 people
- City population
- 109,190
- Metro
- Houston-The Woodlands-Sugar Land, TX
- Population (ZIP)
- 36,371
- Household income
- $62,500
- Rent vs Own
- Severe rent burden
- 1285.0
Population outlook (Harris County) Hauer SSP2
- Today (2025)
- 5,571,493 people
- By 2030
- 6,089,821 · +9.3%
- By 2040
- 7,142,806 · +28.2%
- By 2050
- 8,185,864 · +46.9%
- By 2075
- 10,574,329 · +89.8%
- By 2100
- 12,109,958 · +117.4%
Race, ethnicity, and origin ACS 2023
- Neighborhood character
- Predominantly Hispanic (83%)
- Race & ethnicity
- Hispanic / Latino 83% Two or more races 37% White 12% Black 4%
- Hispanic origin (detail)
- Mexican 75% Puerto Rican 1% Cuban 2%
- Common ancestry
- Italian 1%
- Foreign-born
- 30% · Canada
- Languages at home
- 40% English-only · Spanish 60%
Political lean MEDSL · Harris
- 2024 margin
- Lean D (+5.5) · D 52.0% · R 46.4% · Other 1.6%
- 2008→2024 swing
- +3.9pp toward D · 2008: 1.6pp · 2024: 5.5pp
- All cycles
- 2024: D+5.5 2020: D+13.3 2016: D+12.4 2012: D+0.1 2008: D+1.6
Not yet ingested
- Civics
- —
Market trends
- HPI YoY
- ▼ -46.12%
- Current HPI
- 278.9293
- Rent YoY
- —
- Metro
- Houston-The Woodlands-Sugar Land, TX
- State GDP YoY
- ▲ 3.95%
- F500 in state
- 110
Industry mix (Fortune 500 HQ in TX)
| Industry | F500 HQs | Revenue |
|---|---|---|
| Energy | 16 | $1,198B |
|
||
| Technology | 5 | $198B |
|
||
| Engineering / Construction | 4 | $72B |
|
||
| Energy Services | 3 | $60B |
|
||
| Utilities | 3 | $41B |
|
||
| Healthcare | 2 | $330B |
|
||
Price history
+3.1% since first listed14 events — show timeline
- 2026-03-19 Listed $495,000 HARMLS
- 2025-12-31 Listing Removed — HARMLS
- 2025-09-03 Listed $495,000 HARMLS
- 2022-07-05 Listing Removed — HARMLS
- 2022-05-09 Relisted — HARMLS
- 2022-05-03 Pending — HARMLS
- 2022-04-22 Pending — HARMLS
- 2021-10-19 Price Changed $495,000 HARMLS
- 2021-07-12 Listed $480,000 HARMLS
- 2018-01-25 Sold (Public Records) — Public Records
- 2016-05-06 Sold (Public Records) — Public Records
- 2014-12-19 Sold (Public Records) — Public Records
- 2003-02-05 Sold (Public Records) — Public Records
- 1988-01-02 Sold (Public Records) — Public Records
Property tax history
+9.4%/yrLatest (2025): $9,651 · -8.2% YoY. Source: county tax records.
Cash-flow waterfall
monthlySold comps — $/sqft
last 12 mo · ≤1 miLoading sold comps…