300 S Maxwell Ave · Tulia, TX
Flood risk 1/10 · Minimal
- FEMA flood zone
- —
- Chance of flooding over 30 yrs
- 0.0%
- Est. flood insurance / yr
- —
Fire risk 8/10 · Major
- Est. fire insurance / yr
- $1,222 – $2,270
Heat risk 4/10 · Minor
- Hot days now (above 98°F)
- 5 days/yr
- Hot days in 30 yrs
- 14 days/yr
Wind risk 2/10 · Minimal
- Chance of severe wind over 30 yrs
- —
Air-quality risk 2/10 · Minimal
- Unhealthy air days now
- 1 days/yr
- Unhealthy air days in 30 yrs
- 1 days/yr
Risk factors via First Street. Map © Google.
Why this score? — see what drove the D grade
The composite is a weighted blend of 9 inputs, each scored 0–100. Each bar is that input's sub-score; the figure is the points it added to the 100-point composite (weight × sub-score).
- Cash flow +12.7/30.0
- ARV discount +7.5/15.0
- Appreciation +5.6/10.0
- DSCR +3.8/10.0
- 1% rule +3.0/10.0
- Livability +2.8/5.0
- Rent growth +2.5/5.0
- Condition / age +2.5/5.0
- Schools +1.8/10.0
$75,000
🖨 Deal sheet 📄 Offer letter ✓ Due diligence
Listing remarks
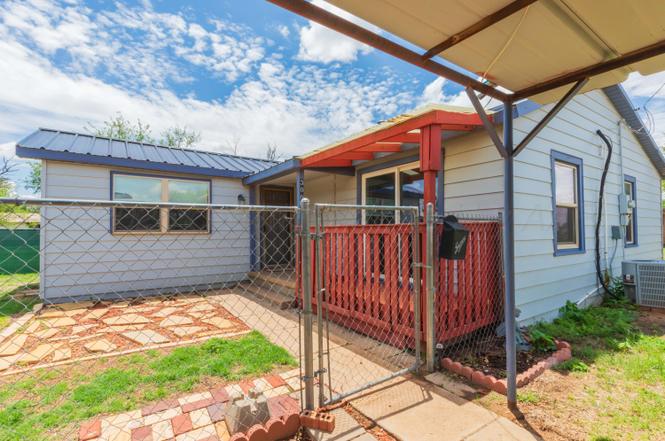
Small town charm meets everyday convenience in this beautifully maintained Tulia home! Located just steps from Tulia's downtown square, you'll love being able to walk to local shops, restaurants, groceries, and more while still enjoying the comfort of a quiet neighborhood. Inside, you'll find a bright and welcoming interior with updated flooring, neutral finishes, and a layout that feels both cozy and functional. Outside, the spacious yard, covered carport, storage building, and inviting outdoor living spaces offer plenty of room to enjoy West Texas evenings. Whether you're purchasing your first home, downsizing, or investing, this move in ready property is packed with value and charm.
Key facts
- Spacious yard
- Downtown square
- Covered carport
Tags
Property features AI
Finance
- Other: Zoning: 8000 series
- HOA & community: No community features listed
Exterior
- Parking: Carport
- Utilities: Public water; Public sewer
- Home design: Single-family residence; One level; Residential property
- Construction: Vinyl siding and frame construction; Pillar/post/pier foundation
- Exterior features: Outdoor kitchen; Chain link fence; Metal roof; Storage structure
Interior
- Kitchen: Microwave; Gas water heater; Outdoor kitchen (exterior structure)
- Bathrooms: 1 full bathroom
- Heating & cooling: Central heating; Central air conditioning
- Interior features: Pantry; No fireplace
- Laundry & utility: Laundry area in the kitchen
Neighborhood map
What this means for you Summary
Snapshot
- This is a 2-bed/1.0-bath single-family listed at $75k.
Deal economics
- At list price, monthly cash flow is $-8 ($-102/yr) — negative.
- To cash-flow at today's rent, offer at most $74k (2.0% below list).
- To meet the 1% rule (rent ≥ 1% of price), the offer needs to be $60k (20.1% below list).
- Recommended offer: $60k (20.1% below list) — sets the bar for 1% rule.
Location & tenants
- Location reads 56/100 on livability (#1,297 in TX) — a working-class tenant base; expect higher turnover. Strengths: cost of living A+, housing A; Watch: schools F, crime D-, amenities F.
- Tulia ISD (town): math 22% / reading 21% proficiency, ranked #768 of 826 in TX (top 93%) — low school quality limits family demand, transient renter base, plan for 1-2y turnover; 68% free/reduced lunch — lower-income household profile, screen leases tightly.
- Market conditions: 47 active listings in the ZIP; 1 comparable units currently listed for rent nearby.
Forward outlook
- In year one you build about $1k of equity ($519 loan paydown + $942 appreciation (1.3% local appreciation)).
- Swisher County population projected at -15% by 2050 — secular population decline; favor cash flow + early exit over multi-decade hold.
- At projected returns (1.3% appreciation + 3.0% rent growth), your $21k cash investment doubles in ~10 years — after that, you're playing with house money.
Negotiation context
- Only 13 days on market — expect competitive offers; lowballing is unlikely to land.
Risks & watch-outs
- Watch-outs: built in 1943 — expect roof / HVAC / electrical / plumbing capex.
- Climate carrying-cost: severe wildfire risk — expect insurance premiums to compound above CPI over the hold.
Questions for the listing agent
- What do current leases actually rent for vs. the listed asking? Can we see a recent rent roll and the last 12 months of T-12 income?
- Built in 1943 — when were the roof, HVAC, electrical panel, plumbing, and water heater last replaced?
- Is there a deadline driving the sale (1031 exchange, divorce, estate, relocation)? That informs how much negotiation room exists.
- Schools are F-rated, which usually means shorter tenancies and higher turnover. Who's the typical renter profile here, and what's been the actual vacancy rate?
- Crime grade is D in this area — have there been break-ins, vandalism, or insurance claims at this property in the last 3 years? What carrier currently insures it and at what premium?
- The area grade is low — what's the realistic commute time and amenity access for the typical tenant pool here? Any planned neighborhood developments (good or bad) we should know about?
- What's the average days-on-market for RENTAL listings here right now (not sales)? A rising rental-DOM trend means longer vacancies and softer asking-rent achievability than the comps imply.
- What's the recent tenant-quality profile in this submarket — average credit score on applications, eviction rate, late-payment / NSF rate, and stable-employment percentage? A property-management company in the area should have these aggregated.
- How much new for-sale + rental construction is in the pipeline within 1–3 miles? Heavy new supply typically softens prices + rents 12–24 months out; constrained supply supports both.
Investment metrics
- 1% rule
- 0.80% ✗
- Cap rate
- 6.16%
- Cash-on-cash
- -0.48%
- DSCR
- 0.98
- GRM
- 10.4
CMA / ARV
No comps found within radius.
Projected returns pro-forma
1.26% appreciation · 3.0% rent growth · sell at horizon
- IRR
- 1.7%
- Equity multiple
- 1.09×
- Total profit
- $1,794
- Equity at exit
- $26,608
- IRR
- 6.1%
- Equity multiple
- 1.77×
- Total profit
- $16,072
- Equity at exit
- $36,149
Cash invested: $21,000 (down + closing). Projections, not guarantees.
Landlord ↔ Tenant lean methodology
- Overall (STATE)
- 87 Strongly Landlord-Friendly
- State Texas
- 87 Strongly Landlord-Friendly · R+5
- County
- — inherits STATE
- City
- — inherits STATE
ZIP-level market 79088
- Home prices YoY
- 0.8%
- Active inventory
- 47
- Price-to-rent
- 10.4×
Monthly cashflow live
- Estimated rent
- $599 medium interval (Pro) →
- Mortgage (P&I)
- −$393
- Tax from tax record
- −$57 /mo · $685/yr
- Insurance
- −$31
- HOA
- −$0
- Vacancy / Maint / Mgmt
- −$126
- Net cashflow
- $-8
Break-even live
UW: 25.0% down · 7.5% · 30yr · 1.5% tax · 5.0% vac · 8.0% maint · 8.0% mgmt
Financing live
Cash to close
- Down payment
- $18,750
- Closing costs
- $2,250
- Reserves months
- —
- Total cash needed
- —
Loan-product check · same deal, 3 products live
Conventional
25% down · 7.5% · 30yr
- Down + closing
- —
- Monthly P&I
- —
- Monthly cashflow
- —
- DSCR
- —
- Eligible?
- —
Personal DTI + credit; lowest rate.
DSCR
20% down · 8.5% · 30yr
- Down + closing
- —
- Monthly P&I
- —
- Monthly cashflow
- —
- DSCR
- —
- Eligible?
- —
No personal income docs; deal must DSCR.
Hard money
10% down · 12.0% · 12mo
- Down + closing
- —
- Monthly P&I
- —
- Monthly cashflow
- —
- DSCR
- —
- Eligible?
- —
Short-term bridge; refi at stabilization.
Rent comps 1 comps
| Address | Beds | Baths | Sqft | Rent | $/sqft | DOM | Units | Dist |
|---|---|---|---|---|---|---|---|---|
| 711 S Austin Ave Tulia, TX | 2.0 | 1.0 | 700 | $599 | $0.86 | 21d | 1 | 0.42mi |
Listing history 12 events
-
2026-06-18days on market $75,000 Active 13 DOM
-
2026-06-17days on market $75,000 Active 12 DOM
-
2026-06-16days on market $75,000 Active 11 DOM
-
2026-06-15days on market $75,000 Active 10 DOM
-
2026-06-15days on market $75,000 Active 9 DOM
-
2026-06-13days on market $75,000 Active 8 DOM
-
2026-06-12days on market $75,000 Active 7 DOM
-
2026-06-09days on market $75,000 Active 4 DOM
-
2026-06-08days on market $75,000 Active 3 DOM
-
2026-06-08days on market $75,000 Active 2 DOM
-
2026-06-07remarks 694-char remark
-
2026-06-07$75,000 Active 1 DOM
ⓘ Source: listings_history table (triggers on properties + properties_extension) + one-shot
backfill from property_details.listing_events for pre-trigger history.
Tax reassessment forecast TX · Resets to sale price
- Current annual tax
- $685 · $57/mo
- Projected year-2 tax
- $1,372 · $114/mo
- Expected delta
- +$687/yr (+$57/mo · 100.3%)
ⓘ Screening estimate from a state-policy table — verify with the county assessor before closing.
Climate risk First Street
- Flood 1/10 Low 0% chance over 30 yrs
- Wildfire 8/10 Severe
- Heat 4/10 Moderate 5 d/yr ≥98°F today · 14 d/yr by 30 yrs out
- Wind 2/10 Low
- Air quality 2/10 Low 1 unhealthy d/yr today · 1 by 30 yrs out
Nearby sold comps map
Loading sold comps map…
Walkable amenities ~0.75 mi
Loading nearby amenities…
Taxation est. · year 1
- Rental income
- $7,188
- − Mortgage interest
- −$4,201
- − Property taxes
- −$685
- − Insurance
- −$375
- − Repairs & maintenance
- −$575
- − Management
- −$575
- − Depreciation
- −$2,182
- Taxable loss
- −$1,405
- Est. tax savings @ 24.0%
- +$337
- After-tax cash flow
- $236/yr
For passive investors: Depreciation is non-cash, so a rental often shows a tax loss while cash-flowing — sheltering income. Rental losses are passive: they offset passive income freely, and up to $25,000/yr can offset ordinary (W-2) income if you actively participate and your MAGI is under $100k (phasing out to $0 by $150k); unused losses carry forward. On sale, claimed depreciation is recaptured at up to 25%, and gains may owe capital-gains tax (a 1031 exchange can defer both). Figures are a year-1 estimate at your 24.0% rate — not tax advice; consult a CPA.
Schools (NCES district)
- District
- Tulia ISD
- NCES district ID
- 4843320
- Math proficiency
- 22% ▼ -9.00%
- Reading proficiency
- 21% ▼ -6.00%
- Median HH income
- $36,346
- Composite
- 17.86/100
- National rank
- #9004
- State rank
- #768 of 826 in TX
Livability — Tulia
- Score
- 56/100
- State rank
- #1297
- US rank
- #22536
Category grades
Schools grade is shown separately in the Schools card above.
Census & demographics
- Census place
- Tulia, TX
- Population (ZIP)
- 5,315
Population outlook (Swisher County) Hauer SSP2
- Today (2025)
- 7,108 people
- By 2030
- 6,928 · -2.5%
- By 2040
- 6,468 · -9.0%
- By 2050
- 6,017 · -15.3%
- By 2075
- 4,875 · -31.4%
- By 2100
- 3,447 · -51.5%
Race, ethnicity, and origin ACS 2023
- Neighborhood character
- Diverse neighborhood (Simpson 0.64)
- Race & ethnicity
- Hispanic / Latino 45% White 39% Two or more races 16% Black 10%
- Hispanic origin (detail)
- Mexican 39%
- Common ancestry
- Romanian 1% Slovak 1%
- Foreign-born
- 9% · Canada
- Languages at home
- 71% English-only · Spanish 29%
Political lean MEDSL · Swisher
- 2024 margin
- Solid R (+63.5) · D 17.8% · R 81.2%
- 2008→2024 swing
- -29.1pp toward R · 2008: -34.3pp · 2024: -63.5pp
- All cycles
- 2024: R+63.5 2020: R+58.0 2016: R+55.2 2012: R+47.5 2008: R+34.3
Not yet ingested
- Civics
- —
Market trends
- HPI YoY
- ▲ 1.26%
- Current HPI
- 158.3302
- Rent YoY
- —
- Metro
- —
- State GDP YoY
- ▲ 3.95%
- F500 in state
- 110
Industry mix (Fortune 500 HQ in TX)
| Industry | F500 HQs | Revenue |
|---|---|---|
| Energy | 16 | $1,198B |
|
||
| Technology | 5 | $198B |
|
||
| Engineering / Construction | 4 | $72B |
|
||
| Energy Services | 3 | $60B |
|
||
| Utilities | 3 | $41B |
|
||
| Healthcare | 2 | $330B |
|
||
Price history
1 event — show timeline
- 2026-06-05 Listed $75,000 AARMLS
Property tax history
+15.0%/yrLatest (2025): $685 · +9.4% YoY. Source: county tax records.
Cash-flow waterfall
monthlySold comps — $/sqft
last 12 mo · ≤1 miLoading sold comps…