 Triplex
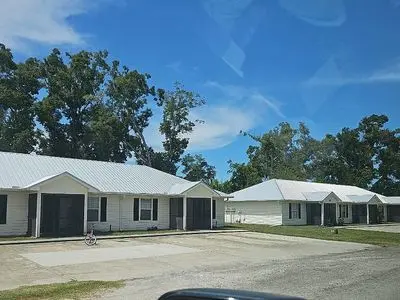
1439 N Paris St · Bell, FL
Flood risk 1/10 · Minimal
- FEMA flood zone
- X (unshaded)
- Chance of flooding over 30 yrs
- 0.0%
- Est. flood insurance / yr
- $507 – $1,088
Fire risk 7/10 · Major
- Est. fire insurance / yr
- $947 – $1,759
Heat risk 8/10 · Major
- Hot days now (above 108°F)
- 7 days/yr
- Hot days in 30 yrs
- 21 days/yr
Wind risk 9/10 · Severe
- Chance of severe wind over 30 yrs
- 99.0%
Air-quality risk 3/10 · Minor
- Unhealthy air days now
- 3 days/yr
- Unhealthy air days in 30 yrs
- 3 days/yr
Risk factors via First Street. Map © Google.
Why this score? — see what drove the D- grade
The composite is a weighted blend of 9 inputs, each scored 0–100. Each bar is that input's sub-score; the figure is the points it added to the 100-point composite (weight × sub-score).
- Appreciation +10.0/10.0
- ARV discount +7.5/15.0
- Schools +5.3/10.0
- Cash flow +4.9/30.0
- Livability +3.1/5.0
- Rent growth +2.5/5.0
- Condition / age +2.5/5.0
- 1% rule +0.0/10.0
- DSCR +0.0/10.0
$999,999
🖨 Deal sheet (PDF) 📄 Offer letter ✓ Due diligence
Multi-family units
County records classify this as Multi-Family (2-4 Unit). Listing-text estimate: 3 units. confirmed
Listing remarks MLS
EXCELLENT OPPORTUNITY located in Bell, Florida. Convenient location for families! Located next door to the park, in town for shopping and dining, and within walking distance to the public schools. Two buildings on 1.1 acres with a paved road and parking. All of the apartments are currently occupied and consist of a strong rental history. Each apartment is 2 bedroom/2 bathroom with an open floorplan and a private well.
Key facts
- Large kitchens
- Multi family 6 plex
- Living room
Tags
Neighborhood map
What this means for you Summary
Snapshot
- This is a 3 × 1-bed/?-bath units multifamily listed at $1000k.
Deal economics
- At list price, monthly cash flow is $-2k ($-29k/yr) — negative. Per door: $-793/mo.
- To cash-flow at today's rent, offer at most $580k (42.0% below list).
- To meet the 1% rule (rent ≥ 1% of price), the offer needs to be $493k (50.7% below list).
- Recommended offer: $493k (50.7% below list) — sets the bar for 1% rule.
- Cap rate 3.4% vs local median 4.9% in Bell — below-typical yield; the buyer is paying a premium for something (appreciation thesis, condition, location) that the cap rate doesn't capture.
Location & tenants
- Location reads 62/100 on livability (#767 in FL) — a middle-class / working-renter tenant base. Strengths: cost of living A+, housing A+; Watch: crime D, health & safety D, amenities F.
- Gilchrist (rural): math 66% / reading 61% proficiency, ranked #9 of 73 in FL (top 12%) — acceptable for families but not a draw, mixed tenant base, ~2y average lease.
- Zoned schools: Bell Elementary School (math 71% / reading 60%, grade B+, #500 of 2,144 statewide, top 24%, 661 students, 58% FRL).
- Market conditions: 112 active listings in the ZIP; 1 comparable units currently listed for rent nearby; 94 units permitted in Gilchrist County in 2024 (0 in 5+ unit buildings).
Forward outlook
- In year one you build about $107k of equity ($7k loan paydown + $100k appreciation (10.0% local appreciation)).
- Gilchrist County population projected to shrink 6% by 2050 — rents likely to lag national; underwrite the cash flow, not the appreciation.
- By year 2, paydown + projected appreciation supports a ~$171k cash-out refi (75% LTV) — recoverable capital for the next deal without selling this one.
Negotiation context
- It's been on market 23 days — a 2% lower offer ($985k) is reasonable based on typical stale-listing flexibility.
- 4 sale attempts since 3y ago with the ask held roughly flat each time — persistent listings suggest the price (not the market) is what's stuck; bring a comps-based counter.
- Current owner paid $475k; list at $1000k implies a 111% gain — meaningful room to come down on a strong offer.
Risks & watch-outs
- Climate carrying-cost: severe wind risk, 99% chance of damaging wind over 30y; major wildfire risk; extreme-heat days projected 7→21/yr by 2055 (HVAC capex compounding) — expect insurance premiums to compound above CPI over the hold.
Questions for the listing agent
- What do current leases actually rent for vs. the listed asking? Can we see a recent rent roll and the last 12 months of T-12 income?
- Can we see the unit-by-unit rent roll, current vacancy, and any below-market leases? What's the average tenancy length?
- What capital expenditures (roof, boiler, parking lot, exteriors) have been made in the last 5 years, and what's planned in the next 2?
- Is there a deadline driving the sale (1031 exchange, divorce, estate, relocation)? That informs how much negotiation room exists.
- Crime grade is D in this area — have there been break-ins, vandalism, or insurance claims at this property in the last 3 years? What carrier currently insures it and at what premium?
- The area grade is low — what's the realistic commute time and amenity access for the typical tenant pool here? Any planned neighborhood developments (good or bad) we should know about?
- What's the average days-on-market for RENTAL listings here right now (not sales)? A rising rental-DOM trend means longer vacancies and softer asking-rent achievability than the comps imply.
- What's the recent tenant-quality profile in this submarket — average credit score on applications, eviction rate, late-payment / NSF rate, and stable-employment percentage? A property-management company in the area should have these aggregated.
- How much new apartment / multifamily construction is in the pipeline within 1–3 miles? Heavy new supply (>2% of stock underway) typically softens rents 12–24 months out; light construction supports rent growth.
Investment metrics
- 1% rule
- 0.49% ✗
- Cap rate
- 3.44%
- Cash-on-cash
- -10.19%
- DSCR
- 0.55
- GRM
- 16.9
CMA / ARV
No comps found within radius.
Projected returns pro-forma
9.98% appreciation · 3.0% rent growth · sell at horizon
- IRR
- 17.1%
- Equity multiple
- 2.40×
- Total profit
- $391,214
- Equity at exit
- $899,108
- IRR
- 16.2%
- Equity multiple
- 5.54×
- Total profit
- $1,270,052
- Equity at exit
- $1,937,078
Cash invested: $280,000 (down + closing). Projections, not guarantees.
Landlord ↔ Tenant lean methodology
- Overall (STATE)
- 87 Strongly Landlord-Friendly
- State Florida
- 87 Strongly Landlord-Friendly · R+3
- County
- — inherits STATE
- City
- — inherits STATE
ZIP-level market 32619
- Home prices YoY
- 2.5%
- Active inventory
- 112
- Price-to-rent
- 50.7×
Monthly cashflow live
- Estimated rent
- $4,928 medium interval (Pro) →
- Mortgage (P&I)
- −$5,244
- Tax from tax record
- −$610 /mo · $7,319/yr
- Insurance
- −$417
- HOA
- −$0
- Vacancy / Maint / Mgmt
- −$1,035
- Net cashflow
- $-2,378
Break-even live
Sensitivity live
| Price | -10% $-1,811 | -5% $-2,095 | +0% $-2,378 | +5% $-2,661 | +10% $-2,944 |
|---|---|---|---|---|---|
| Rent | -10% $-2,767 | -5% $-2,572 | +0% $-2,378 | +5% $-2,183 | +10% $-1,988 |
| Rate | -1.0pp $-1,874 | -0.5pp $-2,123 | base $-2,378 | +0.5pp $-2,637 | +1.0pp $-2,900 |
3-unit breakdown (identical units grouped — click to expand)
| Units | Beds | Baths | Est. rent |
|---|---|---|---|
| 3× units | 1 | — | $4,929 |
| #1 | 1 | — | $1,643 |
| #2 | 1 | — | $1,643 |
| #3 | 1 | — | $1,643 |
| Total (3 units) | $4,928 | ||
UW: 25.0% down · 7.5% · 30yr · 1.5% tax · 5.0% vac · 8.0% maint · 8.0% mgmt
Financing live
Cash to close
- Down payment
- $250,000
- Closing costs
- $30,000
- Reserves months
- —
- Total cash needed
- —
Loan-product check · same deal, 3 products live
Conventional
25% down · 7.5% · 30yr
- Down + closing
- —
- Monthly P&I
- —
- Monthly cashflow
- —
- DSCR
- —
- Eligible?
- —
Personal DTI + credit; lowest rate.
DSCR
20% down · 8.5% · 30yr
- Down + closing
- —
- Monthly P&I
- —
- Monthly cashflow
- —
- DSCR
- —
- Eligible?
- —
No personal income docs; deal must DSCR.
Hard money
10% down · 12.0% · 12mo
- Down + closing
- —
- Monthly P&I
- —
- Monthly cashflow
- —
- DSCR
- —
- Eligible?
- —
Short-term bridge; refi at stabilization.
Rent comps 1 comps
| Address | Beds | Baths | Sqft | Rent | $/sqft | DOM | Units | Dist |
|---|---|---|---|---|---|---|---|---|
| 1901 N Roberts Trl Bell, FL | 3.0 | 2.0 | 1777 | $2,300 | $1.29 | 23d | 1 | 0.53mi |
Listing history 17 events
-
2026-06-21days on market $999,999 Active 23 DOM
-
2026-06-18days on market $999,999 Active 20 DOM
-
2026-06-17days on market $999,999 Active 19 DOM
-
2026-06-16days on market $999,999 Active 18 DOM
-
2026-06-15days on market $999,999 Active 17 DOM
-
2026-06-14days on market $999,999 Active 15 DOM
-
2026-06-13days on market $999,999 Active 14 DOM
-
2026-06-10days on market $999,999 Active 12 DOM
-
2026-06-09days on market $999,999 Active 11 DOM
-
2026-06-08days on market $999,999 Active 10 DOM
-
2026-06-07days on market $999,999 Active 9 DOM
-
2026-06-05days on market $999,999 Active 6 DOM
-
2026-06-02days on market $999,999 Active 4 DOM
-
2026-06-01days on market $999,999 Active 3 DOM
-
2026-05-31days on market $999,999 Active 2 DOM
-
2026-05-30remarks 699-char remark
-
2026-05-30$999,999 Active 1 DOM
ⓘ Source: listings_history table (triggers on properties + properties_extension) + one-shot
backfill from property_details.listing_events for pre-trigger history.
Tax reassessment forecast FL · Resets to sale price
- Current annual tax
- $7,319 · $610/mo
- Projected year-2 tax
- $8,300 · $692/mo
- Expected delta
- +$981/yr (+$82/mo · 13.4%)
ⓘ Screening estimate from a state-policy table — verify with the county assessor before closing.
Climate risk First Street
- Flood 1/10 Low FEMA zone X (unshaded) · 0% chance over 30 yrs
- Wildfire 7/10 Severe
- Heat 8/10 Severe 7 d/yr ≥108°F today · 21 d/yr by 30 yrs out
- Wind 9/10 Extreme 99% chance of damaging wind over 30 yrs
- Air quality 3/10 Moderate 3 unhealthy d/yr today · 3 by 30 yrs out
Nearby sold comps map
Loading sold comps map…
Walkable amenities ~0.75 mi
Loading nearby amenities…
Taxation est. · year 1
- Rental income
- $59,136
- − Mortgage interest
- −$56,015
- − Property taxes
- −$7,319
- − Insurance
- −$5,000
- − Repairs & maintenance
- −$4,731
- − Management
- −$4,731
- − Depreciation
- −$29,091
- Taxable loss
- −$47,751
- Est. tax savings @ 24.0%
- +$11,460
- After-tax cash flow
- $-17,071/yr
For passive investors: Depreciation is non-cash, so a rental often shows a tax loss while cash-flowing — sheltering income. Rental losses are passive: they offset passive income freely, and up to $25,000/yr can offset ordinary (W-2) income if you actively participate and your MAGI is under $100k (phasing out to $0 by $150k); unused losses carry forward. On sale, claimed depreciation is recaptured at up to 25%, and gains may owe capital-gains tax (a 1031 exchange can defer both). Figures are a year-1 estimate at your 24.0% rate — not tax advice; consult a CPA.
Schools (NCES district)
- District
- Gilchrist
- NCES district ID
- 1200630
- Math proficiency
- 66% ▼ -4.00%
- Reading proficiency
- 61% ▼ -5.00%
- Median HH income
- $39,610
- Composite
- 53.01/100
- National rank
- #1522
- State rank
- #9 of 73 in FL
Livability — Bell
- Score
- 62/100
- State rank
- #767
- US rank
- #17229
Category grades
Schools grade is shown separately in the Schools card above.
Census & demographics
- Census place
- Bell, FL
- City population
- 5,227
- Population (ZIP)
- 5,227
Population outlook (Gilchrist County) Hauer SSP2
- Today (2025)
- 17,730 people
- By 2030
- 17,722 · +-0.0%
- By 2040
- 17,393 · -1.9%
- By 2050
- 16,597 · -6.4%
- By 2075
- 14,300 · -19.3%
- By 2100
- 11,498 · -35.1%
Race, ethnicity, and origin ACS 2023
- Neighborhood character
- Predominantly White (90%)
- Race & ethnicity
- White 90% Hispanic / Latino 7% Two or more races 4%
- Hispanic origin (detail)
- Mexican 3%
- Common ancestry
- Lithuanian 9% Romanian 3% Scotch-Irish 2%
- Foreign-born
- 7% · Canada
- Languages at home
- 93% English-only · Spanish 4% German/W. Germanic 2% Tagalog/Filipino 1%
Political lean MEDSL · Gilchrist
- 2024 margin
- Solid R (+68.0) · D 15.6% · R 83.6%
- 2008→2024 swing
- -21.2pp toward R · 2008: -46.8pp · 2024: -68.0pp
- All cycles
- 2024: R+68.0 2020: R+64.0 2016: R+62.8 2012: R+51.0 2008: R+46.8
Not yet ingested
- Civics
- —
Market trends
- HPI YoY
- ▲ 9.98%
- Current HPI
- 404.4164
- Rent YoY
- —
- Metro
- —
- State GDP YoY
- ▲ 3.28%
- F500 in state
- 36
Industry mix (Fortune 500 HQ in FL)
| Industry | F500 HQs | Revenue |
|---|---|---|
| Industrial Technology | 2 | $29B |
|
||
| Insurance | 2 | $17B |
|
||
| Retail | 1 | $60B |
|
||
| Technology Distribution | 1 | $58B |
|
||
| Homebuilding | 1 | $35B |
|
||
| Technology Manufacturing | 1 | $35B |
|
||
Price history
+68.1% since first listed13 events — show timeline
- 2026-05-30 Listed $999,999 FSBO.com
- 2026-01-01 Rental Removed $1,400 STELLARMLS
- 2025-11-23 Price Changed $1,400 STELLARMLS
- 2025-08-07 Listed for Rent $1,500 STELLARMLS
- 2023-09-05 Sold (Public Records) $475,000 Public Records
- 2023-08-30 Contingent — NFMLS
- 2023-08-14 Delisted — NFMLS
- 2023-08-04 Contingent — NFMLS
- 2023-08-04 Sold (MLS) $475,000 NFMLS
- 2023-07-30 Relisted — NFMLS
- 2023-07-17 Contingent — NFMLS
- 2023-07-11 Price Changed $549,000 NFMLS
- 2023-05-02 Listed $595,000 NFMLS
Property tax history
+2.0%/yrLatest (2025): $7,319 · +3.9% YoY. Source: county tax records.
Cash-flow waterfall
monthlySold comps — $/sqft
last 12 mo · ≤1 miLoading sold comps…