2510 N Tustin Unit B · Santa Ana, CA
Flood risk No data
- FEMA flood zone
- —
- Chance of flooding over 30 yrs
- —
- Est. flood insurance / yr
- —
Fire risk No data
- Est. fire insurance / yr
- —
Heat risk No data
- Hot days now (above threshold)
- —
- Hot days in 30 yrs
- —
Wind risk No data
- Chance of severe wind over 30 yrs
- —
Air-quality risk No data
- Unhealthy air days now
- —
- Unhealthy air days in 30 yrs
- —
Risk factors via First Street. Map © Google.
Why this score? — see what drove the C grade
The composite is a weighted blend of 9 inputs, each scored 0–100. Each bar is that input's sub-score; the figure is the points it added to the 100-point composite (weight × sub-score).
- Cash flow +20.4/30.0
- ARV discount +11.4/15.0
- 1% rule +7.2/10.0
- DSCR +6.5/10.0
- Schools +4.5/10.0
- Rent growth +3.4/5.0
- Livability +2.8/5.0
- Condition / age +2.5/5.0
- Appreciation +0.0/10.0
$378,000
🖨 Deal sheet (PDF) 📄 Offer letter ✓ Due diligence
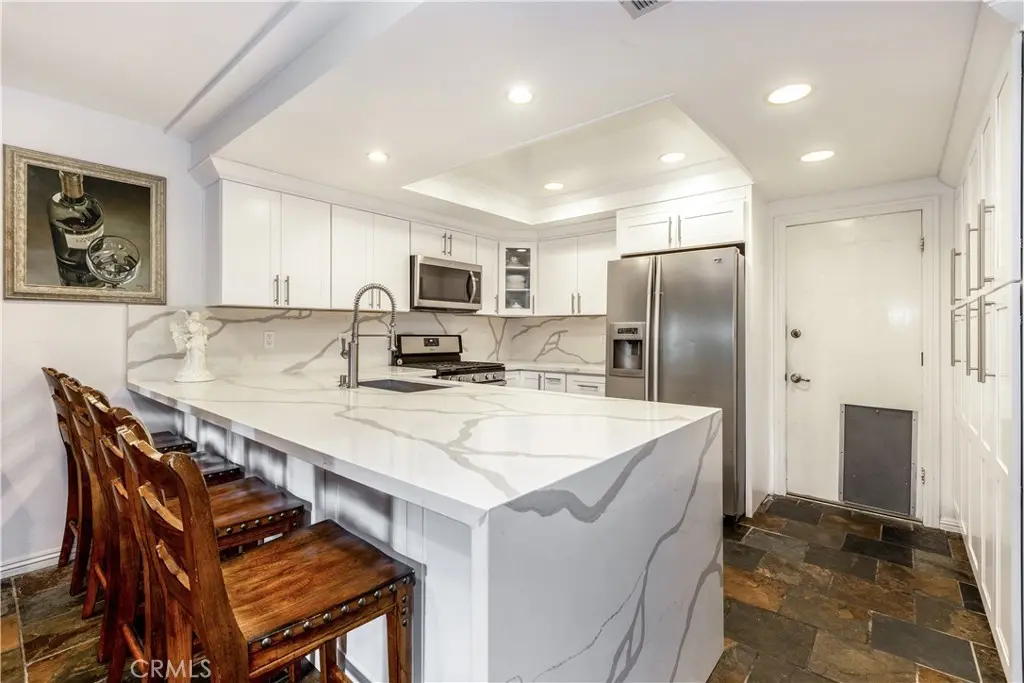
Listing remarks
Welcome to one of the largest and most private homes in the highly desirable Shady Hollow community in the heart of Orange County. This impressive 1,858 sq. ft. townhome will steal your heart! Step inside to an inviting open floor plan with the perfect blend of style and comfort, filled with natural light and vaulted ceilings. The spacious main level features a versatile den that can easily serve as a home office, guest room, or flex space, along with a beautifully remodeled guest bathroom. The expansive living and dining areas flow seamlessly into a stunning dream white kitchen, complete with quartz countertops, an oversized waterfall peninsula, abundant cabinetry, and modern finishes, per
Key facts
- $550 HOA
- 2 garage spots
- Community pool
Property features AI
Finance
- Other: Subdivision: Shady Hollow Townhomes (SHHW)
- Financial info: Land lease $1,920 monthly (renewal date May 1, 2035); Special assessments
- HOA & community: Part of Shady Hollow association; Association fee $550 monthly; Association amenities include pool, spa, clubhouse, trash, water, pets permitted, controlled access, and grounds maintenance; Community features include street lighting and storm drains; Community of about 150 units
Exterior
- Parking: Attached garage; 2 garage spaces; Guest parking; 2 total parking spaces; Accessible parking
- Security: Smoke detector; Carbon monoxide detector(s); Controlled access (association)
- Utilities: Public sewer; District/public water; Natural gas connected; Electricity connected; Sewer connected; Water connected; Cable connected; Telephone in street
- Home design: Condominium; Multi-family structure; Attached property; Two stories; Entry on level 1; Access via paved city streets
- Construction: No ADU
- Exterior features: Patio; Rear porch; Association pool
Interior
- Kitchen: Refrigerator; Ice maker; Dishwasher; Water heater unit; Kitchen island; Family kitchen / eating area
- Bedrooms: Main floor bedroom; Primary suite
- Bathrooms: 2 full bathrooms; 1 half bathroom; Bathtub; Shower-in-tub
- Heating & cooling: Central cooling; Central furnace heating
- Interior features: Balcony; Quartz counters; Recessed lighting; Open floor plan; Kitchen open to family room; Two levels; Gated community; Association spa
- Laundry & utility: Laundry in garage
Neighborhood map
What this means for you Summary
Snapshot
- This is a 4-bed/2.5-bath townhouse listed at $378k.
Deal economics
- At list price, monthly cash flow is $493 ($6k/yr) — positive.
- The deal already cash-flows at list — no discount required.
- Meets the 1% rule at list price ($5k rent vs $378k).
- Cap rate 7.9% vs local median 2.5% in Santa Ana — top-decile yield for the area; either an underpriced asset or a hidden risk that comps aren't pricing in. Stress-test before assuming the spread holds.
Location & tenants
- Location reads 55/100 on livability (#871 in CA) — a working-class tenant base; expect higher turnover. Strengths: employment A; Watch: crime D-, amenities F, commute F.
- Orange Unified (urban): math 39% / reading 60% proficiency, ranked #127 of 517 in CA (top 25%) — families likely to look elsewhere, expect single-tenant / working-renter base with shorter leases.
- Zoned schools: Fairhaven Elementary (math 24% / reading 24%, grade F, #973 of 1,571 statewide, top 73%, 445 students, 64% FRL); Portola Middle (597 students, 91% FRL); Orange High (math 19% / reading 48%, grade F, #656 of 1,170 statewide, top 57%, 1,807 students, 89% FRL) — zoned schools average 82% FRL vs 38% district-wide (43 pts higher); higher-poverty schools than district average — tighter screening recommended.
- Zoned-school proficiency averages 29% at this address vs 50% district-wide (-20 pts) — the specific schools serving this property underperform the Orange Unified average; the district grade overstates school quality for this exact location.
- Market conditions: Rents rising (+3.7%/yr); 97 active listings in the ZIP; 21 comparable units currently listed for rent nearby; rentals at typical pace (median 19d on market — plan ~3-4 weeks tenant-placement turnaround); high-income renter base; 6,974 units permitted in Orange County in 2024 (3,839 in 5+ unit buildings).
- This rent runs 43% of the median local income ($129k/yr) — at the standard rent-burdened threshold; future hikes will face affordability resistance.
Forward outlook
- Local home prices are declining (-3.0%/yr); year-one equity from $3k of loan paydown is wiped out by about $11k of value loss. Plan a longer hold.
- Orange County population projected at +14% by 2050 — modest demand growth; plan on rents tracking national, not racing it.
Negotiation context
- Only 13 days on market — expect competitive offers; lowballing is unlikely to land.
- 5 sale attempts since 26y ago with the ask held roughly flat each time — persistent listings suggest the price (not the market) is what's stuck; bring a comps-based counter.
- Current owner paid $215k; list at $378k implies a 76% gain — meaningful room to come down on a strong offer.
Questions for the listing agent
- Built in 1975 — when were the roof, HVAC, electrical panel, plumbing, and water heater last replaced?
- What does the HOA fee cover, when was the last increase, and are there any pending special assessments or reserve-fund shortfalls?
- Is there a deadline driving the sale (1031 exchange, divorce, estate, relocation)? That informs how much negotiation room exists.
- Schools are D-rated, which usually means shorter tenancies and higher turnover. Who's the typical renter profile here, and what's been the actual vacancy rate?
- Crime grade is D in this area — have there been break-ins, vandalism, or insurance claims at this property in the last 3 years? What carrier currently insures it and at what premium?
- What's the average days-on-market for RENTAL listings here right now (not sales)? A rising rental-DOM trend means longer vacancies and softer asking-rent achievability than the comps imply.
- What's the recent tenant-quality profile in this submarket — average credit score on applications, eviction rate, late-payment / NSF rate, and stable-employment percentage? A property-management company in the area should have these aggregated.
- How much new for-sale + rental construction is in the pipeline within 1–3 miles? Heavy new supply typically softens prices + rents 12–24 months out; constrained supply supports both.
Investment metrics
- 1% rule
- 1.22% ✓
- Cap rate
- 7.86%
- Cash-on-cash
- 5.59%
- DSCR
- 1.25
- GRM
- 6.8
CMA / ARV
- ARV (on-the-fly)
- $414,334
- Comps found
- 7
Show comp detail 7 sales within ~0.75 mi
| Address | Dist | Beds/Ba | Sqft | Sold | Price | $/sf | Match |
|---|---|---|---|---|---|---|---|
| 2510 N Tustin Avenue Ave #110 | 0.00mi | 3/2.5 (-1) | 1,858 (0%) | 10mo | $424,999 | $229 | 86 |
| 2622 N Tustin Ave Unit (147) | 0.19mi | 3/2.5 (-1) | 1,858 (0%) | 10mo | $340,000 | $183 | 78 |
| 2518 N Tustin Ave Unit E | 0.10mi | 4/2.5 | 1,617 (-13%) | 4mo | $360,000 | $223 | 70 |
| 2520 N Tustin Unit B | 0.10mi | 5/3.0 (+1) | 1,679 (-10%) | 3mo | $460,000 | $274 | 70 |
| 2518 N Tustin #81 | 0.10mi | 4/2.5 | 1,679 (-10%) | 13mo | $365,000 | $217 | 68 |
| 2604 N Tustin Ave #49 | 0.11mi | 3/2.5 (-1) | 1,617 (-13%) | 10mo | $349,000 | $216 | 60 |
| 2620 N Tustin Ave #42 | 0.14mi | 3/2.5 (-1) | 1,617 (-13%) | 15mo | $368,000 | $228 | 54 |
Match score weights: distance 35% · size 25% · config 20% · recency 20%. Top-matched comps best support the ARV.
Projected returns pro-forma
-3.0% appreciation · 3.72% rent growth · sell at horizon
- IRR
- -6.6%
- Equity multiple
- 0.75×
- Total profit
- $-26,059
- Equity at exit
- $56,361
- IRR
- 4.2%
- Equity multiple
- 1.32×
- Total profit
- $33,468
- Equity at exit
- $32,683
Cash invested: $105,840 (down + closing). Projections, not guarantees.
Landlord ↔ Tenant lean methodology
- Overall (STATE)
- 18 Strongly Tenant-Friendly
- State California
- 18 Strongly Tenant-Friendly · D+13
- County
- — inherits STATE
- City
- — inherits STATE
ZIP-level market 92705
- Rents YoY
- 3.7%
- Active inventory
- 97
- Price-to-rent
- 6.8×
Monthly cashflow live
- Estimated rent
- $4,627 high interval (Pro) →
- Mortgage (P&I)
- −$1,982
- Tax est. 1.5%
- −$472 /mo · $5,670/yr
- Insurance
- −$158
- HOA
- −$550
- Vacancy / Maint / Mgmt
- −$972
- Net cashflow
- $493
Break-even live
Sensitivity live
| Price | -10% $754 | -5% $624 | +0% $493 | +5% $363 | +10% $232 |
|---|---|---|---|---|---|
| Rent | -10% $128 | -5% $310 | +0% $493 | +5% $676 | +10% $859 |
| Rate | -1.0pp $684 | -0.5pp $589 | base $493 | +0.5pp $395 | +1.0pp $296 |
UW: 25.0% down · 7.5% · 30yr · 1.5% tax · 5.0% vac · 8.0% maint · 8.0% mgmt
Financing live
Cash to close
- Down payment
- $94,500
- Closing costs
- $11,340
- Reserves months
- —
- Total cash needed
- —
Loan-product check · same deal, 3 products live
Conventional
25% down · 7.5% · 30yr
- Down + closing
- —
- Monthly P&I
- —
- Monthly cashflow
- —
- DSCR
- —
- Eligible?
- —
Personal DTI + credit; lowest rate.
DSCR
20% down · 8.5% · 30yr
- Down + closing
- —
- Monthly P&I
- —
- Monthly cashflow
- —
- DSCR
- —
- Eligible?
- —
No personal income docs; deal must DSCR.
Hard money
10% down · 12.0% · 12mo
- Down + closing
- —
- Monthly P&I
- —
- Monthly cashflow
- —
- DSCR
- —
- Eligible?
- —
Short-term bridge; refi at stabilization.
Rent comps 21 comps
| Address | Beds | Baths | Sqft | Rent | $/sqft | DOM | Units | Dist |
|---|---|---|---|---|---|---|---|---|
| 2215 E Avalon Ave Santa Ana, CA | 3.0 | 2.0 | 1315 | $1,400 | $1.06 | 45d | 1 | 0.41mi |
| 2210 E Avalon Ave Unit 2210 Santa Ana, CA | 3.0 | 2.0 | 1325 | $3,800 | $2.87 | 45d | 1 | 0.43mi |
| 2210 E Avalon Ave Santa Ana, CA | 3.0 | 2.0 | 1325 | $3,750 | $2.83 | 1d | 1 | 0.43mi |
| 1047 E Tularosa Ave Orange, CA | 3.0 | 2.0 | 1745 | $4,500 | $2.58 | 1d | 1 | 0.67mi |
| 335 S California St Orange, CA | 5.0 | 3.0 | 2600 | $7,000 | $2.69 | 0d | 1 | 0.87mi |
| 1600 Mabury St Santa Ana, CA | 3.0 | 2.0 | 1480 | $3,595 | $2.43 | 45d | 1 | 0.92mi |
| 328 S Wheeler Pl Orange, CA | 4.0 | 2.0 | 2265 | $4,500 | $1.99 | 45d | 1 | 1.15mi |
| 408 W La Veta Ave Orange, CA | 3.0 | 2.0 | 1439 | $4,000 | $2.78 | 45d | 1 | 1.25mi |
| 401 W La Veta Ave Orange, CA | 2.0–3.0 | 2.0–2.5 | 1152 | $3,695 | $3.21 | 12d | 6 | 1.28mi |
| 181 N Waverly St Orange, CA | 3.0 | 2.0 | 1522 | $4,900 | $3.22 | 45d | 1 | 1.30mi |
| 1710 E Fruit St Santa Ana, CA | 3.0 | 2.0 | 2000 | $4,200 | $2.10 | 26d | 1 | 1.30mi |
| 2737 Burly Ave Orange, CA | 4.0 | 3.0 | 2062 | $5,750 | $2.79 | 45d | 1 | 1.31mi |
| 850 W Town and Country Rd Orange, CA | 3.0 | 1.0–2.0 | 1008 | $4,382 | $4.35 | 0d | 21 | 1.35mi |
| 2311 Valencia St Santa Ana, CA | 3.0 | 2.0 | 1422 | $4,500 | $3.16 | 1d | 1 | 1.43mi |
| 283 N Highland St Orange, CA | 5.0 | 2.0 | 1827 | $6,100 | $3.34 | 21d | 1 | 1.44mi |
| 1000 W Town and Country Rd Orange, CA | 3.0 | 1.0–2.0 | 1008 | $4,530 | $4.49 | 1d | 27 | 1.46mi |
| 345 N Shattuck Pl Orange, CA | 3.0 | 2.0 | 1421 | $4,995 | $3.52 | 1d | 1 | 1.47mi |
| 345 N Shattuck Pl Orange, CA | 3.0 | 1.5 | 1434 | $5,195 | $3.62 | 19d | 1 | 1.47mi |
| 250 N Cleveland St Orange, CA | 3.0 | 1.0 | 1280 | $4,500 | $3.52 | 21d | 1 | 1.47mi |
| 1055 W Town and Country Rd Orange, CA | 1.0–3.0 | 1.0–2.0 | 1069 | $4,300 | $4.02 | 0d | 1 | 1.47mi |
| 191 N Grand St Orange, CA | 4.0 | 2.0 | 1591 | $5,500 | $3.46 | 14d | 1 | 1.47mi |
HOA detail
- Monthly dues
- $550 · $6,600/yr
- Likely covers
- water
Listing history 12 events
-
2026-06-21days on market $378,000 Active 13 DOM
-
2026-06-18days on market $378,000 Active 10 DOM
-
2026-06-17days on market $378,000 Active 9 DOM
-
2026-06-16days on market $378,000 Active 8 DOM
-
2026-06-15pricedays on market $378,000 Active 7 DOM
-
2026-06-13days on market $405,000 Active 5 DOM
-
2026-06-13days on market $405,000 Active 4 DOM
-
2026-06-08statusdays on market $405,000 Active 1 DOM
-
2026-06-07days on market $405,000 Coming Soon 5 DOM
-
2026-06-04days on market $405,000 Coming Soon 2 DOM
-
2026-06-03remarks 699-char remark
-
2026-06-03$405,000 Coming Soon 1 DOM
ⓘ Source: listings_history table (triggers on properties + properties_extension) + one-shot
backfill from property_details.listing_events for pre-trigger history.
Nearby sold comps map
Loading sold comps map…
Walkable amenities ~0.75 mi
Loading nearby amenities…
Taxation est. · year 1
- Rental income
- $55,526
- − Mortgage interest
- −$21,174
- − Property taxes
- −$5,670
- − Insurance
- −$1,890
- − Repairs & maintenance
- −$4,442
- − Management
- −$4,442
- − HOA
- −$6,600
- − Depreciation
- −$10,996
- Taxable income
- $311
- Est. tax owed @ 24.0%
- −$75
- After-tax cash flow
- $5,843/yr
For passive investors: Depreciation is non-cash, so a rental often shows a tax loss while cash-flowing — sheltering income. Rental losses are passive: they offset passive income freely, and up to $25,000/yr can offset ordinary (W-2) income if you actively participate and your MAGI is under $100k (phasing out to $0 by $150k); unused losses carry forward. On sale, claimed depreciation is recaptured at up to 25%, and gains may owe capital-gains tax (a 1031 exchange can defer both). Figures are a year-1 estimate at your 24.0% rate — not tax advice; consult a CPA.
Schools (NCES district)
- District
- Orange Unified
- NCES district ID
- 0628650
- Math proficiency
- 39% ▼ -6.00%
- Reading proficiency
- 60% ▲ 3.00%
- Median HH income
- $83,557
- Composite
- 45.5/100
- National rank
- #2609
- State rank
- #127 of 517 in CA
Livability — Santa Ana
- Score
- 55/100
- State rank
- #871
- US rank
- #23502
Category grades
Schools grade is shown separately in the Schools card above.
Census & demographics
- Census place
- Santa Ana, CA
- County
- Orange County · 3,096,323 people
- City population
- 288,255
- Metro
- Los Angeles-Long Beach-Anaheim, CA
- Population (ZIP)
- 48,781
- Household income
- $129,331
- Rent vs Own
- Severe rent burden
- 1962.0
Population outlook (Orange County) Hauer SSP2
- Today (2025)
- 3,477,456 people
- By 2030
- 3,613,117 · +3.9%
- By 2040
- 3,835,945 · +10.3%
- By 2050
- 3,968,736 · +14.1%
- By 2075
- 4,097,053 · +17.8%
- By 2100
- 3,903,633 · +12.3%
Race, ethnicity, and origin ACS 2023
- Neighborhood character
- Diverse neighborhood (Simpson 0.64)
- Race & ethnicity
- Hispanic / Latino 48% White 34% Two or more races 17% Asian 11% Black 1%
- Hispanic origin (detail)
- Mexican 42%
- Common ancestry
- Lithuanian 2% Italian 1% Romanian 1%
- Foreign-born
- 25% · Canada, Vietnam, China
- Languages at home
- 53% English-only · Spanish 36% Other Indo-European 3% Chinese 2%
Political lean MEDSL · Orange
- 2024 margin
- Toss-up / Even · D 49.7% · R 47.1% · Other 3.2%
- 2008→2024 swing
- +5.2pp toward D · 2008: -2.6pp · 2024: 2.6pp
- All cycles
- 2024: D+2.6 2020: D+9.0 2016: D+7.7 2012: R+8.3 2008: R+2.6
Not yet ingested
- Civics
- —
Market trends
- HPI YoY
- ▼ -831.43%
- Current HPI
- 453.5303
- Rent YoY
- ▲ 3.72%
- Metro
- Los Angeles-Long Beach-Anaheim, CA
- State GDP YoY
- ▲ 3.21%
- F500 in state
- 116
Industry mix (Fortune 500 HQ in CA)
| Industry | F500 HQs | Revenue |
|---|---|---|
| Technology | 27 | $1,492B |
|
||
| Financial Services | 3 | $174B |
|
||
| Retail | 3 | $44B |
|
||
| Insurance | 3 | $26B |
|
||
| Media / Entertainment | 2 | $115B |
|
||
| Pharmaceuticals / Biotech | 2 | $62B |
|
||
Price history
+84.9% since first listed11 events — show timeline
- 2026-06-03 Coming Soon $405,000 CRMLS
- 2025-09-17 Listing Removed — CRMLS
- 2025-09-13 Coming Soon — CRMLS
- 2021-11-09 Listed $375,000 CRMLS
- 2021-11-09 Coming Soon — CRMLS
- 2021-10-18 Relisted — CRMLS
- 2021-08-18 Listed $375,000 CRMLS
- 2007-02-02 Listing Removed — CRMLS
- 2006-04-24 Listed $429,900 CRMLS
- 2000-10-30 Sold (MLS) $215,000 CRMLS
- 2000-09-18 Listed $219,000 CRMLS
Cash-flow waterfall
monthlySold comps — $/sqft
last 12 mo · ≤1 miLoading sold comps…