112 Darcus Ln · Asheville, NC
Flood risk 1/10 · Minimal
- FEMA flood zone
- X (unshaded)
- Chance of flooding over 30 yrs
- 0.0%
- Est. flood insurance / yr
- $507 – $1,088
Fire risk 4/10 · Minor
- Est. fire insurance / yr
- $906 – $1,684
Heat risk 3/10 · Minor
- Hot days now (above 98°F)
- 7 days/yr
- Hot days in 30 yrs
- 19 days/yr
Wind risk 2/10 · Minimal
- Chance of severe wind over 30 yrs
- —
Air-quality risk 3/10 · Minor
- Unhealthy air days now
- 2 days/yr
- Unhealthy air days in 30 yrs
- 2 days/yr
Risk factors via First Street. Map © Google.
Why this score? — see what drove the C- grade
The composite is a weighted blend of 9 inputs, each scored 0–100. Each bar is that input's sub-score; the figure is the points it added to the 100-point composite (weight × sub-score).
- Cash flow +15.0/30.0
- ARV discount +15.0/15.0
- DSCR +4.6/10.0
- Schools +4.0/10.0
- Livability +3.6/5.0
- 1% rule +3.0/10.0
- Rent growth +3.0/5.0
- Condition / age +2.5/5.0
- Appreciation +0.0/10.0
$249,000
🖨 Deal sheet (PDF) 📄 Offer letter ✓ Due diligence
Listing remarks
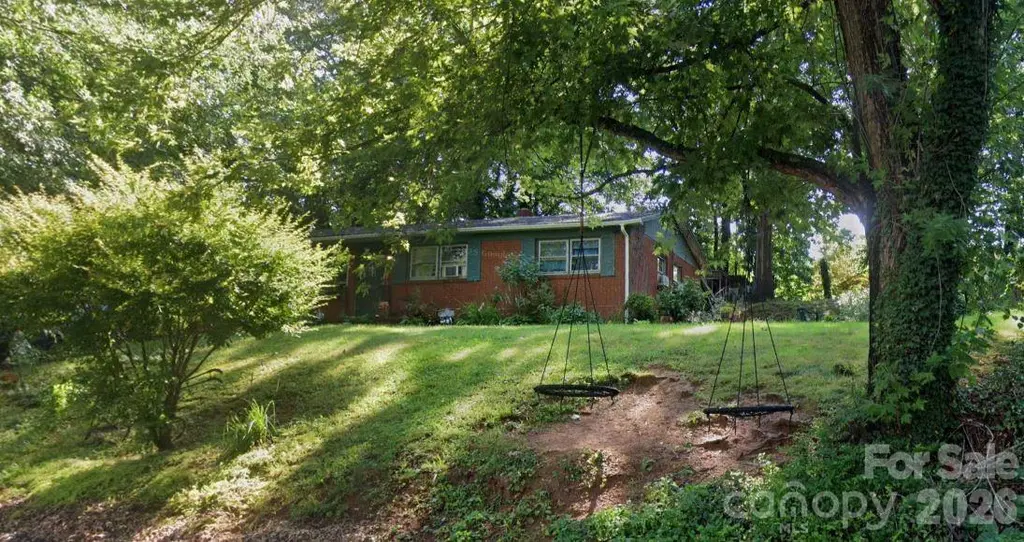
Opportunity meets location at this 1967 mid-century brick ranch just minutes from downtown Asheville. Situated on an elevated . 26-acre homesite, this 3-bedroom, 1-bath home offers hardwood floors, a practical single-level layout, and plenty of potential for those looking to personalize a property rather than pay for someone else's updates. The setting is a pleasant surprise. Adjacent to Estelle Park, residents enjoy nearby access to community green space, a playground, and a dog park while remaining conveniently close to downtown dining, shopping, and entertainment. The sloping lot provides elevation from the street and a usable rear yard with room for gardening, recreation, or outdoor liv
Key facts
- 0.26 acre lot
- Parking
- Built 1967
Property features AI
Finance
- Other: Lot is approximately 0.26 acres (hilly and wooded); Lot dimensions roughly 103 x 588 x 186 x 737; Roads are concrete/paved and publicly maintained; Property classified as residential; No multi-unit restrictions (N/A)
- HOA & community: Not subject to HOA dues
Exterior
- Parking: Driveway and on-street parking; Open parking for 3 vehicles; Carport with 1 space
- Security: Carbon monoxide detectors; Smoke detectors
- Utilities: City water; Public sewer; Electricity connected; Cable available
- Home design: Single family residence; Site-built construction; One story; RS8 / R-3 zoning; Facing/Elevation approximately 2000
- Construction: Partial brick exterior; Composition roof; Crawl space foundation; Built on site (site built)
- Exterior features: Patio; Back yard fencing (partial)
Interior
- Kitchen: Electric range; Refrigerator
- Bedrooms: Three bedrooms (all on the main level)
- Flooring: Tile flooring; Wood flooring
- Bathrooms: One full bathroom (main level)
- Heating & cooling: Electric heating; Propane heating; Window air conditioning units
- Interior features: Seven total rooms; Storm windows; Storm doors
- Laundry & utility: Laundry located in the kitchen
Neighborhood map
What this means for you Summary
Snapshot
- This is a 3-bed/1.0-bath single-family listed at $249k.
Deal economics
- At list price, monthly cash flow is $78 ($935/yr) — positive.
- The deal already cash-flows at list — no discount required.
- To meet the 1% rule (rent ≥ 1% of price), the offer needs to be $199k (20.2% below list).
- Recommended offer: $199k (20.2% below list) — sets the bar for 1% rule.
- Cap rate 6.7% vs local median 2.5% in Asheville — top-decile yield for the area; either an underpriced asset or a hidden risk that comps aren't pricing in. Stress-test before assuming the spread holds.
Location & tenants
- Location reads 72/100 on livability (#96 in NC) — a middle-class / working-renter tenant base. Strengths: commute A+, health & safety A+, housing A-; Watch: crime F.
- Buncombe County Schools (suburban): math 45% / reading 50% proficiency, ranked #72 of 178 in NC (top 40%) — families likely to look elsewhere, expect single-tenant / working-renter base with shorter leases.
- Zoned schools: Johnston Elementary (math 12% / reading 17%, grade F, #1,331 of 1,410 statewide, top 96%, 203 students, 98% FRL); Erwin Middle (math 37% / reading 37%, grade F, #262 of 475 statewide, top 57%, 568 students, 74% FRL); Erwin High (math 52% / reading 49%, grade D+, #306 of 535 statewide, top 57%, 1,096 students, 64% FRL) — zoned schools average 79% FRL vs 47% district-wide (31 pts higher); higher-poverty schools than district average — tighter screening recommended.
- Zoned-school proficiency averages 34% at this address vs 48% district-wide (-14 pts) — the specific schools serving this property underperform the Buncombe County Schools average; the district grade overstates school quality for this exact location.
- Market conditions: Rents rising (+2.1%/yr); 333 active listings in the ZIP; 20 comparable units currently listed for rent nearby; rentals at typical pace (median 25d on market — plan ~3-4 weeks tenant-placement turnaround); 3,305 units permitted in Buncombe County in 2024 (1,855 in 5+ unit buildings).
- This rent runs 38% of the median local income ($63k/yr) — at the standard rent-burdened threshold; future hikes will face affordability resistance.
Forward outlook
- Local home prices are declining (-3.0%/yr); year-one equity from $2k of loan paydown is wiped out by about $7k of value loss. Plan a longer hold.
- Buncombe County population projected at +24% by 2050 — long-run rental-demand tailwind backs the buy-and-hold thesis.
Negotiation context
- Only 9 days on market — expect competitive offers; lowballing is unlikely to land.
- Current owner paid $72k; list at $249k implies a 246% gain — meaningful room to come down on a strong offer.
Questions for the listing agent
- Built in 1967 — when were the roof, HVAC, electrical panel, plumbing, and water heater last replaced?
- Is there a deadline driving the sale (1031 exchange, divorce, estate, relocation)? That informs how much negotiation room exists.
- Schools are B-rated — typically a magnet for longer-tenancy family renters. What's the average tenant stay here, and is there a school-zone premium baked into asking?
- Crime grade is F in this area — have there been break-ins, vandalism, or insurance claims at this property in the last 3 years? What carrier currently insures it and at what premium?
- What's the average days-on-market for RENTAL listings here right now (not sales)? A rising rental-DOM trend means longer vacancies and softer asking-rent achievability than the comps imply.
- What's the recent tenant-quality profile in this submarket — average credit score on applications, eviction rate, late-payment / NSF rate, and stable-employment percentage? A property-management company in the area should have these aggregated.
- How much new for-sale + rental construction is in the pipeline within 1–3 miles? Heavy new supply typically softens prices + rents 12–24 months out; constrained supply supports both.
Investment metrics
- 1% rule
- 0.80% ✗
- Cap rate
- 6.67%
- Cash-on-cash
- 1.34%
- DSCR
- 1.06
- GRM
- 10.4
CMA / ARV
- ARV (on-the-fly)
- $316,000
- Comps found
- 12
Show comp detail 12 sales within ~0.75 mi
| Address | Dist | Beds/Ba | Sqft | Sold | Price | $/sf | Match |
|---|---|---|---|---|---|---|---|
| 186 Johnston Blvd | 0.29mi | 2/1.5 (-1) | 941 (-6%) | 3mo | $297,500 | $316 | 67 |
| 4 La Rue St | 0.34mi | 3/1.0 | 920 (-8%) | 6mo | $215,000 | $234 | 66 |
| 4 Merlin Way | 0.47mi | 3/1.5 | 1,057 (+6%) | 7mo | $330,000 | $312 | 61 |
| 21 Cedar Hill Cir | 0.64mi | 3/1.5 | 991 (-1%) | 10mo | $330,000 | $333 | 58 |
| 50 Huffman Rd | 0.61mi | 3/1.0 | 915 (-8%) | 4mo | $225,000 | $246 | 54 |
| 9 Guinevere Ct | 0.50mi | 3/1.5 | 1,108 (+11%) | 4mo | $325,000 | $293 | 53 |
| 10 Harrisland Dr | 0.53mi | 2/2.0 (-1) | 931 (-7%) | 3mo | $342,500 | $368 | 52 |
| 24 Evelake Dr | 0.66mi | 3/1.5 | 1,062 (+6%) | 6mo | $355,000 | $334 | 52 |
| 88 Ivanhoe Ave | 0.74mi | 3/1.0 | 906 (-9%) | 1mo | $385,000 | $425 | 49 |
| 60 Huffman Rd | 0.65mi | 3/2.0 | 1,097 (+10%) | 1mo | $355,000 | $324 | 49 |
| 61 Huffman Rd | 0.63mi | 2/1.0 (-1) | 910 (-9%) | 3mo | $275,000 | $302 | 48 |
| 6 Deaver Park Cir | 0.60mi | 3/2.0 | 1,144 (+14%) | 3mo | $274,000 | $240 | 41 |
Match score weights: distance 35% · size 25% · config 20% · recency 20%. Top-matched comps best support the ARV.
Projected returns pro-forma
-3.0% appreciation · 2.06% rent growth · sell at horizon
- IRR
- -15.1%
- Equity multiple
- 0.46×
- Total profit
- $-37,357
- Equity at exit
- $37,127
- IRR
- -8.1%
- Equity multiple
- 0.51×
- Total profit
- $-34,083
- Equity at exit
- $21,529
Cash invested: $69,720 (down + closing). Projections, not guarantees.
Landlord ↔ Tenant lean methodology
- Overall (STATE)
- 85 Strongly Landlord-Friendly
- State North Carolina
- 85 Strongly Landlord-Friendly · R+3
- County
- — inherits STATE
- City
- — inherits STATE
ZIP-level market 28806
- Rents YoY
- 2.1%
- Active inventory
- 333
- Price-to-rent
- 10.4×
Monthly cashflow live
- Estimated rent
- $1,987 high interval (Pro) →
- Mortgage (P&I)
- −$1,306
- Tax from tax record
- −$82 /mo · $985/yr
- Insurance
- −$104
- HOA
- −$0
- Vacancy / Maint / Mgmt
- −$417
- Net cashflow
- $78
Break-even live
Sensitivity live
| Price | -10% $219 | -5% $148 | +0% $78 | +5% $7 | +10% $-63 |
|---|---|---|---|---|---|
| Rent | -10% $-79 | -5% $-1 | +0% $78 | +5% $156 | +10% $235 |
| Rate | -1.0pp $203 | -0.5pp $141 | base $78 | +0.5pp $13 | +1.0pp $-52 |
UW: 25.0% down · 7.5% · 30yr · 1.5% tax · 5.0% vac · 8.0% maint · 8.0% mgmt
Financing live
Cash to close
- Down payment
- $62,250
- Closing costs
- $7,470
- Reserves months
- —
- Total cash needed
- —
Loan-product check · same deal, 3 products live
Conventional
25% down · 7.5% · 30yr
- Down + closing
- —
- Monthly P&I
- —
- Monthly cashflow
- —
- DSCR
- —
- Eligible?
- —
Personal DTI + credit; lowest rate.
DSCR
20% down · 8.5% · 30yr
- Down + closing
- —
- Monthly P&I
- —
- Monthly cashflow
- —
- DSCR
- —
- Eligible?
- —
No personal income docs; deal must DSCR.
Hard money
10% down · 12.0% · 12mo
- Down + closing
- —
- Monthly P&I
- —
- Monthly cashflow
- —
- DSCR
- —
- Eligible?
- —
Short-term bridge; refi at stabilization.
Rent comps 20 comps
| Address | Beds | Baths | Sqft | Rent | $/sqft | DOM | Units | Dist |
|---|---|---|---|---|---|---|---|---|
| 24 Rhudy Rd Unit 2 Asheville, NC | 2.0 | 2.5 | 1200 | $1,950 | $1.62 | 25d | 1 | 0.61mi |
| 26 Rhudy Rd Unit 1 Asheville, NC | 2.0 | 2.5 | 1260 | $1,990 | $1.58 | 15d | 1 | 0.62mi |
| 34 Rhudy Rd Unit A Asheville, NC | 2.0 | 1.0 | 1100 | $1,795 | $1.63 | 45d | 1 | 0.64mi |
| 331 Hi Alta Ave Asheville, NC | 3.0 | 1.0 | 960 | $1,995 | $2.08 | 15d | 1 | 0.67mi |
| 2 Jacob Ln Asheville, NC | 2.0 | 2.0 | 1120 | $2,200 | $1.96 | 45d | 1 | 0.77mi |
| 1 Canteberi Ct Asheville, NC | 1.0–2.0 | 1.0 | 799 | $1,450 | $1.81 | 45d | 1 | 0.79mi |
| 510 Deaverview Rd Asheville, NC | 2.0 | 2.0 | 1227 | $1,800 | $1.47 | 25d | 1 | 0.80mi |
| 99 Ascension Dr Asheville, NC | 1.0–3.0 | 1.0–2.0 | 1008 | $1,624 | $1.61 | 15d | 17 | 0.82mi |
| 85 Aurora Vista Dr Asheville, NC | 4.0 | 2.0 | 1200 | $2,850 | $2.38 | 45d | 1 | 0.97mi |
| 2 Evergreen Ave Asheville, NC | 3.0 | 1.0 | 1016 | $1,595 | $1.57 | 15d | 1 | 0.99mi |
| 11 Shadowlawn Dr Asheville, NC | 3.0 | 2.0 | 1410 | $2,250 | $1.60 | 45d | 1 | 1.02mi |
| 16 Evergreen Ave Unit B Asheville, NC | 3.0 | 2.0 | 1200 | $1,865 | $1.55 | 45d | 1 | 1.07mi |
| 16 Evergreen Ave Unit A Asheville, NC | 3.0 | 2.0 | 1200 | $1,795 | $1.50 | 25d | 1 | 1.07mi |
| 29 Evergreen Ave Asheville, NC | 3.0 | 1.0 | 981 | $1,695 | $1.73 | 25d | 1 | 1.07mi |
| 13 Rolos Way Unit 13 Asheville, NC | 3.0 | 3.0 | 1314 | $2,200 | $1.67 | 15d | 1 | 1.20mi |
| 5 Rolos Way Unit 5 Asheville, NC | 2.0 | 2.0 | 1100 | $1,850 | $1.68 | 15d | 1 | 1.21mi |
| 919 Haywood Rd Asheville, NC | 1.0–2.0 | 1.0–2.0 | 1010 | $1,950 | $1.93 | 15d | 6 | 1.28mi |
| 110 Bear Creek Ln Asheville, NC | 1.0–3.0 | 1.0–2.0 | 910 | $1,824 | $2.00 | 15d | 23 | 1.32mi |
| 205 Rumbough Pl Asheville, NC | 3.0 | 2.0 | 875 | $1,950 | $2.23 | 25d | 1 | 1.38mi |
| 76 Lanvale Ave Unit 1 Asheville, NC | 2.0 | 1.5 | 1200 | $2,195 | $1.83 | 25d | 1 | 1.46mi |
Listing history 8 events
-
2026-06-18days on market $249,000 Active 9 DOM
-
2026-06-17days on market $249,000 Active 8 DOM
-
2026-06-16days on market $249,000 Active 7 DOM
-
2026-06-15days on market $249,000 Active 6 DOM
-
2026-06-14days on market $249,000 Active 4 DOM
-
2026-06-10status $249,000 Active 1 DOM
-
2026-06-09remarks 699-char remark
-
2026-06-09$249,000 Coming Soon 1 DOM
ⓘ Source: listings_history table (triggers on properties + properties_extension) + one-shot
backfill from property_details.listing_events for pre-trigger history.
Tax reassessment forecast NC · Resets to sale price
- Current annual tax
- $985 · $82/mo
- Projected year-2 tax
- $2,042 · $170/mo
- Expected delta
- +$1,057/yr (+$88/mo · 107.3%)
ⓘ Screening estimate from a state-policy table — verify with the county assessor before closing.
Climate risk First Street
- Flood 1/10 Low FEMA zone X (unshaded) · 0% chance over 30 yrs
- Wildfire 4/10 Moderate
- Heat 3/10 Moderate 7 d/yr ≥98°F today · 19 d/yr by 30 yrs out
- Wind 2/10 Low
- Air quality 3/10 Moderate 2 unhealthy d/yr today · 2 by 30 yrs out
Nearby sold comps map
Loading sold comps map…
Walkable amenities ~0.75 mi
Loading nearby amenities…
Taxation est. · year 1
- Rental income
- $23,841
- − Mortgage interest
- −$13,948
- − Property taxes
- −$985
- − Insurance
- −$1,245
- − Repairs & maintenance
- −$1,907
- − Management
- −$1,907
- − Depreciation
- −$7,244
- Taxable loss
- −$3,395
- Est. tax savings @ 24.0%
- +$815
- After-tax cash flow
- $1,750/yr
For passive investors: Depreciation is non-cash, so a rental often shows a tax loss while cash-flowing — sheltering income. Rental losses are passive: they offset passive income freely, and up to $25,000/yr can offset ordinary (W-2) income if you actively participate and your MAGI is under $100k (phasing out to $0 by $150k); unused losses carry forward. On sale, claimed depreciation is recaptured at up to 25%, and gains may owe capital-gains tax (a 1031 exchange can defer both). Figures are a year-1 estimate at your 24.0% rate — not tax advice; consult a CPA.
Schools (NCES district)
- District
- Buncombe County Schools
- NCES district ID
- 3700450
- Math proficiency
- 45% ▬ 0.00%
- Reading proficiency
- 50% ▲ 2.00%
- Median HH income
- $45,981
- Composite
- 40.32/100
- National rank
- #3749
- State rank
- #72 of 178 in NC
Livability — Asheville
- Score
- 72/100
- State rank
- #96
- US rank
- #6307
Category grades
Schools grade is shown separately in the Schools card above.
Census & demographics
- County
- Buncombe County · 241,085 people
- City population
- 137,611
- Metro
- Asheville, NC
- Population (ZIP)
- 43,433
- Household income
- $63,273
- Rent vs Own
- Severe rent burden
- 1783.0
Population outlook (Buncombe County) Hauer SSP2
- Today (2025)
- 286,475 people
- By 2030
- 302,237 · +5.5%
- By 2040
- 330,687 · +15.4%
- By 2050
- 356,370 · +24.4%
- By 2075
- 409,383 · +42.9%
- By 2100
- 437,270 · +52.6%
Race, ethnicity, and origin ACS 2023
- Neighborhood character
- Predominantly White (77%)
- Race & ethnicity
- White 77% Hispanic / Latino 11% Two or more races 9% Black 6% Asian 2%
- Hispanic origin (detail)
- Mexican 6%
- Common ancestry
- Serbian 3% Slovak 3% Italian 3%
- Foreign-born
- 10% · Canada, China
- Languages at home
- 86% English-only · Spanish 9% Russian/Polish/Slavic 3% Other Indo-European 2%
Political lean MEDSL · Buncombe
- 2024 margin
- Strong D (+24.8) · D 61.7% · R 36.9% · Other 1.4%
- 2008→2024 swing
- +10.9pp toward D · 2008: 13.9pp · 2024: 24.8pp
- All cycles
- 2024: D+24.8 2020: D+21.1 2016: D+14.6 2012: D+12.4 2008: D+13.9
Not yet ingested
- Civics
- —
Market trends
- HPI YoY
- ▼ -271.16%
- Current HPI
- 350.3071
- Rent YoY
- ▲ 2.06%
- Metro
- Asheville, NC
- State GDP YoY
- ▲ 3.28%
- F500 in state
- 26
Industry mix (Fortune 500 HQ in NC)
| Industry | F500 HQs | Revenue |
|---|---|---|
| Financial Services | 2 | $213B |
|
||
| Retail | 2 | $95B |
|
||
| Industrial Conglomerate | 1 | $38B |
|
||
| Metals / Steel | 1 | $35B |
|
||
| Utilities | 1 | $30B |
|
||
| Industrial Machinery | 1 | $19B |
|
||
Price history
+245.8% since first listed2 events — show timeline
- 2026-06-08 Coming Soon $249,000 CANOPYMLS as Distributed by MLS Grid
- 2001-02-02 Sold (Public Records) $72,000 Public Records
Property tax history
+2.6%/yrLatest (2025): $985 · +6.7% YoY. Source: county tax records.
Cash-flow waterfall
monthlySold comps — $/sqft
last 12 mo · ≤1 miLoading sold comps…