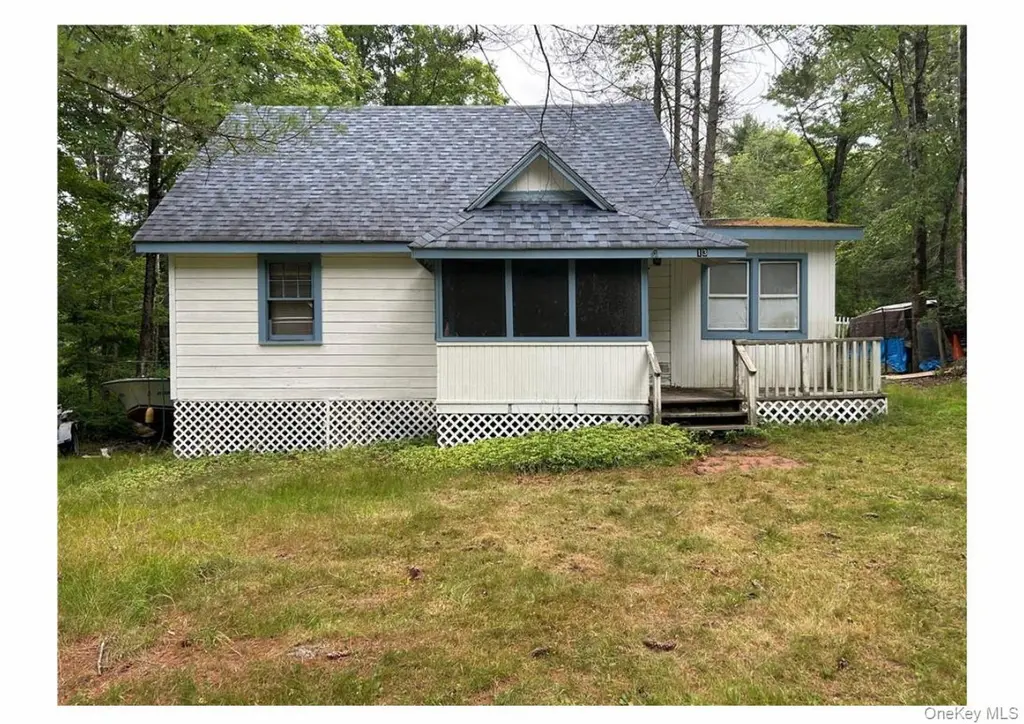
13 Eldridge St S · Kauneonga Lake, NY
Flood risk No data
- FEMA flood zone
- —
- Chance of flooding over 30 yrs
- —
- Est. flood insurance / yr
- —
Fire risk No data
- Est. fire insurance / yr
- —
Heat risk No data
- Hot days now (above threshold)
- —
- Hot days in 30 yrs
- —
Wind risk No data
- Chance of severe wind over 30 yrs
- —
Air-quality risk No data
- Unhealthy air days now
- —
- Unhealthy air days in 30 yrs
- —
Risk factors via First Street. Map © Google.
Why this score? — see what drove the C- grade
The composite is a weighted blend of 9 inputs, each scored 0–100. Each bar is that input's sub-score; the figure is the points it added to the 100-point composite (weight × sub-score).
- ARV discount +15.0/15.0
- Cash flow +11.5/30.0
- Appreciation +8.6/10.0
- DSCR +3.4/10.0
- 1% rule +3.3/10.0
- Rent growth +2.5/5.0
- Schools +2.5/10.0
- Livability +2.5/5.0
- Condition / age +2.2/5.0
$150,000
🖨 Deal sheet 📄 Offer letter ✓ Due diligence
Listing remarks MLS
Great opportunity, walk distance from the lake, just gorgeous must come and see it!!!!
Key facts
- 0.43 acre lot
- Built 1930
- Listed 252 days
Tags
Neighborhood map
What this means for you Summary
Snapshot
- This is a 3-bed/1.5-bath single-family listed at $150k. Condition is rated fair.
Deal economics
- At list price, monthly cash flow is $-49 ($-594/yr) — negative.
- To cash-flow at today's rent, offer at most $143k (4.8% below list).
- To meet the 1% rule (rent ≥ 1% of price), the offer needs to be $125k (16.7% below list).
- Recommended offer: $125k (16.7% below list) — sets the bar for 1% rule.
Location & tenants
- Location reads: area grade C — affects rentability + tenant quality, not the cash-flow math above.
- Monticello Central School District (town): math 29% / reading 30% proficiency, ranked #577 of 590 in NY (top 98%) — low school quality limits family demand, transient renter base, plan for 1-2y turnover.
- Market conditions: 61 active listings in the ZIP; 739 units permitted in Sullivan County in 2024 (5 in 5+ unit buildings).
Forward outlook
- In year one you build about $12k of equity ($1k loan paydown + $11k appreciation (7.1% local appreciation)).
- Sullivan County population projected at -24% by 2050 — secular population decline; favor cash flow + early exit over multi-decade hold.
- At projected returns (7.1% appreciation + 3.0% rent growth), your $42k cash investment doubles in ~4 years — after that, you're playing with house money.
- By year 4, paydown + projected appreciation supports a ~$40k cash-out refi (75% LTV) — recoverable capital for the next deal without selling this one.
Negotiation context
- It's been on market 252 days — a 12% lower offer ($132k) is reasonable based on typical stale-listing flexibility.
- 4 sale attempts since 2y ago with the ask held roughly flat each time — persistent listings suggest the price (not the market) is what's stuck; bring a comps-based counter.
Risks & watch-outs
- Watch-outs: built in 1930 — expect roof / HVAC / electrical / plumbing capex.
Questions for the listing agent
- What do current leases actually rent for vs. the listed asking? Can we see a recent rent roll and the last 12 months of T-12 income?
- It's been on market 252 days. Have you received any prior offers? Is the seller open to a 17% concession, seller financing, or rate buy-down credit?
- Have any recent inspections been done? Can we get a copy of the seller's disclosures and any deferred-maintenance estimates?
- Built in 1930 — when were the roof, HVAC, electrical panel, plumbing, and water heater last replaced?
- Why hasn't it sold? Are there any deal-killer items the seller is aware of (foundation, flood, title, zoning, code violations)?
- Is there a deadline driving the sale (1031 exchange, divorce, estate, relocation)? That informs how much negotiation room exists.
- What's the average days-on-market for RENTAL listings here right now (not sales)? A rising rental-DOM trend means longer vacancies and softer asking-rent achievability than the comps imply.
- What's the recent tenant-quality profile in this submarket — average credit score on applications, eviction rate, late-payment / NSF rate, and stable-employment percentage? A property-management company in the area should have these aggregated.
- How much new for-sale + rental construction is in the pipeline within 1–3 miles? Heavy new supply typically softens prices + rents 12–24 months out; constrained supply supports both.
Investment metrics
- 1% rule
- 0.83% ✗
- Cap rate
- 5.90%
- Cash-on-cash
- -1.41%
- DSCR
- 0.94
- GRM
- 10.0
CMA / ARV
- ARV (median comp)
- $239,627
- List price
- $150,000
- Delta
- -37.40%
- Verdict
- UNDERPRICED
- Comps
- 20 within 1.0 mi
Show comp detail 5 sales within ~0.75 mi
| Address | Dist | Beds/Ba | Sqft | Sold | Price | $/sf | Match |
|---|---|---|---|---|---|---|---|
| 34 N Mohican Trl N | 0.00mi | 2/2.0 (-1) | 910 (-0%) | 9mo | $270,000 | $297 | 86 |
| 30 W Sullivan Pl | 0.00mi | 2/1.0 (-1) | 908 (-0%) | 13mo | $277,000 | $305 | 82 |
| 1985 State Route 17b | 0.03mi | 3/1.5 | 1,008 (+11%) | 12mo | $235,000 | $233 | 71 |
| 11 Hubert Road Tr 13 | 0.00mi | 2/1.5 (-1) | 784 (-14%) | 23mo | $124,700 | $159 | 53 |
| 34 E Cherry Trl | 0.05mi | 2/1.0 (-1) | 809 (-11%) | 23mo | $35,000 | $43 | 53 |
Match score weights: distance 35% · size 25% · config 20% · recency 20%. Top-matched comps best support the ARV.
Projected returns pro-forma
7.11% appreciation · 3.0% rent growth · sell at horizon
- IRR
- 16.9%
- Equity multiple
- 2.20×
- Total profit
- $50,285
- Equity at exit
- $105,050
- IRR
- 16.4%
- Equity multiple
- 4.53×
- Total profit
- $148,457
- Equity at exit
- $200,557
Cash invested: $42,000 (down + closing). Projections, not guarantees.
Landlord ↔ Tenant lean methodology
- Overall (STATE)
- 15 Strongly Tenant-Friendly
- State New York
- 15 Strongly Tenant-Friendly · D+10
- County
- — inherits STATE
- City
- — inherits STATE
ZIP-level market 12720
- Home prices YoY
- 1.6%
- Active inventory
- 61
- Price-to-rent
- 10.0×
Monthly cashflow live
- Estimated rent
- $1,250 medium interval (Pro) →
- Mortgage (P&I)
- −$787
- Tax est. 1.5%
- −$188 /mo · $2,250/yr
- Insurance
- −$62
- HOA
- −$0
- Vacancy / Maint / Mgmt
- −$262
- Net cashflow
- $-49
Break-even live
UW: 25.0% down · 7.5% · 30yr · 1.5% tax · 5.0% vac · 8.0% maint · 8.0% mgmt
Financing live
Cash to close
- Down payment
- $37,500
- Closing costs
- $4,500
- Reserves months
- —
- Total cash needed
- —
Loan-product check · same deal, 3 products live
Conventional
25% down · 7.5% · 30yr
- Down + closing
- —
- Monthly P&I
- —
- Monthly cashflow
- —
- DSCR
- —
- Eligible?
- —
Personal DTI + credit; lowest rate.
DSCR
20% down · 8.5% · 30yr
- Down + closing
- —
- Monthly P&I
- —
- Monthly cashflow
- —
- DSCR
- —
- Eligible?
- —
No personal income docs; deal must DSCR.
Hard money
10% down · 12.0% · 12mo
- Down + closing
- —
- Monthly P&I
- —
- Monthly cashflow
- —
- DSCR
- —
- Eligible?
- —
Short-term bridge; refi at stabilization.
Listing history 24 events
-
2026-06-18days on market $150,000 Active 252 DOM
-
2026-06-17days on market $150,000 Active 251 DOM
-
2026-06-16days on market $150,000 Active 250 DOM
-
2026-06-15days on market $150,000 Active 249 DOM
-
2026-06-14days on market $150,000 Active 247 DOM
-
2026-06-10days on market $150,000 Active 244 DOM
-
2026-06-09days on market $150,000 Active 243 DOM
-
2026-06-08days on market $150,000 Active 242 DOM
-
2026-06-07days on market $150,000 Active 241 DOM
-
2026-06-03days on market $150,000 Active 237 DOM
-
2026-06-02days on market $150,000 Active 236 DOM
-
2026-06-01days on market $150,000 Active 235 DOM
-
2026-05-31days on market $150,000 Active 234 DOM
-
2026-05-31days on market $150,000 Active 233 DOM
-
2025-10-08$150,000 Active 86-char remark
Show marketing remark (86 chars)
Great opportunity, walk distance from the lake, just gorgeous must come and see it!!!!
-
2025-08-02historical
-
2025-04-04price $128,000
-
2025-03-10status Active
-
2025-03-02historical
-
2024-09-26$135,000 Active
-
2024-09-01historical
-
2024-07-08price $140,000
-
2024-05-28price $145,000
-
2024-03-26$150,000 Active
ⓘ Source: listings_history table (triggers on properties + properties_extension) + one-shot
backfill from property_details.listing_events for pre-trigger history.
Nearby sold comps map
Loading sold comps map…
Walkable amenities ~0.75 mi
Loading nearby amenities…
Taxation est. · year 1
- Rental income
- $14,994
- − Mortgage interest
- −$8,402
- − Property taxes
- −$2,250
- − Insurance
- −$750
- − Repairs & maintenance
- −$1,200
- − Management
- −$1,200
- − Depreciation
- −$4,364
- Taxable loss
- −$3,171
- Est. tax savings @ 24.0%
- +$761
- After-tax cash flow
- $167/yr
For passive investors: Depreciation is non-cash, so a rental often shows a tax loss while cash-flowing — sheltering income. Rental losses are passive: they offset passive income freely, and up to $25,000/yr can offset ordinary (W-2) income if you actively participate and your MAGI is under $100k (phasing out to $0 by $150k); unused losses carry forward. On sale, claimed depreciation is recaptured at up to 25%, and gains may owe capital-gains tax (a 1031 exchange can defer both). Figures are a year-1 estimate at your 24.0% rate — not tax advice; consult a CPA.
Condition & rehab AI · 12 photos
This property requires significant repairs and updates to improve its condition and value. The exterior and interior need fresh paint, and the flooring and kitchen need to be replaced. Upgrading the kitchen and bathrooms will significantly enhance its resale and rental value.
Repairs flagged
- Major exterior siding — Significant damage
- Major interior walls — Peeling paint
- Major flooring — Worn carpet
- Major kitchen cabinets — Old and outdated
- Major bathroom fixtures — Small and outdated
Value-add opportunities
- Resale Paint exterior — Enhances curb appeal
- Both Replace carpet — Improves comfort and appearance
- Resale Upgrade kitchen cabinets — Modernizes the space
- Resale Replace bathroom fixtures — Modernizes the space
Renovation cost estimate screening
| Repair item | Severity | Est. cost |
|---|---|---|
| exterior siding · Significant damage | Major | $15,000–50,000 |
| interior walls · Peeling paint | Major | $15,000–50,000 |
| flooring · Worn carpet | Major | $15,000–50,000 |
| kitchen cabinets · Old and outdated | Major | $15,000–50,000 |
| bathroom fixtures · Small and outdated | Major | $15,000–50,000 |
| Total estimated repair cost · 5 items | $75,000–250,000 |
Value-add ROI direction
- Resale Paint exterior — Enhances curb appeal ↑
- Both Replace carpet — Improves comfort and appearance ↑
- Resale Upgrade kitchen cabinets — Modernizes the space ↑
- Resale Replace bathroom fixtures — Modernizes the space ↑
ⓘ Cost ranges are severity-bucket heuristics (US national rule-of-thumb). Get contractor quotes + a written scope before underwriting a rehab budget.
Schools (NCES district)
- District
- Monticello Central School District
- NCES district ID
- 3619740
- Math proficiency
- 29% ▼ -4.00%
- Reading proficiency
- 30% ▼ -2.00%
- Median HH income
- $44,696
- Composite
- 25.28/100
- National rank
- #7491
- State rank
- #577 of 590 in NY
Livability — Kauneonga Lake
No livability data for this city. (Only ~50 U.S. cities are tracked.)
Census & demographics
- City population
- 507
- Population (ZIP)
- 434
Population outlook (Sullivan County) Hauer SSP2
- Today (2025)
- 68,974 people
- By 2030
- 65,609 · -4.9%
- By 2040
- 58,878 · -14.6%
- By 2050
- 52,500 · -23.9%
- By 2075
- 39,941 · -42.1%
- By 2100
- 28,880 · -58.1%
Race, ethnicity, and origin ACS 2023
- Neighborhood character
- Predominantly White (100%)
- Race & ethnicity
- White 100%
- Common ancestry
- Danish 1%
- Foreign-born
- 1%
- Languages at home
- 86% English-only · Spanish 12% German/W. Germanic 3%
Political lean MEDSL · Sullivan
- 2024 margin
- R (+16.7) · D 41.6% · R 58.4%
- 2008→2024 swing
- -26.2pp toward R · 2008: 9.5pp · 2024: -16.7pp
- All cycles
- 2024: R+16.7 2020: R+9.2 2016: R+13.7 2012: D+10.4 2008: D+9.5
Not yet ingested
- Civics
- —
Market trends
- HPI YoY
- ▲ 7.11%
- Current HPI
- 449.7929
- Rent YoY
- —
- Metro
- —
- State GDP YoY
- ▲ 2.60%
- F500 in state
- 92
Industry mix (Fortune 500 HQ in NY)
| Industry | F500 HQs | Revenue |
|---|---|---|
| Financial Services | 10 | $950B |
|
||
| Consumer Goods | 9 | $162B |
|
||
| Insurance | 4 | $225B |
|
||
| Telecommunications | 2 | $144B |
|
||
| Pharmaceuticals | 2 | $112B |
|
||
| Media / Entertainment | 2 | $69B |
|
||
Price history
+0.0% since first listed10 events — show timeline
- 2025-10-08 Listed $150,000 OneKey® MLS as Distributed by MLS Grid
- 2025-08-02 Listing Removed — OneKey® MLS as Distributed by MLS Grid
- 2025-04-04 Price Changed $128,000 OneKey® MLS as Distributed by MLS Grid
- 2025-03-10 Relisted — OneKey® MLS as Distributed by MLS Grid
- 2025-03-02 Listing Removed — OneKey® MLS as Distributed by MLS Grid
- 2024-09-26 Listed $135,000 OneKey® MLS as Distributed by MLS Grid
- 2024-09-01 Listing Removed — OneKey® MLS as Distributed by MLS Grid
- 2024-07-08 Price Changed $140,000 OneKey® MLS as Distributed by MLS Grid
- 2024-05-28 Price Changed $145,000 OneKey® MLS as Distributed by MLS Grid
- 2024-03-26 Listed $150,000 OneKey® MLS as Distributed by MLS Grid
Cash-flow waterfall
monthlySold comps — $/sqft
last 12 mo · ≤1 miLoading sold comps…