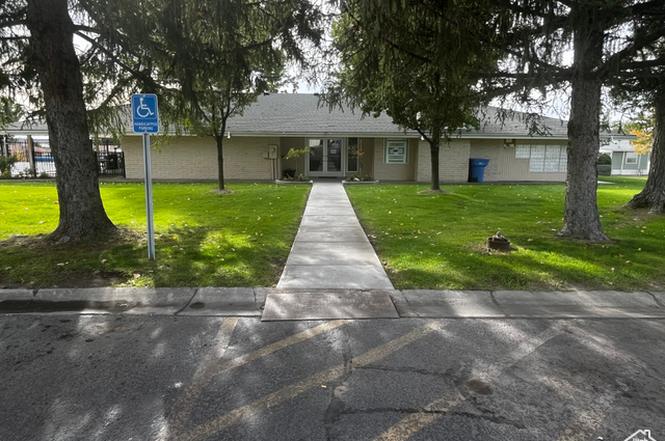
155 S 1200 W #97 · Orem, UT
Flood risk No data
- FEMA flood zone
- —
- Chance of flooding over 30 yrs
- —
- Est. flood insurance / yr
- —
Fire risk No data
- Est. fire insurance / yr
- —
Heat risk No data
- Hot days now (above threshold)
- —
- Hot days in 30 yrs
- —
Wind risk No data
- Chance of severe wind over 30 yrs
- —
Air-quality risk No data
- Unhealthy air days now
- —
- Unhealthy air days in 30 yrs
- —
Risk factors via First Street. Map © Google.
Why this score? — see what drove the B- grade
The composite is a weighted blend of 9 inputs, each scored 0–100. Each bar is that input's sub-score; the figure is the points it added to the 100-point composite (weight × sub-score).
- Cash flow +27.6/30.0
- DSCR +9.7/10.0
- 1% rule +7.5/10.0
- ARV discount +7.5/15.0
- Livability +4.3/5.0
- Schools +4.2/10.0
- Rent growth +3.2/5.0
- Condition / age +2.5/5.0
- Appreciation +0.0/10.0
$139,900
🖨 Deal sheet 📄 Offer letter ✓ Due diligence
Listing remarks MLS
There are no remarks available.
Key facts
- Clubhouse
- Prime orem location
- Swimming pool
Tags
Property features AI
Finance
- HOA & community: Clubhouse; Subdivision: TIMPANOGOS
Exterior
- Parking: 2 open/uncovered parking spaces
- Utilities: Natural gas connected; Electricity connected; Sewer connected; Culinary (potable) water connected
- Home design: Manufactured home; Built and standing; Single-story; Residential zoning (R-1)
- Construction: Asphalt roof; Other construction materials; No basement
- Exterior features: Covered deck; Covered patio; Full fencing; Paved road access; Automatic full sprinkler system; Landscaped
Interior
- Kitchen: Microwave; Refrigerator
- Bedrooms: 3 main-level bedrooms
- Flooring: Carpet; Laminate
- Bathrooms: 2 full bathrooms
- Heating & cooling: Forced air heating; Evaporative cooling
- Interior features: Primary bathroom; Walk-in closet; Great room; Blinds
Neighborhood map
What this means for you Summary
Snapshot
- This is a 3-bed/2.0-bath manufactured listed at $140k.
Deal economics
- At list price, monthly cash flow is $416 ($5k/yr) — positive.
- The deal already cash-flows at list — no discount required.
- Meets the 1% rule at list price ($2k rent vs $140k).
- Recommended offer: $123k (12.0% below list) — sets the bar for market timing.
Location & tenants
- Location reads 86/100 on livability (#10 in UT, #389 nationally) — a professional / high-income tenant draw. Strengths: amenities A+, commute A+, housing A+.
- Alpine District (suburban): math 45% / reading 50% proficiency, ranked #25 of 80 in UT (top 31%) — families likely to look elsewhere, expect single-tenant / working-renter base with shorter leases; only 18% free/reduced lunch — higher-income household profile.
- Zoned schools: Orem School (math 63% / reading 61%, grade B, #39 of 585 statewide, top 8%, 716 students, 38% FRL); Orem Jr High (math 24% / reading 34%, grade F, #112 of 138 statewide, top 81%, 961 students, 41% FRL); Mountain View High (math 15% / reading 40%, grade F, #130 of 171 statewide, top 76%, 1,508 students, 33% FRL) — zoned schools average 37% FRL vs 18% district-wide (19 pts higher); higher-poverty schools than district average — tighter screening recommended.
- Market conditions: Rents rising (+2.9%/yr); 115 active listings in the ZIP; 40 comparable units currently listed for rent nearby; rentals at typical pace (median 24d on market — plan ~3-4 weeks tenant-placement turnaround); 6,326 units permitted in Utah County in 2024 (1,053 in 5+ unit buildings).
Forward outlook
- Local home prices are declining (-3.0%/yr); year-one equity from $967 of loan paydown is wiped out by about $4k of value loss. Plan a longer hold.
- Utah County population projected at +49% by 2050 — long-run rental-demand tailwind backs the buy-and-hold thesis.
- At projected returns (-3.0% appreciation + 2.9% rent growth), your $39k cash investment doubles in ~10 years — after that, you're playing with house money.
Negotiation context
- It's been on market 275 days — a 12% lower offer ($123k) is reasonable based on typical stale-listing flexibility.
- 3 sale attempts since 3y ago; this cycle's ask has dropped $20k (13%) from the opening price — seller is motivated, your offer sets the floor, not the list.
Questions for the listing agent
- It's been on market 275 days. Have you received any prior offers? Is the seller open to a 12% concession, seller financing, or rate buy-down credit?
- Why hasn't it sold? Are there any deal-killer items the seller is aware of (foundation, flood, title, zoning, code violations)?
- Is there a deadline driving the sale (1031 exchange, divorce, estate, relocation)? That informs how much negotiation room exists.
- Schools are B-rated — typically a magnet for longer-tenancy family renters. What's the average tenant stay here, and is there a school-zone premium baked into asking?
- What's the average days-on-market for RENTAL listings here right now (not sales)? A rising rental-DOM trend means longer vacancies and softer asking-rent achievability than the comps imply.
- What's the recent tenant-quality profile in this submarket — average credit score on applications, eviction rate, late-payment / NSF rate, and stable-employment percentage? A property-management company in the area should have these aggregated.
- How much new for-sale + rental construction is in the pipeline within 1–3 miles? Heavy new supply typically softens prices + rents 12–24 months out; constrained supply supports both.
Investment metrics
- 1% rule
- 1.25% ✓
- Cap rate
- 9.86%
- Cash-on-cash
- 12.74%
- DSCR
- 1.57
- GRM
- 6.7
CMA / ARV
No comps found within radius.
Projected returns pro-forma
-3.0% appreciation · 2.87% rent growth · sell at horizon
- IRR
- 2.4%
- Equity multiple
- 1.09×
- Total profit
- $3,616
- Equity at exit
- $20,860
- IRR
- 11.9%
- Equity multiple
- 1.93×
- Total profit
- $36,427
- Equity at exit
- $12,096
Cash invested: $39,172 (down + closing). Projections, not guarantees.
Landlord ↔ Tenant lean methodology
- Overall (STATE)
- 86 Strongly Landlord-Friendly
- State Utah
- 86 Strongly Landlord-Friendly · R+15
- County
- — inherits STATE
- City
- — inherits STATE
ZIP-level market 84058
- Rents YoY
- 2.9%
- Active inventory
- 115
- Price-to-rent
- 6.7×
Monthly cashflow live
- Estimated rent
- $1,750 high interval (Pro) →
- Mortgage (P&I)
- −$734
- Tax est. 1.5%
- −$175 /mo · $2,098/yr
- Insurance
- −$58
- HOA
- −$0
- Vacancy / Maint / Mgmt
- −$368
- Net cashflow
- $416
Break-even live
UW: 25.0% down · 7.5% · 30yr · 1.5% tax · 5.0% vac · 8.0% maint · 8.0% mgmt
Financing live
Cash to close
- Down payment
- $34,975
- Closing costs
- $4,197
- Reserves months
- —
- Total cash needed
- —
Loan-product check · same deal, 3 products live
Conventional
25% down · 7.5% · 30yr
- Down + closing
- —
- Monthly P&I
- —
- Monthly cashflow
- —
- DSCR
- —
- Eligible?
- —
Personal DTI + credit; lowest rate.
DSCR
20% down · 8.5% · 30yr
- Down + closing
- —
- Monthly P&I
- —
- Monthly cashflow
- —
- DSCR
- —
- Eligible?
- —
No personal income docs; deal must DSCR.
Hard money
10% down · 12.0% · 12mo
- Down + closing
- —
- Monthly P&I
- —
- Monthly cashflow
- —
- DSCR
- —
- Eligible?
- —
Short-term bridge; refi at stabilization.
Rent comps 40 comps
| Address | Beds | Baths | Sqft | Rent | $/sqft | DOM | Units | Dist |
|---|---|---|---|---|---|---|---|---|
| 1147 W 40 S Orem, UT | 3.0 | 2.0 | 1848 | $450 | $0.24 | 23d | 1 | 0.10mi |
| 203 N 1200 W #304 Orem, UT | 3.0 | 2.0 | 1740 | $2,095 | $1.20 | 14d | 1 | 0.42mi |
| 231 N 1200 W Orem, UT | 3.0 | 2.0 | 1336 | $1,725 | $1.29 | 14d | 1 | 0.46mi |
| 782 N 1570 W Orem, UT | 3.0 | 1.5 | 1300 | $1,500 | $1.15 | 23d | 1 | 0.50mi |
| 289 N 1030 W Orem, UT | 2.0 | 1.0 | 1092 | $1,395 | $1.28 | 2d | 1 | 0.55mi |
| 100 S Geneva Rd Vineyard, UT | 1.0–2.0 | 1.0–2.0 | 858 | $1,813 | $2.11 | 2d | 14 | 0.65mi |
| 1014 W 400 N Orem, UT | 4.0 | 1.5 | 1700 | $2,450 | $1.44 | 14d | 1 | 0.72mi |
| 216 N 750 East St Unit Bedroom 2 Vineyard, UT | 3.0 | 2.0 | 1700 | $600 | $0.35 | 2d | 1 | 0.73mi |
| 218 N 750 East St Unit Bedroom 3 Vineyard, UT | 3.0 | 2.0 | 1628 | $650 | $0.40 | 14d | 1 | 0.73mi |
| 220 N 750 East St #3 Vineyard, UT | 3.0 | 2.0 | 1700 | $2,000 | $1.18 | 14d | 1 | 0.73mi |
| 220 N 750 East St Unit Bedroom 1 Vineyard, UT | 3.0 | 2.0 | 1700 | $850 | $0.50 | 2d | 1 | 0.73mi |
| 220 N 750 East St Unit Bedroom 2 Vineyard, UT | 3.0 | 2.0 | 1700 | $650 | $0.38 | 2d | 1 | 0.73mi |
| 215 N 680 E Vineyard, UT | 3.0 | 2.0 | 1311 | $1,725 | $1.32 | 23d | 1 | 0.79mi |
| 225 N 680 E Vineyard, UT | 3.0 | 2.0 | 1311 | $1,725 | $1.32 | 23d | 1 | 0.80mi |
| 534 E 300 North St Unit 212 Vineyard, UT | 3.0 | 2.0 | 1299 | $1,785 | $1.37 | 23d | 1 | 0.80mi |
| 125 N Mill Rd Vineyard, UT | 1.0–3.0 | 1.0–2.0 | 933 | $1,671 | $1.79 | 14d | 10 | 0.81mi |
| 125 N Mill Rd Vineyard, UT | 1.0–3.0 | 1.0–2.0 | 933 | $1,671 | $1.79 | 2d | 10 | 0.81mi |
| 217 N 670 E Unit 102 Vineyard, UT | 2.0 | 2.0 | 1039 | $1,480 | $1.42 | 23d | 1 | 0.84mi |
| 323 N 725 E Vineyard, UT | 3.0 | 3.0 | 1849 | $1,995 | $1.08 | 2d | 1 | 0.84mi |
| 651 E 180 N Unit 312 Vineyard, UT | 3.0 | 2.0 | 1299 | $1,785 | $1.37 | 23d | 1 | 0.85mi |
| 648 E 230 N Unit 307 Vineyard, UT | 2.0 | 2.0 | 1020 | $1,480 | $1.45 | 23d | 1 | 0.86mi |
| 670 S 1545 W Orem, UT | 3.0 | 2.5 | 1472 | $1,795 | $1.22 | 2d | 1 | 0.86mi |
| 631 E 180 N Unit 301 Vineyard, UT | 3.0 | 2.0 | 1299 | $1,785 | $1.37 | 23d | 1 | 0.87mi |
| 631 E 180 N Unit 105 Vineyard, UT | 2.0 | 2.0 | 1039 | $1,480 | $1.42 | 23d | 1 | 0.87mi |
| 662 E 230 N Unit 311 Vineyard, UT | 2.0 | 2.0 | 1020 | $1,480 | $1.45 | 23d | 1 | 0.88mi |
| 632 E 230 N Unit 306 Vineyard, UT | 2.0 | 2.0 | 1020 | $1,480 | $1.45 | 23d | 1 | 0.88mi |
| 615 E 180 N Unit 312 Vineyard, UT | 3.0 | 2.0 | 1299 | $1,785 | $1.37 | 23d | 1 | 0.89mi |
| 615 E 180 N Unit 308 Vineyard, UT | 2.0 | 2.0 | 1020 | $1,480 | $1.45 | 23d | 1 | 0.89mi |
| 265 N 670 E Unit 205 Vineyard, UT | 2.0 | 2.0 | 1020 | $1,620 | $1.59 | 23d | 1 | 0.89mi |
| 305 N 680 E Vineyard, UT | 4.0 | 3.0 | 1600 | $2,300 | $1.44 | 23d | 1 | 0.90mi |
| 614 E 230 N Unit 111 Vineyard, UT | 2.0 | 2.0 | 1039 | $1,480 | $1.42 | 23d | 1 | 0.90mi |
| 279 N 670 E Unit 108 Vineyard, UT | 2.0 | 2.0 | 1020 | $1,480 | $1.45 | 23d | 1 | 0.91mi |
| 623 E 250 N Unit 301 Vineyard, UT | 3.0 | 2.0 | 1324 | $1,920 | $1.45 | 23d | 1 | 0.92mi |
| 594 E 255 N Unit 105 Orem, UT | 2.0 | 2.0 | 1039 | $1,480 | $1.42 | 23d | 1 | 0.93mi |
| 624 E 300 N Unit 206 Vineyard, UT | 2.0 | 2.0 | 1039 | $1,620 | $1.56 | 21d | 1 | 0.93mi |
| 624 E 300 N Vineyard, UT | 3.0 | 2.0 | 1323 | $1,785 | $1.35 | 23d | 1 | 0.93mi |
| 266 N 590 E Unit 107 Vineyard, UT | 2.0 | 2.0 | 1020 | $1,480 | $1.45 | 23d | 1 | 0.94mi |
| 573 E 210 N Unit 312 Vineyard, UT | 3.0 | 2.0 | 1299 | $1,785 | $1.37 | 23d | 1 | 0.95mi |
| 576 E 250 N Unit 308 Vineyard, UT | 2.0 | 2.0 | 1020 | $1,480 | $1.45 | 23d | 1 | 0.96mi |
| 648 E 380 N Vineyard, UT | 3.0 | 3.0 | 1828 | $1,850 | $1.01 | 2d | 1 | 0.96mi |
Listing history 26 events
-
2026-06-18days on market $139,900 Active 275 DOM
-
2026-06-17days on market $139,900 Active 274 DOM
-
2026-06-16days on market $139,900 Active 273 DOM
-
2026-06-15days on market $139,900 Active 272 DOM
-
2026-06-14days on market $139,900 Active 270 DOM
-
2026-06-13days on market $139,900 Active 269 DOM
-
2026-06-10days on market $139,900 Active 267 DOM
-
2026-06-09days on market $139,900 Active 266 DOM
-
2026-06-08days on market $139,900 Active 265 DOM
-
2026-06-07days on market $139,900 Active 264 DOM
-
2026-06-03days on market $139,900 Active 260 DOM
-
2026-06-03days on market $139,900 Active 259 DOM
-
2026-06-01days on market $139,900 Active 258 DOM
-
2026-05-31days on market $139,900 Active 257 DOM
-
2026-05-31days on market $139,900 Active 256 DOM
-
2026-01-28price $139,900
-
2025-10-01price $149,900
-
2025-09-16$159,900 Active
-
2023-10-16soldstatus Closed 31-char remark
Show marketing remark (31 chars)
There are no remarks available.
-
2023-09-20historical Backup 31-char remark
Show marketing remark (31 chars)
There are no remarks available.
-
2023-09-19price $139,000 31-char remark
Show marketing remark (31 chars)
There are no remarks available.
-
2023-09-13price $145,000 31-char remark
Show marketing remark (31 chars)
There are no remarks available.
-
2023-08-26price $155,000 31-char remark
Show marketing remark (31 chars)
There are no remarks available.
-
2023-08-26status Active 31-char remark
Show marketing remark (31 chars)
There are no remarks available.
-
2023-08-21historical Backup 31-char remark
Show marketing remark (31 chars)
There are no remarks available.
-
2023-08-14$170,000 Active 31-char remark
Show marketing remark (31 chars)
There are no remarks available.
ⓘ Source: listings_history table (triggers on properties + properties_extension) + one-shot
backfill from property_details.listing_events for pre-trigger history.
Nearby sold comps map
Loading sold comps map…
Walkable amenities ~0.75 mi
Loading nearby amenities…
Taxation est. · year 1
- Rental income
- $21,003
- − Mortgage interest
- −$7,837
- − Property taxes
- −$2,098
- − Insurance
- −$700
- − Repairs & maintenance
- −$1,680
- − Management
- −$1,680
- − Depreciation
- −$4,070
- Taxable income
- $2,938
- Est. tax owed @ 24.0%
- −$705
- After-tax cash flow
- $4,285/yr
For passive investors: Depreciation is non-cash, so a rental often shows a tax loss while cash-flowing — sheltering income. Rental losses are passive: they offset passive income freely, and up to $25,000/yr can offset ordinary (W-2) income if you actively participate and your MAGI is under $100k (phasing out to $0 by $150k); unused losses carry forward. On sale, claimed depreciation is recaptured at up to 25%, and gains may owe capital-gains tax (a 1031 exchange can defer both). Figures are a year-1 estimate at your 24.0% rate — not tax advice; consult a CPA.
Schools (NCES district)
- District
- Alpine District
- NCES district ID
- 4900030
- Math proficiency
- 45% ▼ -4.00%
- Reading proficiency
- 50% ▼ -2.00%
- Median HH income
- $68,595
- Composite
- 42.48/100
- National rank
- #3213
- State rank
- #25 of 80 in UT
Livability — Orem
- Score
- 86/100
- State rank
- #10
- US rank
- #389
Category grades
Schools grade is shown separately in the Schools card above.
Census & demographics
- Census place
- Orem, UT
- County
- Utah County · 661,754 people
- City population
- 94,197
- Metro
- Provo-Orem, UT
- Population (ZIP)
- 35,099
- Household income
- $74,553
- Rent vs Own
- Severe rent burden
- 1149.0
Population outlook (Utah County) Hauer SSP2
- Today (2025)
- 693,420 people
- By 2030
- 757,324 · +9.2%
- By 2040
- 893,178 · +28.8%
- By 2050
- 1,035,842 · +49.4%
- By 2075
- 1,376,733 · +98.5%
- By 2100
- 1,609,388 · +132.1%
Race, ethnicity, and origin ACS 2023
- Neighborhood character
- Predominantly White (72%)
- Race & ethnicity
- White 72% Hispanic / Latino 20% Two or more races 11% Asian 2% Black 1%
- Hispanic origin (detail)
- Mexican 11%
- Common ancestry
- Italian 4% Slovak 4% Portuguese 3%
- Foreign-born
- 15% · Canada, South Korea, Jamaica
- Languages at home
- 76% English-only · Spanish 18% Other Asian/Pacific 2% Other Indo-European 1%
Political lean MEDSL · Utah
- 2024 margin
- Solid R (+39.8) · D 28.5% · R 68.3% · Other 3.2%
- 2008→2024 swing
- +19.1pp toward D · 2008: -58.9pp · 2024: -39.8pp
- All cycles
- 2024: R+39.8 2020: R+41.0 2016: R+37.3 2012: R+78.5 2008: R+58.9
Not yet ingested
- Civics
- —
Market trends
- HPI YoY
- ▼ -318.60%
- Current HPI
- 292.9526
- Rent YoY
- ▲ 2.87%
- Metro
- Provo-Orem, UT
- State GDP YoY
- ▲ 3.54%
- F500 in state
- 2
Industry mix (Fortune 500 HQ in UT)
| Industry | F500 HQs | Revenue |
|---|---|---|
| Financial Services | 1 | $3B |
|
||
Price history
-17.7% since first listed11 events — show timeline
- 2026-01-28 Price Changed $139,900 WFRMLS
- 2025-10-01 Price Changed $149,900 WFRMLS
- 2025-09-16 Listed $159,900 WFRMLS
- 2023-10-16 Sold (MLS) — WFRMLS
- 2023-09-20 Contingent — WFRMLS
- 2023-09-19 Price Changed $139,000 WFRMLS
- 2023-09-13 Price Changed $145,000 WFRMLS
- 2023-08-26 Price Changed $155,000 WFRMLS
- 2023-08-26 Relisted — WFRMLS
- 2023-08-21 Contingent — WFRMLS
- 2023-08-14 Listed $170,000 WFRMLS
Cash-flow waterfall
monthlySold comps — $/sqft
last 12 mo · ≤1 miLoading sold comps…