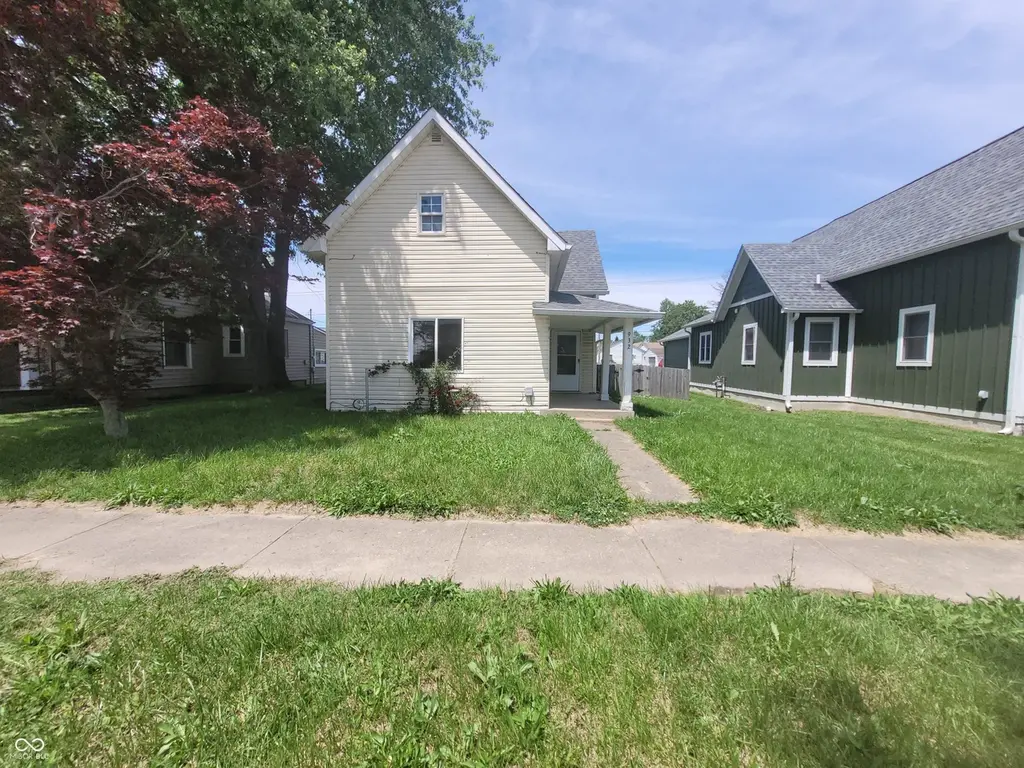
932 W Main St · Greenfield, IN
Flood risk 1/10 · Minimal
- FEMA flood zone
- X (unshaded)
- Chance of flooding over 30 yrs
- 0.0%
- Est. flood insurance / yr
- $507 – $1,088
Fire risk 1/10 · Minimal
- Est. fire insurance / yr
- $717 – $1,331
Heat risk 3/10 · Minor
- Hot days now (above 102°F)
- 7 days/yr
- Hot days in 30 yrs
- 18 days/yr
Wind risk 2/10 · Minimal
- Chance of severe wind over 30 yrs
- 1.0%
Air-quality risk 2/10 · Minimal
- Unhealthy air days now
- 1 days/yr
- Unhealthy air days in 30 yrs
- 2 days/yr
Risk factors via First Street. Map © Google.
Why this score? — see what drove the B grade
The composite is a weighted blend of 9 inputs, each scored 0–100. Each bar is that input's sub-score; the figure is the points it added to the 100-point composite (weight × sub-score).
- Cash flow +27.6/30.0
- ARV discount +15.0/15.0
- DSCR +9.7/10.0
- 1% rule +6.6/10.0
- Schools +4.0/10.0
- Livability +3.7/5.0
- Rent growth +3.2/5.0
- Condition / age +2.5/5.0
- Appreciation +0.0/10.0
$199,000
🖨 Deal sheet 📄 Offer letter ✓ Due diligence
Listing remarks MLS
Very nice updated home has a lot of space! Over 2000 Square Feet of living space. The roof is new as of April 2017. There are 3 bedrooms, 2 1/2 baths, large eat-in kitchen, laundry room and the master bedroom is on the main level. All appliances stay!
Key facts
- Large eat-in kitchen
- Laundry mud room
- Walk-in closet
Tags
Property features AI
Finance
- Other: Lot size about 0.14 acre (less than 1/4 acre); Low-maintenance lifestyle: No
Exterior
- Parking: Alley access; Gravel parking; No garage space
- Utilities: Public water; Municipal sewer connected; Electricity connected; Natural gas connected
- Home design: Single-family residence; Two levels; Property is a fixer
- Construction: Wood siding; Block foundation
- Exterior features: Covered patio/porch; Full yard fencing
Interior
- Kitchen: Electric cooktop; Eat-in kitchen
- Bedrooms: Three bedrooms total — one on the main level and two on the upper level
- Bathrooms: Two full bathrooms and one half bathroom; Primary bathroom is a suite
- Heating & cooling: Forced air heating (natural gas); Central air conditioning
- Interior features: Attic access; Eat-in kitchen; Walk-in closet(s); Smoke alarm
- Laundry & utility: Main-level laundry
Neighborhood map
What this means for you Summary
Snapshot
- This is a 4-bed/2.5-bath single-family listed at $199k.
Deal economics
- At list price, monthly cash flow is $596 ($7k/yr) — positive.
- The deal already cash-flows at list — no discount required.
- Meets the 1% rule at list price ($2k rent vs $199k).
- Recommended offer: $196k (1.5% below list) — sets the bar for market timing.
- Cap rate 9.9% vs local median 4.4% in Greenfield — top-decile yield for the area; either an underpriced asset or a hidden risk that comps aren't pricing in. Stress-test before assuming the spread holds.
Location & tenants
- Location reads 73/100 on livability (#88 in IN) — a middle-class / working-renter tenant base. Strengths: cost of living A+, housing A+; Watch: amenities F, commute F.
- Greenfield-Central Community Schools (other): math 47% / reading 45% proficiency, ranked #83 of 301 in IN (top 28%) — families likely to look elsewhere, expect single-tenant / working-renter base with shorter leases.
- Zoned schools: Greenfield-Central High School (math 37% / reading 65%, grade D+, #115 of 369 statewide, top 31%, 1,462 students, 35% FRL).
- Market conditions: Rents rising (+2.9%/yr); 481 active listings in the ZIP; 4 comparable units currently listed for rent nearby; rentals leasing fast (median 11d on market — plan ~1-2 weeks tenant-placement turnaround); solid renter incomes; 1,091 units permitted in Hancock County in 2024 (0 in 5+ unit buildings).
- This rent runs 33% of the median local income ($83k/yr) — at the standard rent-burdened threshold; future hikes will face affordability resistance.
Forward outlook
- Local home prices are declining (-3.0%/yr); year-one equity from $1k of loan paydown is wiped out by about $6k of value loss. Plan a longer hold.
- Hancock County population projected at +7% by 2050 — modest demand growth; plan on rents tracking national, not racing it.
- At projected returns (-3.0% appreciation + 2.9% rent growth), your $56k cash investment doubles in ~9 years — after that, you're playing with house money.
Negotiation context
- It's been on market 24 days — a 2% lower offer ($196k) is reasonable based on typical stale-listing flexibility.
- 8 sale attempts since 24y ago; this cycle's ask has dropped $16k (7%) from the opening price — seller is motivated, your offer sets the floor, not the list.
- Current owner paid $95k; list at $199k implies a 110% gain — meaningful room to come down on a strong offer.
Risks & watch-outs
- Watch-outs: built in 1900 — expect roof / HVAC / electrical / plumbing capex.
Questions for the listing agent
- Built in 1900 — when were the roof, HVAC, electrical panel, plumbing, and water heater last replaced?
- Is there a deadline driving the sale (1031 exchange, divorce, estate, relocation)? That informs how much negotiation room exists.
- Schools are B-rated — typically a magnet for longer-tenancy family renters. What's the average tenant stay here, and is there a school-zone premium baked into asking?
- What's the average days-on-market for RENTAL listings here right now (not sales)? A rising rental-DOM trend means longer vacancies and softer asking-rent achievability than the comps imply.
- What's the recent tenant-quality profile in this submarket — average credit score on applications, eviction rate, late-payment / NSF rate, and stable-employment percentage? A property-management company in the area should have these aggregated.
- How much new for-sale + rental construction is in the pipeline within 1–3 miles? Heavy new supply typically softens prices + rents 12–24 months out; constrained supply supports both.
Investment metrics
- 1% rule
- 1.16% ✓
- Cap rate
- 9.89%
- Cash-on-cash
- 12.84%
- DSCR
- 1.57
- GRM
- 7.2
CMA / ARV
- ARV (on-the-fly)
- $264,264
- Comps found
- 12
Show comp detail 12 sales within ~0.75 mi
| Address | Dist | Beds/Ba | Sqft | Sold | Price | $/sf | Match |
|---|---|---|---|---|---|---|---|
| 121 School St | 0.38mi | 3/2.0 (-1) | 2,245 (+3%) | 4mo | $55,000 | $24 | 67 |
| 450 Sedgewick Dr | 0.57mi | 4/2.5 | 2,306 (+6%) | 1mo | $302,000 | $131 | 63 |
| 272 Van Buren St | 0.62mi | 4/2.5 | 2,309 (+6%) | 13mo | $363,000 | $157 | 51 |
| 297 Van Buren St | 0.59mi | 3/2.5 (-1) | 2,043 (-6%) | 12mo | $285,000 | $140 | 47 |
| 421 W 4th St | 0.44mi | 3/2.5 (-1) | 1,989 (-9%) | 18mo | $148,500 | $75 | 45 |
| 705 Wilson St | 0.50mi | 3/2.0 (-1) | 1,897 (-13%) | 4mo | $230,000 | $121 | 45 |
| 613 W Fourth St | 0.35mi | 5/2.5 (+1) | 2,426 (+11%) | 21mo | $270,000 | $111 | 43 |
| 253 W Fifth St | 0.56mi | 3/1.5 (-1) | 2,248 (+3%) | 21mo | $193,000 | $86 | 42 |
| 212 Walnut St | 0.61mi | 3/2.0 (-1) | 2,018 (-8%) | 12mo | $215,000 | $107 | 42 |
| 681 Sedgewick Ln | 0.66mi | 3/2.5 (-1) | 2,026 (-7%) | 17mo | $237,000 | $117 | 38 |
| 227 W South St | 0.56mi | 3/2.0 (-1) | 1,955 (-10%) | 14mo | $250,000 | $128 | 37 |
| 419 Old Glory Dr | 0.73mi | 3/2.5 (-1) | 1,926 (-12%) | 12mo | $305,000 | $158 | 32 |
Match score weights: distance 35% · size 25% · config 20% · recency 20%. Top-matched comps best support the ARV.
Projected returns pro-forma
-3.0% appreciation · 2.88% rent growth · sell at horizon
- IRR
- 2.5%
- Equity multiple
- 1.10×
- Total profit
- $5,376
- Equity at exit
- $29,672
- IRR
- 12.0%
- Equity multiple
- 1.94×
- Total profit
- $52,188
- Equity at exit
- $17,206
Cash invested: $55,720 (down + closing). Projections, not guarantees.
Landlord ↔ Tenant lean methodology
- Overall (STATE)
- 90 Strongly Landlord-Friendly
- State Indiana
- 90 Strongly Landlord-Friendly · R+11
- County
- — inherits STATE
- City
- — inherits STATE
ZIP-level market 46140
- Rents YoY
- 2.9%
- Active inventory
- 481
- Price-to-rent
- 7.2×
Monthly cashflow live
- Estimated rent
- $2,306 medium interval (Pro) →
- Mortgage (P&I)
- −$1,044
- Tax from tax record
- −$99 /mo · $1,188/yr
- Insurance
- −$83
- HOA
- −$0
- Vacancy / Maint / Mgmt
- −$484
- Net cashflow
- $596
Break-even live
UW: 25.0% down · 7.5% · 30yr · 1.5% tax · 5.0% vac · 8.0% maint · 8.0% mgmt
Financing live
Cash to close
- Down payment
- $49,750
- Closing costs
- $5,970
- Reserves months
- —
- Total cash needed
- —
Loan-product check · same deal, 3 products live
Conventional
25% down · 7.5% · 30yr
- Down + closing
- —
- Monthly P&I
- —
- Monthly cashflow
- —
- DSCR
- —
- Eligible?
- —
Personal DTI + credit; lowest rate.
DSCR
20% down · 8.5% · 30yr
- Down + closing
- —
- Monthly P&I
- —
- Monthly cashflow
- —
- DSCR
- —
- Eligible?
- —
No personal income docs; deal must DSCR.
Hard money
10% down · 12.0% · 12mo
- Down + closing
- —
- Monthly P&I
- —
- Monthly cashflow
- —
- DSCR
- —
- Eligible?
- —
Short-term bridge; refi at stabilization.
Rent comps 4 comps
| Address | Beds | Baths | Sqft | Rent | $/sqft | DOM | Units | Dist |
|---|---|---|---|---|---|---|---|---|
| 683 Horsetail Dr Greenfield, IN | 5.0 | 3.0 | 2600 | $2,379 | $0.92 | 14d | 1 | 0.49mi |
| 968 Lotus Dr Greenfield, IN | 3.0–5.0 | 2.0–3.0 | 2049 | $2,245 | $1.10 | 1d | 8 | 0.53mi |
| 876 Marsh Aster Dr Greenfield, IN | 4.0 | 2.0 | 1771 | $2,245 | $1.27 | 10d | 1 | 0.60mi |
| 713 Cattail Dr Greenfield, IN | 3.0 | 2.0 | 1498 | $2,045 | $1.37 | 3d | 1 | 0.63mi |
Listing history 34 events
-
2026-06-19status $199,000 Pending 24 DOM
-
2026-06-18days on market $199,000 Active 24 DOM
-
2026-06-17days on market $199,000 Active 23 DOM
-
2026-06-16days on market $199,000 Active 22 DOM
-
2026-06-15pricedays on market $199,000 Active 21 DOM
-
2026-06-13days on market $215,000 Active 19 DOM
-
2026-06-13days on market $215,000 Active 18 DOM
-
2026-06-09days on market $215,000 Active 15 DOM
-
2026-06-08days on market $215,000 Active 14 DOM
-
2026-06-07days on market $215,000 Active 13 DOM
-
2026-06-05days on market $215,000 Active 10 DOM
-
2026-06-03days on market $215,000 Active 9 DOM
-
2026-06-02days on market $215,000 Active 8 DOM
-
2026-06-01days on market $215,000 Active 7 DOM
-
2026-05-31days on market $215,000 Active 6 DOM
-
2026-05-23$215,000 Active
-
2017-06-23soldstatus $94,900 Sold 251-char remark
Show marketing remark (251 chars)
Very nice updated home has a lot of space! Over 2000 Square Feet of living space. The roof is new as of April 2017. There are 3 bedrooms, 2 1/2 baths, large eat-in kitchen, laundry room and the master bedroom is on the main level. All appliances stay!
-
2017-05-24price $94,900 251-char remark
Show marketing remark (251 chars)
Very nice updated home has a lot of space! Over 2000 Square Feet of living space. The roof is new as of April 2017. There are 3 bedrooms, 2 1/2 baths, large eat-in kitchen, laundry room and the master bedroom is on the main level. All appliances stay!
-
2017-05-24status Pending 251-char remark
Show marketing remark (251 chars)
Very nice updated home has a lot of space! Over 2000 Square Feet of living space. The roof is new as of April 2017. There are 3 bedrooms, 2 1/2 baths, large eat-in kitchen, laundry room and the master bedroom is on the main level. All appliances stay!
-
2017-05-08price $99,900 251-char remark
Show marketing remark (251 chars)
Very nice updated home has a lot of space! Over 2000 Square Feet of living space. The roof is new as of April 2017. There are 3 bedrooms, 2 1/2 baths, large eat-in kitchen, laundry room and the master bedroom is on the main level. All appliances stay!
-
2017-05-03$109,900 Active 251-char remark
Show marketing remark (251 chars)
Very nice updated home has a lot of space! Over 2000 Square Feet of living space. The roof is new as of April 2017. There are 3 bedrooms, 2 1/2 baths, large eat-in kitchen, laundry room and the master bedroom is on the main level. All appliances stay!
-
2010-05-28historical 43-char remark
Show marketing remark (43 chars)
Quaint updated home in heart of Greenfield.
-
2010-05-24soldstatus $39,000 43-char remark
Show marketing remark (43 chars)
Quaint updated home in heart of Greenfield.
-
2010-02-01$39,900 43-char remark
Show marketing remark (43 chars)
Quaint updated home in heart of Greenfield.
-
2010-01-01historical
-
2009-05-27$49,900
-
2008-09-05soldstatus $92,500
-
2008-04-09$89,900
-
2007-11-12soldstatus $20,000
-
2007-05-03$39,900
-
2003-11-25soldstatus $36,000
-
2003-09-17$39,900
-
2003-05-20historical
-
2002-11-26$59,000
ⓘ Source: listings_history table (triggers on properties + properties_extension) + one-shot
backfill from property_details.listing_events for pre-trigger history.
Tax reassessment forecast IN · Partial reset (capped growth)
- Current annual tax
- $1,188 · $99/mo
- Projected year-2 tax
- $1,440 · $120/mo
- Expected delta
- +$252/yr (+$21/mo · 21.2%)
ⓘ Screening estimate from a state-policy table — verify with the county assessor before closing.
Climate risk First Street
- Flood 1/10 Low FEMA zone X (unshaded) · 0% chance over 30 yrs
- Wildfire 1/10 Low
- Heat 3/10 Moderate 7 d/yr ≥102°F today · 18 d/yr by 30 yrs out
- Wind 2/10 Low 100% chance of damaging wind over 30 yrs
- Air quality 2/10 Low 1 unhealthy d/yr today · 2 by 30 yrs out
Nearby sold comps map
Loading sold comps map…
Walkable amenities ~0.75 mi
Loading nearby amenities…
Taxation est. · year 1
- Rental income
- $27,668
- − Mortgage interest
- −$11,147
- − Property taxes
- −$1,188
- − Insurance
- −$995
- − Repairs & maintenance
- −$2,213
- − Management
- −$2,213
- − Depreciation
- −$5,789
- Taxable income
- $4,122
- Est. tax owed @ 24.0%
- −$989
- After-tax cash flow
- $6,162/yr
For passive investors: Depreciation is non-cash, so a rental often shows a tax loss while cash-flowing — sheltering income. Rental losses are passive: they offset passive income freely, and up to $25,000/yr can offset ordinary (W-2) income if you actively participate and your MAGI is under $100k (phasing out to $0 by $150k); unused losses carry forward. On sale, claimed depreciation is recaptured at up to 25%, and gains may owe capital-gains tax (a 1031 exchange can defer both). Figures are a year-1 estimate at your 24.0% rate — not tax advice; consult a CPA.
Schools (NCES district)
- District
- Greenfield-Central Community Schools
- NCES district ID
- 1804050
- Math proficiency
- 47% ▼ -12.00%
- Reading proficiency
- 45% ▼ -11.00%
- Median HH income
- $55,533
- Composite
- 40.01/100
- National rank
- #3827
- State rank
- #83 of 301 in IN
Livability — Greenfield
- Score
- 73/100
- State rank
- #88
- US rank
- #5094
Category grades
Schools grade is shown separately in the Schools card above.
Census & demographics
- Census place
- Greenfield, IN
- County
- Hancock County · 59,521 people
- City population
- 43,511
- Metro
- Indianapolis-Carmel-Anderson, IN
- Population (ZIP)
- 43,511
- Household income
- $83,056
- Rent vs Own
- Severe rent burden
- 795.0
Population outlook (Hancock County) Hauer SSP2
- Today (2025)
- 77,820 people
- By 2030
- 79,914 · +2.7%
- By 2040
- 82,734 · +6.3%
- By 2050
- 83,348 · +7.1%
- By 2075
- 82,439 · +5.9%
- By 2100
- 74,181 · -4.7%
Race, ethnicity, and origin ACS 2023
- Neighborhood character
- Predominantly White (92%)
- Race & ethnicity
- White 92% Two or more races 5% Hispanic / Latino 3% Black 1%
- Common ancestry
- Italian 3% Lithuanian 3% Slovak 1%
- Foreign-born
- 3% · Canada
- Languages at home
- 96% English-only · Spanish 2% Other Indo-European 1%
Political lean MEDSL · Hancock
- 2024 margin
- Solid R (+33.7) · D 32.2% · R 65.9% · Other 1.9%
- 2008→2024 swing
- -4.1pp toward R · 2008: -29.6pp · 2024: -33.7pp
- All cycles
- 2024: R+33.7 2020: R+37.5 2016: R+44.8 2012: R+41.0 2008: R+29.6
Not yet ingested
- Civics
- —
Market trends
- HPI YoY
- ▼ -131.67%
- Current HPI
- 225.0367
- Rent YoY
- ▲ 2.88%
- Metro
- Indianapolis-Carmel-Anderson, IN
- State GDP YoY
- ▲ 2.90%
- F500 in state
- 18
Industry mix (Fortune 500 HQ in IN)
| Industry | F500 HQs | Revenue |
|---|---|---|
| Industrial Machinery | 2 | $37B |
|
||
| Healthcare | 1 | $177B |
|
||
| Pharmaceuticals | 1 | $45B |
|
||
| Metals / Steel | 1 | $18B |
|
||
| Agriculture | 1 | $17B |
|
||
| Packaging | 1 | $12B |
|
||
Price history
+264.4% since first listed19 events — show timeline
- 2026-05-23 Listed $215,000 MIBOR as Distributed by MLS Grid
- 2017-06-23 Sold (MLS) $94,900 MIBOR as Distributed by MLS Grid
- 2017-05-24 Price Changed $94,900 MIBOR as Distributed by MLS Grid
- 2017-05-24 Pending — MIBOR as Distributed by MLS Grid
- 2017-05-08 Price Changed $99,900 MIBOR as Distributed by MLS Grid
- 2017-05-03 Listed $109,900 MIBOR as Distributed by MLS Grid
- 2010-05-28 Listing Removed — MIBOR as Distributed by MLS Grid
- 2010-05-24 Sold (MLS) $39,000 MIBOR as Distributed by MLS Grid
- 2010-02-01 Listed $39,900 MIBOR as Distributed by MLS Grid
- 2010-01-01 Listing Removed — MIBOR as Distributed by MLS Grid
- 2009-05-27 Listed $49,900 MIBOR as Distributed by MLS Grid
- 2008-09-05 Sold (MLS) $92,500 MIBOR as Distributed by MLS Grid
- 2008-04-09 Listed $89,900 MIBOR as Distributed by MLS Grid
- 2007-11-12 Sold (MLS) $20,000 MIBOR as Distributed by MLS Grid
- 2007-05-03 Listed $39,900 MIBOR as Distributed by MLS Grid
- 2003-11-25 Sold (MLS) $36,000 MIBOR as Distributed by MLS Grid
- 2003-09-17 Listed $39,900 MIBOR as Distributed by MLS Grid
- 2003-05-20 Listing Removed — MIBOR as Distributed by MLS Grid
- 2002-11-26 Listed $59,000 MIBOR as Distributed by MLS Grid
Property tax history
-1.4%/yrLatest (2025): $1,188 · -18.7% YoY. Source: county tax records.
Cash-flow waterfall
monthlySold comps — $/sqft
last 12 mo · ≤1 miLoading sold comps…