 Multi-family
930 Baker St · San Francisco, CA
Flood risk 1/10 · Minimal
- FEMA flood zone
- X (unshaded)
- Chance of flooding over 30 yrs
- 0.0%
- Est. flood insurance / yr
- $507 – $1,088
Fire risk 1/10 · Minimal
- Est. fire insurance / yr
- $659 – $1,223
Heat risk 2/10 · Minimal
- Hot days now (above 78°F)
- 7 days/yr
- Hot days in 30 yrs
- 17 days/yr
Wind risk 1/10 · Minimal
- Chance of severe wind over 30 yrs
- —
Air-quality risk 8/10 · Major
- Unhealthy air days now
- 15 days/yr
- Unhealthy air days in 30 yrs
- 15 days/yr
Risk factors via First Street. Map © Google.
Why this score? — see what drove the D- grade
The composite is a weighted blend of 9 inputs, each scored 0–100. Each bar is that input's sub-score; the figure is the points it added to the 100-point composite (weight × sub-score).
- Appreciation +9.3/10.0
- ARV discount +7.5/15.0
- Rent growth +5.0/5.0
- Schools +5.0/10.0
- Condition / age +4.8/5.0
- Livability +3.8/5.0
- Cash flow +0.0/30.0
- 1% rule +0.0/10.0
- DSCR +0.0/10.0
$2,995,000
🖨 Deal sheet 📄 Offer letter ✓ Due diligence
Multi-family units
County records classify this as Multi-Family (2-4 Unit). Listing-text estimate: 1 unit. estimate disagrees with records
Listing remarks MLS
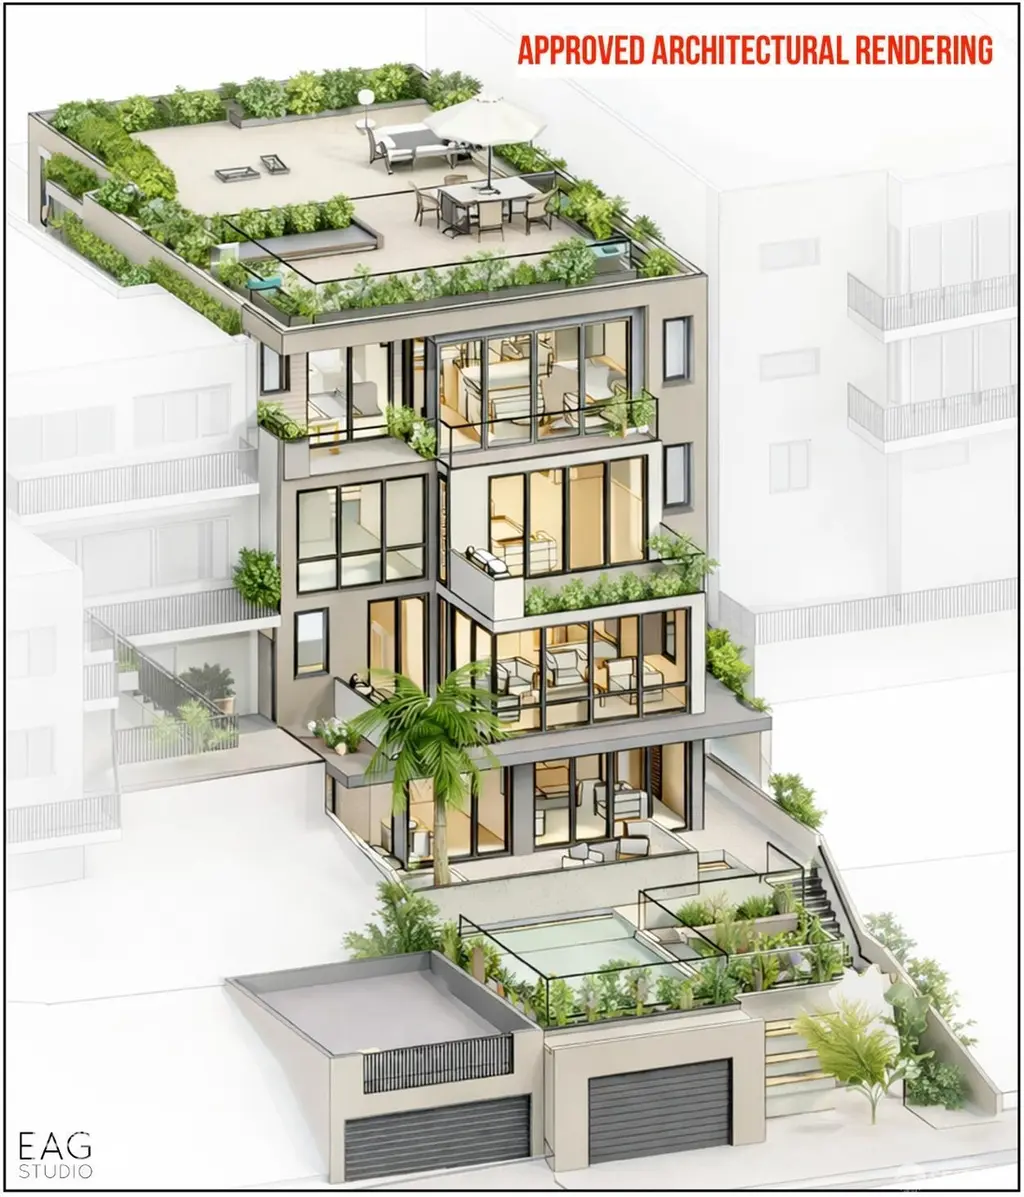
A rare opportunity to create something extraordinary in one of San Francisco's most dynamic locations. This fully permitted development site offers a street-to-street lot! Exceptional panoramic downtown views that capture the energy of the city skyline. Approved plans allow for a striking new residential building of up to 8,000+ square feet and up to four units. This is Shovel Ready - the ideal project for a developer seeking scale, location, and architectural impact. The project has been thoughtfully envisioned with design by EAG Studios and Vincent Leger, one of the most dynamic and creative architecture and design firms shaping the modern San Francisco landscape. Their vision elevates the property with bold architecture and refined urban living concepts that maximize light, views, and the unique street-to-street orientation. Positioned just blocks from the University of San Francisco, Kaiser Permanente Medical Center and Golden Gate Park. For developers seeking a distinctive site with scale, design pedigree, and city views, this is your time. Note to developers . .. there is more than $2 Trillion dollars in market capital coming into SF in the next 2 years with huge tech IPO's Lets go San Francisco!
Key facts
- Street-to-street lot
- Approved plans
- Architectural impact
Tags
Neighborhood map
What this means for you Summary
Snapshot
- This is a 8-bed/10.0-bath multifamily listed at $3.00M. Condition is rated excellent.
Deal economics
- At list price, monthly cash flow is $-15k ($-182k/yr) — negative.
- To cash-flow at today's rent, offer at most $805k (73.1% below list).
- To meet the 1% rule (rent ≥ 1% of price), the offer needs to be $704k (76.5% below list).
- Recommended offer: $704k (76.5% below list) — sets the bar for 1% rule.
- Cap rate 0.2% vs local median 2.1% in San Francisco — below-typical yield; the buyer is paying a premium for something (appreciation thesis, condition, location) that the cap rate doesn't capture.
Location & tenants
- Location reads 76/100 on livability (#90 in CA, #3,143 nationally) — a middle-class / working-renter tenant base. Strengths: amenities A+, commute A+, employment A+; Watch: crime F, cost of living F.
- San Francisco Unified (urban): math 50% / reading 56% proficiency, ranked #322 of 1,400 in CA (top 23%) — acceptable for families but not a draw, mixed tenant base, ~2y average lease.
- Market conditions: Rents rising fast (+20.6%/yr); 61 active listings in the ZIP; high-income renter base; 750 units permitted in San Francisco County in 2024 (688 in 5+ unit buildings).
- At $7,044/mo this rent would consume 56% of the median local household income ($152k/yr) (locally 2151% of renters already pay >50% of income on rent) — very limited rent-growth headroom before tenants either downsize or default.
Forward outlook
- In year one you build about $276k of equity ($21k loan paydown + $255k appreciation (8.5% local appreciation)).
- San Francisco County population projected at +39% by 2050 — long-run rental-demand tailwind backs the buy-and-hold thesis.
- By year 2, paydown + projected appreciation supports a ~$442k cash-out refi (75% LTV) — recoverable capital for the next deal without selling this one.
Negotiation context
- It's been on market 95 days — a 9% lower offer ($2.73M) is reasonable based on typical stale-listing flexibility.
- 3 sale attempts since 23y ago with the ask held roughly flat each time — persistent listings suggest the price (not the market) is what's stuck; bring a comps-based counter.
- Current owner paid $1.10M; list at $3.00M implies a 172% gain — meaningful room to come down on a strong offer.
Questions for the listing agent
- What do current leases actually rent for vs. the listed asking? Can we see a recent rent roll and the last 12 months of T-12 income?
- It's been on market 95 days. Have you received any prior offers? Is the seller open to a 76% concession, seller financing, or rate buy-down credit?
- Why hasn't it sold? Are there any deal-killer items the seller is aware of (foundation, flood, title, zoning, code violations)?
- Is there a deadline driving the sale (1031 exchange, divorce, estate, relocation)? That informs how much negotiation room exists.
- Schools are B-rated — typically a magnet for longer-tenancy family renters. What's the average tenant stay here, and is there a school-zone premium baked into asking?
- Crime grade is F in this area — have there been break-ins, vandalism, or insurance claims at this property in the last 3 years? What carrier currently insures it and at what premium?
- The area grade is low — what's the realistic commute time and amenity access for the typical tenant pool here? Any planned neighborhood developments (good or bad) we should know about?
- What's the average days-on-market for RENTAL listings here right now (not sales)? A rising rental-DOM trend means longer vacancies and softer asking-rent achievability than the comps imply.
- What's the recent tenant-quality profile in this submarket — average credit score on applications, eviction rate, late-payment / NSF rate, and stable-employment percentage? A property-management company in the area should have these aggregated.
- How much new apartment / multifamily construction is in the pipeline within 1–3 miles? Heavy new supply (>2% of stock underway) typically softens rents 12–24 months out; light construction supports rent growth.
Investment metrics
- 1% rule
- 0.24% ✗
- Cap rate
- 0.23%
- Cash-on-cash
- -21.65%
- DSCR
- 0.04
- GRM
- 35.4
CMA / ARV
- ARV (median comp)
- $8,556,217
- List price
- $2,995,000
- Delta
- -65.00%
- Verdict
- UNDERPRICED
- Comps
- 5 within 1.0 mi
Projected returns pro-forma
8.52% appreciation · 8.0% rent growth · sell at horizon
- IRR
- 6.1%
- Equity multiple
- 1.49×
- Total profit
- $407,031
- Equity at exit
- $2,381,491
- IRR
- 8.9%
- Equity multiple
- 3.38×
- Total profit
- $1,998,276
- Equity at exit
- $4,832,193
Cash invested: $838,600 (down + closing). Projections, not guarantees.
Landlord ↔ Tenant lean methodology
- Overall (CITY)
- 0 Strongly Tenant-Friendly
- State California
- 18 Strongly Tenant-Friendly · D+13
- County
- — inherits STATE
- City San Francisco
- 0 Strongly Tenant-Friendly · D+57
ZIP-level market 94115
- Home prices YoY
- 3.9%
- Rents YoY
- 20.6%
- Active inventory
- 61
- Price-to-rent
- 35.4×
Monthly cashflow live
- Estimated rent
- $7,044 medium interval (Pro) →
- Mortgage (P&I)
- −$15,706
- Tax est. 1.5%
- −$3,744 /mo · $44,925/yr
- Insurance
- −$1,248
- HOA
- −$0
- Vacancy / Maint / Mgmt
- −$1,479
- Net cashflow
- $-15,133
Break-even live
UW: 25.0% down · 7.5% · 30yr · 1.5% tax · 5.0% vac · 8.0% maint · 8.0% mgmt
Financing live
Cash to close
- Down payment
- $748,750
- Closing costs
- $89,850
- Reserves months
- —
- Total cash needed
- —
Loan-product check · same deal, 3 products live
Conventional
25% down · 7.5% · 30yr
- Down + closing
- —
- Monthly P&I
- —
- Monthly cashflow
- —
- DSCR
- —
- Eligible?
- —
Personal DTI + credit; lowest rate.
DSCR
20% down · 8.5% · 30yr
- Down + closing
- —
- Monthly P&I
- —
- Monthly cashflow
- —
- DSCR
- —
- Eligible?
- —
No personal income docs; deal must DSCR.
Hard money
10% down · 12.0% · 12mo
- Down + closing
- —
- Monthly P&I
- —
- Monthly cashflow
- —
- DSCR
- —
- Eligible?
- —
Short-term bridge; refi at stabilization.
Listing history 19 events
-
2026-06-18days on market $2,995,000 Active 95 DOM
-
2026-06-17days on market $2,995,000 Active 94 DOM
-
2026-06-16days on market $2,995,000 Active 93 DOM
-
2026-06-15days on market $2,995,000 Active 92 DOM
-
2026-06-13days on market $2,995,000 Active 90 DOM
-
2026-06-13days on market $2,995,000 Active 89 DOM
-
2026-06-09days on market $2,995,000 Active 86 DOM
-
2026-06-08days on market $2,995,000 Active 85 DOM
-
2026-06-07days on market $2,995,000 Active 84 DOM
-
2026-06-04days on market $2,995,000 Active 81 DOM
-
2026-06-03days on market $2,995,000 Active 80 DOM
-
2026-06-02days on market $2,995,000 Active 79 DOM
-
2026-06-01days on market $2,995,000 Active 78 DOM
-
2026-05-31days on market $2,995,000 Active 77 DOM
-
2026-03-15$2,995,000 Active 1222-char remark
Show marketing remark (1222 chars)
A rare opportunity to create something extraordinary in one of San Francisco's most dynamic locations. This fully permitted development site offers a street-to-street lot! Exceptional panoramic downtown views that capture the energy of the city skyline. Approved plans allow for a striking new residential building of up to 8,000+ square feet and up to four units. This is Shovel Ready - the ideal project for a developer seeking scale, location, and architectural impact. The project has been thoughtfully envisioned with design by EAG Studios and Vincent Leger, one of the most dynamic and creative architecture and design firms shaping the modern San Francisco landscape. Their vision elevates the property with bold architecture and refined urban living concepts that maximize light, views, and the unique street-to-street orientation. Positioned just blocks from the University of San Francisco, Kaiser Permanente Medical Center and Golden Gate Park. For developers seeking a distinctive site with scale, design pedigree, and city views, this is your time. Note to developers . .. there is more than $2 Trillion dollars in market capital coming into SF in the next 2 years with huge tech IPO's Lets go San Francisco!
-
2003-11-14soldstatus $1,100,000
-
2003-10-01historical
-
2003-07-01$1,199,000
-
2003-02-26$1,199,000
ⓘ Source: listings_history table (triggers on properties + properties_extension) + one-shot
backfill from property_details.listing_events for pre-trigger history.
Climate risk First Street
- Flood 1/10 Low FEMA zone X (unshaded) · 0% chance over 30 yrs
- Wildfire 1/10 Low
- Heat 2/10 Low 7 d/yr ≥78°F today · 17 d/yr by 30 yrs out
- Wind 1/10 Low
- Air quality 8/10 Severe 15 unhealthy d/yr today · 15 by 30 yrs out
Nearby sold comps map
Loading sold comps map…
Walkable amenities ~0.75 mi
Loading nearby amenities…
Taxation est. · year 1
- Rental income
- $84,531
- − Mortgage interest
- −$167,767
- − Property taxes
- −$44,925
- − Insurance
- −$14,975
- − Repairs & maintenance
- −$6,762
- − Management
- −$6,762
- − Depreciation
- −$87,127
- Taxable loss
- −$243,788
- Est. tax savings @ 24.0%
- +$58,509
- After-tax cash flow
- $-123,085/yr
For passive investors: Depreciation is non-cash, so a rental often shows a tax loss while cash-flowing — sheltering income. Rental losses are passive: they offset passive income freely, and up to $25,000/yr can offset ordinary (W-2) income if you actively participate and your MAGI is under $100k (phasing out to $0 by $150k); unused losses carry forward. On sale, claimed depreciation is recaptured at up to 25%, and gains may owe capital-gains tax (a 1031 exchange can defer both). Figures are a year-1 estimate at your 24.0% rate — not tax advice; consult a CPA.
Condition & rehab AI · 8 photos
This multi-family property is in excellent condition with no visible repairs needed. The approved architectural rendering suggests a high-end renovation with a great location and panoramic views.
Value-add opportunities
- Both Landscaping enhancement — Aesthetic improvements can enhance curb appeal and property value
- Both Interior paint touch-up — Fresh paint can make the interior look more inviting and modern
- Both Window cleaning — Clean windows can improve natural light and make the home appear more spacious
Renovation cost estimate screening
Value-add ROI direction
- Both Landscaping enhancement — Aesthetic improvements can enhance curb appeal and property value ↑
- Both Interior paint touch-up — Fresh paint can make the interior look more inviting and modern ↑
- Both Window cleaning — Clean windows can improve natural light and make the home appear more spacious ↑
ⓘ Cost ranges are severity-bucket heuristics (US national rule-of-thumb). Get contractor quotes + a written scope before underwriting a rehab budget.
Schools (NCES district)
- District
- San Francisco Unified
- NCES district ID
- 0634410
- Math proficiency
- 50% ▬ 0.00%
- Reading proficiency
- 56% ▲ 1.00%
- Median HH income
- $81,249
- Composite
- 50.14/100
- National rank
- #4088
- State rank
- #322 of 1400 in CA
Livability — San Francisco
- Score
- 76/100
- State rank
- #90
- US rank
- #3143
Category grades
Schools grade is shown separately in the Schools card above.
Census & demographics
- Census place
- San Francisco, CA
- County
- San Francisco County · 827,552 people
- City population
- 827,552
- Metro
- San Francisco-Oakland-Berkeley, CA
- Population (ZIP)
- 32,629
- Household income
- $151,524
- Rent vs Own
- Severe rent burden
- 2151.0
Population outlook (San Francisco County) Hauer SSP2
- Today (2025)
- 1,030,936 people
- By 2030
- 1,110,409 · +7.7%
- By 2040
- 1,270,010 · +23.2%
- By 2050
- 1,435,001 · +39.2%
- By 2075
- 1,779,074 · +72.6%
- By 2100
- 1,966,767 · +90.8%
Race, ethnicity, and origin ACS 2023
- Neighborhood character
- Diverse neighborhood (Simpson 0.70)
- Race & ethnicity
- White 49% Asian 20% Two or more races 11% Hispanic / Latino 11% Black 10%
- Hispanic origin (detail)
- Mexican 6%
- Common ancestry
- Scotch-Irish 3% Romanian 3% Lithuanian 3%
- Foreign-born
- 26% · Canada, China, South Korea
- Languages at home
- 71% English-only · Spanish 6% Chinese 5% Russian/Polish/Slavic 3%
Political lean MEDSL · San Francisco
- 2024 margin
- Solid D (+64.8) · D 80.3% · R 15.5% · Other 4.1%
- 2008→2024 swing
- -5.7pp toward R · 2008: 70.5pp · 2024: 64.8pp
- All cycles
- 2024: D+64.8 2020: D+72.5 2016: D+76.1 2012: D+70.2 2008: D+70.5
Not yet ingested
- Civics
- —
Market trends
- HPI YoY
- ▲ 8.52%
- Current HPI
- 224.7175
- Rent YoY
- ▲ 20.62%
- Metro
- San Francisco-Oakland-Berkeley, CA
- State GDP YoY
- ▲ 3.21%
- F500 in state
- 116
Industry mix (Fortune 500 HQ in CA)
| Industry | F500 HQs | Revenue |
|---|---|---|
| Technology | 27 | $1,492B |
|
||
| Financial Services | 3 | $174B |
|
||
| Retail | 3 | $44B |
|
||
| Insurance | 3 | $26B |
|
||
| Media / Entertainment | 2 | $115B |
|
||
| Pharmaceuticals / Biotech | 2 | $62B |
|
||
Price history
+149.8% since first listed5 events — show timeline
- 2026-03-15 Listed $2,995,000 San Francisco MLS
- 2003-11-14 Sold (MLS) $1,100,000 San Francisco MLS
- 2003-10-01 Delisted — San Francisco MLS
- 2003-07-01 Listed $1,199,000 San Francisco MLS
- 2003-02-26 Listed $1,199,000 San Francisco MLS
Cash-flow waterfall
monthlySold comps — $/sqft
last 12 mo · ≤1 miLoading sold comps…