 7-Plex
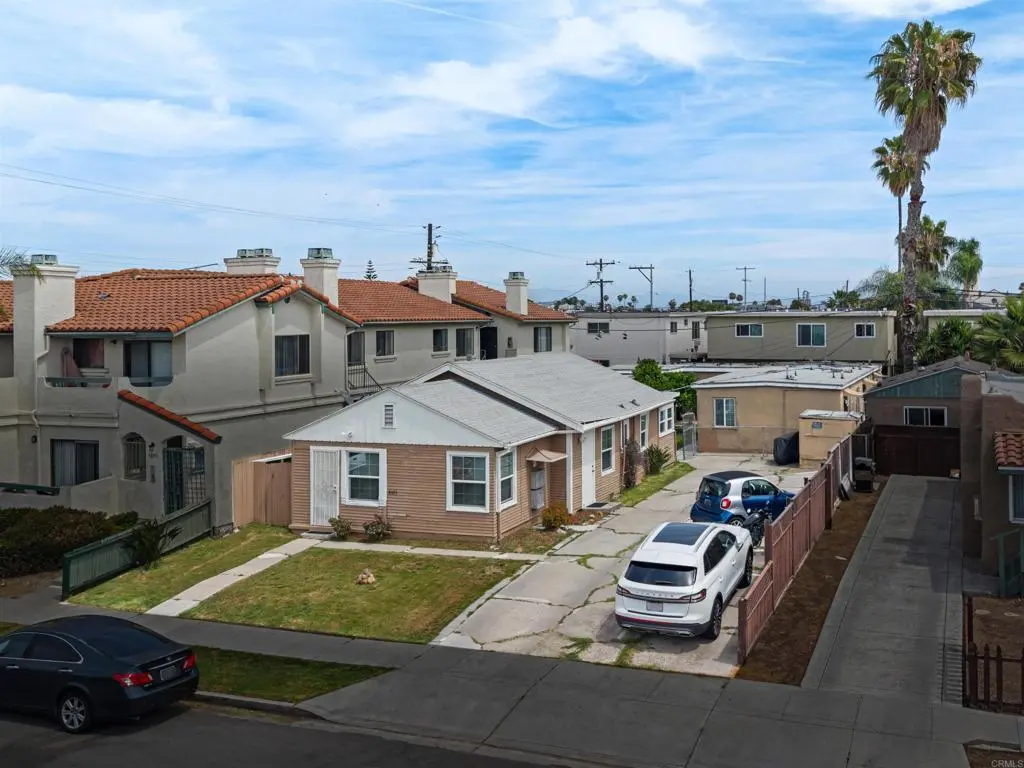
4669-73 Felton St · San Diego, CA
Flood risk 1/10 · Minimal
- FEMA flood zone
- X (unshaded)
- Chance of flooding over 30 yrs
- 0.0%
- Est. flood insurance / yr
- $507 – $1,088
Fire risk 1/10 · Minimal
- Est. fire insurance / yr
- $659 – $1,223
Heat risk 4/10 · Minor
- Hot days now (above 89°F)
- 7 days/yr
- Hot days in 30 yrs
- 20 days/yr
Wind risk 1/10 · Minimal
- Chance of severe wind over 30 yrs
- —
Air-quality risk 3/10 · Minor
- Unhealthy air days now
- 4 days/yr
- Unhealthy air days in 30 yrs
- 4 days/yr
Risk factors via First Street. Map © Google.
Why this score? — see what drove the B- grade
The composite is a weighted blend of 9 inputs, each scored 0–100. Each bar is that input's sub-score; the figure is the points it added to the 100-point composite (weight × sub-score).
- Cash flow +29.7/30.0
- DSCR +10.0/10.0
- 1% rule +8.3/10.0
- ARV discount +7.5/15.0
- Livability +3.8/5.0
- Rent growth +3.0/5.0
- Schools +2.2/10.0
- Condition / age +2.2/5.0
- Appreciation +0.0/10.0
$1,595,000
🖨 Deal sheet 📄 Offer letter ✓ Due diligence
Multi-family units
County records classify this as Multi-Family (5+ Unit). Listing-text estimate: 7 units. confirmed
5+ unit building — per-unit beds/baths from public records are typically unavailable; the breakdown below (if shown) is an estimate from the listing text.
Listing remarks
We are pleased to present Felton St Apartment Homes, a 7-unit multifamily property featuring 5 legal units and 2 nonconforming bonus units, strategically located at 4669–4673 Felton Street in San Diego, California. Unit mix is (4) Studios, (2) 1bed/1bath, & (1) 2bed/1bath. Just steps from the iconic Normal Heights Sign and the vibrant Adams Avenue corridor, the property benefits from immediate access to a dynamic mix of local dining, nightlife, and daily conveniences. This prime location consistently attracts strong tenant demand driven by its central proximity to Downtown San Diego, major employment hubs, and surrounding lifestyle neighborhoods like North Park and Kensington. Th
Key facts
- 5 legal units
- Prime location
- 7,149 sq ft lot
Tags
Property features AI
Finance
- Other: Property contains 5 total units across 3 buildings; 7 units currently leased; Zoning: RM-1-2
- Financial info: Total building area reported (2,964); Total actual rent $10,495; Gross scheduled/gross income $125,940; Net operating income $76,331; Total expenses $49,609 (includes insurance, water/sewer, trash, taxes); Insurance expense $6,000; Water/Sewer expense $2,148; Trash expense $4,560; New taxes expense $21,256; Rent control applies; Buyer to assume assessments
- HOA & community: Community features: Biking
Exterior
- Parking:
- Security:
- Utilities: Public sewer; Multiple separate gas and electric meters (5 each); Single separate water meter
- Home design: Attached property; Single-story
- Construction: Year built estimated
- Exterior features: No pool; Garden
Interior
- Kitchen:
- Bedrooms: One 2-bedroom unit; Two 1-bedroom units; Two 1-bedroom units inferred from unit counts
- Flooring:
- Bathrooms: Units include one bath each
- Heating & cooling:
- Interior features: Entry at first level; Community laundry
- Laundry & utility: Community laundry
Neighborhood map
What this means for you Summary
Snapshot
- This is a 7 × 4-bed/7.0-bath units multifamily listed at $1.59M. Condition is rated fair.
Deal economics
- At list price, monthly cash flow is $6k ($70k/yr) — positive. Per door: $827/mo.
- The deal already cash-flows at list — no discount required.
- Meets the 1% rule at list price ($21k rent vs $1.59M).
- Recommended offer: $1.50M (6.0% below list) — sets the bar for market timing.
- Cap rate 10.7% vs local median 2.0% in San Diego — top-decile yield for the area; either an underpriced asset or a hidden risk that comps aren't pricing in. Stress-test before assuming the spread holds.
Location & tenants
- Location reads 75/100 on livability (#123 in CA, #4,206 nationally) — a middle-class / working-renter tenant base. Strengths: amenities A+, commute A+, employment A+; Watch: health & safety C-, crime D+, cost of living F.
- San Diego Unified (urban): math 19% / reading 29% proficiency, ranked #393 of 517 in CA (top 76%) — low school quality limits family demand, transient renter base, plan for 1-2y turnover.
- Market conditions: Rents rising (+1.9%/yr); 119 active listings in the ZIP; solid renter incomes; 11,759 units permitted in San Diego County in 2024 (7,244 in 5+ unit buildings).
- At $21,284/mo this rent would consume 260% of the median local household income ($98k/yr) (locally 2385% of renters already pay >50% of income on rent) — very limited rent-growth headroom before tenants either downsize or default.
Forward outlook
- Local home prices are declining (-3.0%/yr); year-one equity from $11k of loan paydown is wiped out by about $48k of value loss. Plan a longer hold.
- San Diego County population projected at +20% by 2050 — long-run rental-demand tailwind backs the buy-and-hold thesis.
- At projected returns (-3.0% appreciation + 1.9% rent growth), your $447k cash investment doubles in ~9 years — after that, you're playing with house money.
Negotiation context
- It's been on market 62 days — a 6% lower offer ($1.50M) is reasonable based on typical stale-listing flexibility.
Risks & watch-outs
- Watch-outs: built in 1952 — expect roof / HVAC / electrical / plumbing capex.
Questions for the listing agent
- It's been on market 62 days. Have you received any prior offers? Is the seller open to a 6% concession, seller financing, or rate buy-down credit?
- Can we see the unit-by-unit rent roll, current vacancy, and any below-market leases? What's the average tenancy length?
- What capital expenditures (roof, boiler, parking lot, exteriors) have been made in the last 5 years, and what's planned in the next 2?
- Have any recent inspections been done? Can we get a copy of the seller's disclosures and any deferred-maintenance estimates?
- Built in 1952 — when were the roof, HVAC, electrical panel, plumbing, and water heater last replaced?
- Why hasn't it sold? Are there any deal-killer items the seller is aware of (foundation, flood, title, zoning, code violations)?
- Is there a deadline driving the sale (1031 exchange, divorce, estate, relocation)? That informs how much negotiation room exists.
- Schools are B-rated — typically a magnet for longer-tenancy family renters. What's the average tenant stay here, and is there a school-zone premium baked into asking?
- Crime grade is D in this area — have there been break-ins, vandalism, or insurance claims at this property in the last 3 years? What carrier currently insures it and at what premium?
- What's the average days-on-market for RENTAL listings here right now (not sales)? A rising rental-DOM trend means longer vacancies and softer asking-rent achievability than the comps imply.
- What's the recent tenant-quality profile in this submarket — average credit score on applications, eviction rate, late-payment / NSF rate, and stable-employment percentage? A property-management company in the area should have these aggregated.
- How much new apartment / multifamily construction is in the pipeline within 1–3 miles? Heavy new supply (>2% of stock underway) typically softens rents 12–24 months out; light construction supports rent growth.
Investment metrics
- 1% rule
- 1.33% ✓
- Cap rate
- 10.65%
- Cash-on-cash
- 15.56%
- DSCR
- 1.69
- GRM
- 6.2
CMA / ARV
No comps found within radius.
Projected returns pro-forma
-3.0% appreciation · 1.92% rent growth · sell at horizon
- IRR
- 5.1%
- Equity multiple
- 1.20×
- Total profit
- $87,854
- Equity at exit
- $237,820
- IRR
- 13.6%
- Equity multiple
- 2.03×
- Total profit
- $460,912
- Equity at exit
- $137,906
Cash invested: $446,600 (down + closing). Projections, not guarantees.
Landlord ↔ Tenant lean methodology
- Overall (STATE)
- 18 Strongly Tenant-Friendly
- State California
- 18 Strongly Tenant-Friendly · D+13
- County
- — inherits STATE
- City
- — inherits STATE
ZIP-level market 92116
- Rents YoY
- 1.9%
- Active inventory
- 119
- Price-to-rent
- 43.7×
Monthly cashflow live
- Estimated rent
- $21,284 medium interval (Pro) →
- Mortgage (P&I)
- −$8,364
- Tax est. 1.5%
- −$1,994 /mo · $23,925/yr
- Insurance
- −$665
- HOA
- −$0
- Vacancy / Maint / Mgmt
- −$4,470
- Net cashflow
- $5,792
Break-even live
7-unit breakdown (identical units grouped — click to expand)
| Units | Beds | Baths | Est. rent |
|---|---|---|---|
| 7× units | 4 | 7 | $21,287 |
| #1 | 4 | 7 | $3,041 |
| #2 | 4 | 7 | $3,041 |
| #3 | 4 | 7 | $3,041 |
| #4 | 4 | 7 | $3,041 |
| #5 | 4 | 7 | $3,041 |
| #6 | 4 | 7 | $3,041 |
| #7 | 4 | 7 | $3,041 |
| Total (7 units) | $21,284 | ||
UW: 25.0% down · 7.5% · 30yr · 1.5% tax · 5.0% vac · 8.0% maint · 8.0% mgmt
Financing live
Cash to close
- Down payment
- $398,750
- Closing costs
- $47,850
- Reserves months
- —
- Total cash needed
- —
Loan-product check · same deal, 3 products live
Conventional
25% down · 7.5% · 30yr
- Down + closing
- —
- Monthly P&I
- —
- Monthly cashflow
- —
- DSCR
- —
- Eligible?
- —
Personal DTI + credit; lowest rate.
DSCR
20% down · 8.5% · 30yr
- Down + closing
- —
- Monthly P&I
- —
- Monthly cashflow
- —
- DSCR
- —
- Eligible?
- —
No personal income docs; deal must DSCR.
Hard money
10% down · 12.0% · 12mo
- Down + closing
- —
- Monthly P&I
- —
- Monthly cashflow
- —
- DSCR
- —
- Eligible?
- —
Short-term bridge; refi at stabilization.
Listing history 15 events
-
2026-06-18days on market $1,595,000 Active 62 DOM
-
2026-06-17days on market $1,595,000 Active 61 DOM
-
2026-06-16days on market $1,595,000 Active 60 DOM
-
2026-06-15price $1,595,000 Active 59 DOM
-
2026-06-15days on market $1,695,000 Active 59 DOM
-
2026-06-13days on market $1,695,000 Active 57 DOM
-
2026-06-09days on market $1,695,000 Active 53 DOM
-
2026-06-08days on market $1,695,000 Active 52 DOM
-
2026-06-07days on market $1,695,000 Active 51 DOM
-
2026-06-04days on market $1,695,000 Active 48 DOM
-
2026-06-03days on market $1,695,000 Active 47 DOM
-
2026-06-02days on market $1,695,000 Active 46 DOM
-
2026-06-01days on market $1,695,000 Active 45 DOM
-
2026-05-31days on market $1,695,000 Active 44 DOM
-
2026-04-17$1,695,000 Active
ⓘ Source: listings_history table (triggers on properties + properties_extension) + one-shot
backfill from property_details.listing_events for pre-trigger history.
Climate risk First Street
- Flood 1/10 Low FEMA zone X (unshaded) · 0% chance over 30 yrs
- Wildfire 1/10 Low
- Heat 4/10 Moderate 7 d/yr ≥89°F today · 20 d/yr by 30 yrs out
- Wind 1/10 Low
- Air quality 3/10 Moderate 4 unhealthy d/yr today · 4 by 30 yrs out
Nearby sold comps map
Loading sold comps map…
Walkable amenities ~0.75 mi
Loading nearby amenities…
Taxation est. · year 1
- Rental income
- $255,408
- − Mortgage interest
- −$89,345
- − Property taxes
- −$23,925
- − Insurance
- −$7,975
- − Repairs & maintenance
- −$20,433
- − Management
- −$20,433
- − Depreciation
- −$46,400
- Taxable income
- $46,898
- Est. tax owed @ 24.0%
- −$11,256
- After-tax cash flow
- $58,245/yr
For passive investors: Depreciation is non-cash, so a rental often shows a tax loss while cash-flowing — sheltering income. Rental losses are passive: they offset passive income freely, and up to $25,000/yr can offset ordinary (W-2) income if you actively participate and your MAGI is under $100k (phasing out to $0 by $150k); unused losses carry forward. On sale, claimed depreciation is recaptured at up to 25%, and gains may owe capital-gains tax (a 1031 exchange can defer both). Figures are a year-1 estimate at your 24.0% rate — not tax advice; consult a CPA.
Condition & rehab AI · 12 photos
This multifamily property requires moderate rehabilitation to address significant exterior and interior issues, including siding, roof, windows, and driveway. Repairs and updates will significantly enhance its resale and rental value.
Repairs flagged
- Major siding — Severe weathering and peeling
- Major roof — Significant wear and tear
- Major driveway — Large cracks and deterioration
- Major windows — Older, worn-out windows
Value-add opportunities
- Both paint exterior and interior — Fresh paint enhances curb appeal and interior aesthetics
- Both repair and replace windows — New windows improve energy efficiency and appearance
- Both repair and replace roof — A new roof extends the property's lifespan and enhances curb appeal
- Both repair and replace driveway — A new driveway improves curb appeal and functionality
Renovation cost estimate screening
| Repair item | Severity | Est. cost |
|---|---|---|
| siding · Severe weathering and peeling | Major | $15,000–50,000 |
| roof · Significant wear and tear | Major | $15,000–50,000 |
| driveway · Large cracks and deterioration | Major | $15,000–50,000 |
| windows · Older, worn-out windows | Major | $15,000–50,000 |
| Total estimated repair cost · 4 items | $60,000–200,000 |
Value-add ROI direction
- Both paint exterior and interior — Fresh paint enhances curb appeal and interior aesthetics ↑
- Both repair and replace windows — New windows improve energy efficiency and appearance ↑
- Both repair and replace roof — A new roof extends the property's lifespan and enhances curb appeal ↑
- Both repair and replace driveway — A new driveway improves curb appeal and functionality ↑
ⓘ Cost ranges are severity-bucket heuristics (US national rule-of-thumb). Get contractor quotes + a written scope before underwriting a rehab budget.
Schools (NCES district)
- District
- San Diego Unified
- NCES district ID
- 0634320
- Math proficiency
- 19% ▼ -29.00%
- Reading proficiency
- 29% ▼ -28.00%
- Median HH income
- $61,673
- Composite
- 22.31/100
- National rank
- #8135
- State rank
- #393 of 517 in CA
Livability — San Diego
- Score
- 75/100
- State rank
- #123
- US rank
- #4206
Category grades
Schools grade is shown separately in the Schools card above.
Census & demographics
- Census place
- San Diego, CA
- County
- San Diego County · 3,178,799 people
- City population
- 1,397,612
- Metro
- San Diego-Chula Vista-Carlsbad, CA
- Population (ZIP)
- 31,843
- Household income
- $98,154
- Rent vs Own
- Severe rent burden
- 2385.0
Population outlook (San Diego County) Hauer SSP2
- Today (2025)
- 3,678,185 people
- By 2030
- 3,856,546 · +4.8%
- By 2040
- 4,171,407 · +13.4%
- By 2050
- 4,421,607 · +20.2%
- By 2075
- 4,831,599 · +31.4%
- By 2100
- 4,832,502 · +31.4%
Race, ethnicity, and origin ACS 2023
- Neighborhood character
- Diverse neighborhood (Simpson 0.62)
- Race & ethnicity
- White 54% Hispanic / Latino 30% Two or more races 17% Asian 6% Black 4%
- Hispanic origin (detail)
- Mexican 23%
- Common ancestry
- Romanian 3% Lithuanian 2% Portuguese 2%
- Foreign-born
- 15% · Canada, South Korea, China
- Languages at home
- 72% English-only · Spanish 21% Other Indo-European 2% Other Asian/Pacific 1%
Political lean MEDSL · San Diego
- 2024 margin
- D (+16.8) · D 56.9% · R 40.1% · Other 2.9%
- 2008→2024 swing
- +6.6pp toward D · 2008: 10.2pp · 2024: 16.8pp
- All cycles
- 2024: D+16.8 2020: D+22.8 2016: D+17.8 2012: D+5.1 2008: D+10.2
Not yet ingested
- Civics
- —
Market trends
- HPI YoY
- ▼ -863.79%
- Current HPI
- 378.6597
- Rent YoY
- ▲ 1.92%
- Metro
- San Diego-Chula Vista-Carlsbad, CA
- State GDP YoY
- ▲ 3.21%
- F500 in state
- 116
Industry mix (Fortune 500 HQ in CA)
| Industry | F500 HQs | Revenue |
|---|---|---|
| Technology | 27 | $1,492B |
|
||
| Financial Services | 3 | $174B |
|
||
| Retail | 3 | $44B |
|
||
| Insurance | 3 | $26B |
|
||
| Media / Entertainment | 2 | $115B |
|
||
| Pharmaceuticals / Biotech | 2 | $62B |
|
||
Price history
1 event — show timeline
- 2026-04-17 Listed $1,695,000 CRMLS
Cash-flow waterfall
monthlySold comps — $/sqft
last 12 mo · ≤1 miLoading sold comps…