 🏷️ Likely Rental
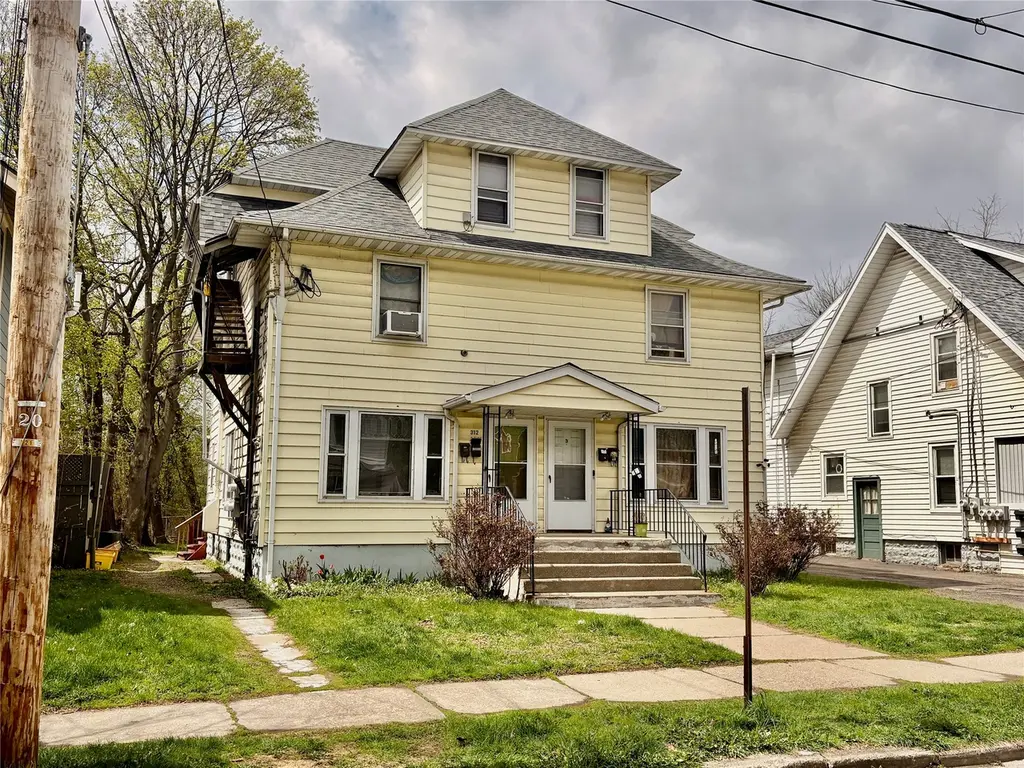
312 Roosevelt Ave · Endicott, NY
Flood risk 1/10 · Minimal
- FEMA flood zone
- X
- Chance of flooding over 30 yrs
- 0.0%
- Est. flood insurance / yr
- $473 – $860
Fire risk 3/10 · Minor
- Est. fire insurance / yr
- $691 – $1,283
Heat risk 3/10 · Minor
- Hot days now (above 93°F)
- 7 days/yr
- Hot days in 30 yrs
- 16 days/yr
Wind risk 2/10 · Minimal
- Chance of severe wind over 30 yrs
- 1.0%
Air-quality risk 2/10 · Minimal
- Unhealthy air days now
- 0 days/yr
- Unhealthy air days in 30 yrs
- 1 days/yr
Risk factors via First Street. Map © Google.
Why this score? — see what drove the B+ grade
The composite is a weighted blend of 9 inputs, each scored 0–100. Each bar is that input's sub-score; the figure is the points it added to the 100-point composite (weight × sub-score).
- Cash flow +30.0/30.0
- ARV discount +15.0/15.0
- 1% rule +10.0/10.0
- DSCR +10.0/10.0
- Rent growth +4.3/5.0
- Schools +4.3/10.0
- Livability +3.5/5.0
- Condition / age +2.5/5.0
- Appreciation +0.0/10.0
$209,000
🖨 Deal sheet 📄 Offer letter ✓ Due diligence
Multi-family units
County records classify this as Multi-Family (5+ Unit). Listing-text estimate: 4 units. estimate disagrees with records
5+ unit building — per-unit beds/baths from public records are typically unavailable; the breakdown below (if shown) is an estimate from the listing text.
Listing remarks
Fully Rented 4-Family Investment Property on a Spacious Double Lot. Well Maintained building features separate utilities for each unit, offering ease of managment and tenant independence. Recent upgrades include a new roof, updated plumbing, new hotwater heaters, New gas lines-providing peace of mind and reduced maintaince costs for years to come. Strong rental history with steady income potential. This 4-Family is an Ideal Addition to Any Investor's Portfolio.
Key facts
- 8,450 sq ft lot
- Built 1965
- Listed 52 days
Property features AI
Finance
- Financial info: Rents by unit: $500, $855, $500, $500
Exterior
- Utilities: Public water; Public sewer
- Home design: Residential income property; Quadruplex
- Construction: Vinyl siding
- Exterior features: Covered porch
Interior
- Kitchen: Range; Refrigerator
- Bedrooms: One 1-bed unit; One 3-bed unit; One 1-bed unit; One 2-bed unit
- Flooring: Carpet; Hardwood; Vinyl
- Bathrooms: Four full bathrooms (total)
- Heating & cooling: Forced air heating; No cooling
- Interior features: Gas water heater; Range; Refrigerator
- Laundry & utility: Gas water heater
Neighborhood map
What this means for you Summary
Snapshot
- This is a 4 × 7-bed/4.0-bath units multifamily listed at $209k.
Deal economics
- At list price, monthly cash flow is $4k ($52k/yr) — positive. Per door: $1k/mo.
- The deal already cash-flows at list — no discount required.
- Meets the 1% rule at list price ($7k rent vs $209k).
- Recommended offer: $203k (3.0% below list) — sets the bar for market timing.
- Cap rate 30.9% vs local median 5.5% in Endicott — top-decile yield for the area; either an underpriced asset or a hidden risk that comps aren't pricing in. Stress-test before assuming the spread holds.
Location & tenants
- Location reads 70/100 on livability (#438 in NY) — a middle-class / working-renter tenant base. Strengths: cost of living A+, health & safety A+, housing A; Watch: amenities D, crime F, commute F.
- Union-Endicott Central School District (suburban): math 43% / reading 57% proficiency, ranked #387 of 590 in NY (top 66%) — acceptable for families but not a draw, mixed tenant base, ~2y average lease.
- Zoned schools: Charles F Johnson Jr Elementary School (math 17% / reading 27%, grade F, #1,923 of 2,108 statewide, top 92%, 387 students, 66% FRL) — zoned schools average 66% FRL vs 42% district-wide (25 pts higher); higher-poverty schools than district average — tighter screening recommended.
- Zoned-school proficiency averages 22% at this address vs 50% district-wide (-28 pts) — the specific schools serving this property underperform the Union-Endicott Central School District average; the district grade overstates school quality for this exact location.
- Market conditions: Rents rising fast (+7.1%/yr); 213 active listings in the ZIP; 340 units permitted in Broome County in 2024 (269 in 5+ unit buildings).
- At $7,190/mo this rent would consume 131% of the median local household income ($66k/yr) (locally 1480% of renters already pay >50% of income on rent) — very limited rent-growth headroom before tenants either downsize or default.
Forward outlook
- Local home prices are declining (-3.0%/yr); year-one equity from $1k of loan paydown is wiped out by about $6k of value loss. Plan a longer hold.
- Broome County population projected at -13% by 2050 — secular population decline; favor cash flow + early exit over multi-decade hold.
- At projected returns (-3.0% appreciation + 7.1% rent growth), your $59k cash investment doubles in ~2 years — after that, you're playing with house money.
Negotiation context
- It's been on market 53 days — a 3% lower offer ($203k) is reasonable based on typical stale-listing flexibility.
- 6 sale attempts since 12y ago; this cycle's ask has dropped $56k (21%) from the opening price — seller is motivated, your offer sets the floor, not the list.
- Current owner paid $64k; list at $209k implies a 224% gain — meaningful room to come down on a strong offer.
Questions for the listing agent
- It's been on market 53 days. Have you received any prior offers? Is the seller open to a 3% concession, seller financing, or rate buy-down credit?
- Can we see the unit-by-unit rent roll, current vacancy, and any below-market leases? What's the average tenancy length?
- What capital expenditures (roof, boiler, parking lot, exteriors) have been made in the last 5 years, and what's planned in the next 2?
- Built in 1965 — when were the roof, HVAC, electrical panel, plumbing, and water heater last replaced?
- Is there a deadline driving the sale (1031 exchange, divorce, estate, relocation)? That informs how much negotiation room exists.
- Schools are D-rated, which usually means shorter tenancies and higher turnover. Who's the typical renter profile here, and what's been the actual vacancy rate?
- Crime grade is F in this area — have there been break-ins, vandalism, or insurance claims at this property in the last 3 years? What carrier currently insures it and at what premium?
- What's the average days-on-market for RENTAL listings here right now (not sales)? A rising rental-DOM trend means longer vacancies and softer asking-rent achievability than the comps imply.
- What's the recent tenant-quality profile in this submarket — average credit score on applications, eviction rate, late-payment / NSF rate, and stable-employment percentage? A property-management company in the area should have these aggregated.
- How much new apartment / multifamily construction is in the pipeline within 1–3 miles? Heavy new supply (>2% of stock underway) typically softens rents 12–24 months out; light construction supports rent growth.
Investment metrics
- 1% rule
- 3.44% ✓
- Cap rate
- 30.94%
- Cash-on-cash
- 88.01%
- DSCR
- 4.92
- GRM
- 2.4
CMA / ARV
- ARV (median comp)
- $341,146
- List price
- $209,000
- Delta
- -38.74%
- Verdict
- UNDERPRICED
- Comps
- 20 within 1.0 mi
Projected returns pro-forma
-3.0% appreciation · 7.09% rent growth · sell at horizon
- IRR
- 93.1%
- Equity multiple
- 5.62×
- Total profit
- $270,370
- Equity at exit
- $31,163
- IRR
- 96.8%
- Equity multiple
- 13.39×
- Total profit
- $725,269
- Equity at exit
- $18,071
Cash invested: $58,520 (down + closing). Projections, not guarantees.
Landlord ↔ Tenant lean methodology
- Overall (STATE)
- 15 Strongly Tenant-Friendly
- State New York
- 15 Strongly Tenant-Friendly · D+10
- County
- — inherits STATE
- City
- — inherits STATE
ZIP-level market 13760
- Home prices YoY
- -32.7%
- Rents YoY
- 7.1%
- Active inventory
- 213
- Price-to-rent
- 9.7×
Monthly cashflow live
- Estimated rent
- $7,190 medium interval (Pro) →
- Mortgage (P&I)
- −$1,096
- Tax from tax record
- −$205 /mo · $2,460/yr
- Insurance
- −$87
- HOA
- −$0
- Vacancy / Maint / Mgmt
- −$1,510
- Net cashflow
- $4,292
Break-even live
4-unit breakdown (identical units grouped — click to expand)
| Units | Beds | Baths | Est. rent |
|---|---|---|---|
| 4× units | 7 | 4 | $7,192 |
| #1 | 7 | 4 | $1,798 |
| #2 | 7 | 4 | $1,798 |
| #3 | 7 | 4 | $1,798 |
| #4 | 7 | 4 | $1,798 |
| Total (4 units) | $7,190 | ||
UW: 25.0% down · 7.5% · 30yr · 1.5% tax · 5.0% vac · 8.0% maint · 8.0% mgmt
Financing live
Cash to close
- Down payment
- $52,250
- Closing costs
- $6,270
- Reserves months
- —
- Total cash needed
- —
Loan-product check · same deal, 3 products live
Conventional
25% down · 7.5% · 30yr
- Down + closing
- —
- Monthly P&I
- —
- Monthly cashflow
- —
- DSCR
- —
- Eligible?
- —
Personal DTI + credit; lowest rate.
DSCR
20% down · 8.5% · 30yr
- Down + closing
- —
- Monthly P&I
- —
- Monthly cashflow
- —
- DSCR
- —
- Eligible?
- —
No personal income docs; deal must DSCR.
Hard money
10% down · 12.0% · 12mo
- Down + closing
- —
- Monthly P&I
- —
- Monthly cashflow
- —
- DSCR
- —
- Eligible?
- —
Short-term bridge; refi at stabilization.
Listing history 27 events
-
2026-06-19days on market $209,000 Active 53 DOM
-
2026-06-18days on market $209,000 Active 52 DOM
-
2026-06-17days on market $209,000 Active 51 DOM
-
2026-06-16days on market $209,000 Active 50 DOM
-
2026-06-15days on market $209,000 Active 49 DOM
-
2026-06-14days on market $209,000 Active 47 DOM
-
2026-06-13days on market $209,000 Active 46 DOM
-
2026-06-10days on market $209,000 Active 44 DOM
-
2026-06-09days on market $209,000 Active 43 DOM
-
2026-06-08days on market $209,000 Active 42 DOM
-
2026-06-07pricedays on market $209,000 Active 41 DOM
-
2026-06-05days on market $265,000 Active 38 DOM
-
2026-06-03days on market $265,000 Active 37 DOM
-
2026-06-02days on market $265,000 Active 36 DOM
-
2026-06-01days on market $265,000 Active 35 DOM
-
2026-05-31days on market $265,000 Active 34 DOM
-
2026-05-30days on market $265,000 Active 33 DOM
-
2026-04-27$265,000 Active 465-char remark
-
2019-11-12soldstatus $64,500
-
2019-11-01soldstatus $64,500
-
2019-09-04$64,500
-
2019-02-07$64,500
-
2017-06-06$79,900
-
2015-01-05$89,900
-
2014-04-07$69,000
-
2013-03-26soldstatus $41,250
-
2008-06-25soldstatus $46,391
ⓘ Source: listings_history table (triggers on properties + properties_extension) + one-shot
backfill from property_details.listing_events for pre-trigger history.
Tax reassessment forecast NY · Partial reset (capped growth)
- Current annual tax
- $2,460 · $205/mo
- Projected year-2 tax
- $2,996 · $250/mo
- Expected delta
- +$536/yr (+$45/mo · 21.8%)
ⓘ Screening estimate from a state-policy table — verify with the county assessor before closing.
Climate risk First Street
- Flood 1/10 Low FEMA zone X · 0% chance over 30 yrs
- Wildfire 3/10 Moderate
- Heat 3/10 Moderate 7 d/yr ≥93°F today · 16 d/yr by 30 yrs out
- Wind 2/10 Low 100% chance of damaging wind over 30 yrs
- Air quality 2/10 Low 0 unhealthy d/yr today · 1 by 30 yrs out
Nearby sold comps map
Loading sold comps map…
Walkable amenities ~0.75 mi
Loading nearby amenities…
Taxation est. · year 1
- Rental income
- $86,280
- − Mortgage interest
- −$11,707
- − Property taxes
- −$2,460
- − Insurance
- −$1,045
- − Repairs & maintenance
- −$6,902
- − Management
- −$6,902
- − Depreciation
- −$6,080
- Taxable income
- $51,183
- Est. tax owed @ 24.0%
- −$12,284
- After-tax cash flow
- $39,220/yr
For passive investors: Depreciation is non-cash, so a rental often shows a tax loss while cash-flowing — sheltering income. Rental losses are passive: they offset passive income freely, and up to $25,000/yr can offset ordinary (W-2) income if you actively participate and your MAGI is under $100k (phasing out to $0 by $150k); unused losses carry forward. On sale, claimed depreciation is recaptured at up to 25%, and gains may owe capital-gains tax (a 1031 exchange can defer both). Figures are a year-1 estimate at your 24.0% rate — not tax advice; consult a CPA.
Schools (NCES district)
- District
- Union-Endicott Central School District
- NCES district ID
- 3610710
- Math proficiency
- 43% ▼ -9.00%
- Reading proficiency
- 57% ▲ 11.00%
- Median HH income
- $49,265
- Composite
- 42.66/100
- National rank
- #3176
- State rank
- #387 of 590 in NY
Livability — Endicott
- Score
- 70/100
- State rank
- #438
- US rank
- #7657
Category grades
Schools grade is shown separately in the Schools card above.
Census & demographics
- Census place
- Endicott, NY
- County
- Broome County · 126,805 people
- City population
- 42,896
- Metro
- Binghamton, NY
- Population (ZIP)
- 42,896
- Household income
- $66,095
- Rent vs Own
- Severe rent burden
- 1480.0
Population outlook (Broome County) Hauer SSP2
- Today (2025)
- 187,989 people
- By 2030
- 183,066 · -2.6%
- By 2040
- 172,228 · -8.4%
- By 2050
- 163,161 · -13.2%
- By 2075
- 153,641 · -18.3%
- By 2100
- 140,851 · -25.1%
Race, ethnicity, and origin ACS 2023
- Neighborhood character
- Predominantly White (84%)
- Race & ethnicity
- White 84% Two or more races 7% Hispanic / Latino 6% Black 4% Asian 2%
- Hispanic origin (detail)
- Puerto Rican 2%
- Common ancestry
- Romanian 6% Lithuanian 2% Slovak 2%
- Foreign-born
- 5% · Canada, China
- Languages at home
- 94% English-only · Spanish 2% Other Indo-European 1% Russian/Polish/Slavic 1%
Political lean MEDSL · Broome
- 2024 margin
- Toss-up / Even · D 50.2% · R 49.8%
- 2008→2024 swing
- -7.6pp toward R · 2008: 8.0pp · 2024: 0.4pp
- All cycles
- 2024: D+0.4 2020: D+3.5 2016: R+3.7 2012: D+4.6 2008: D+8.0
Not yet ingested
- Civics
- —
Market trends
- HPI YoY
- ▼ -131.29%
- Current HPI
- 270.2661
- Rent YoY
- ▲ 7.09%
- Metro
- Binghamton, NY
- State GDP YoY
- ▲ 2.60%
- F500 in state
- 92
Industry mix (Fortune 500 HQ in NY)
| Industry | F500 HQs | Revenue |
|---|---|---|
| Financial Services | 10 | $950B |
|
||
| Consumer Goods | 9 | $162B |
|
||
| Insurance | 4 | $225B |
|
||
| Telecommunications | 2 | $144B |
|
||
| Pharmaceuticals | 2 | $112B |
|
||
| Media / Entertainment | 2 | $69B |
|
||
Price history
+350.5% since first listed11 events — show timeline
- 2026-06-05 Price Changed $209,000 GBAOR
- 2026-04-27 Listed $265,000 GBAOR
- 2019-11-12 Sold (Public Records) $64,500 Public Records
- 2019-11-01 Sold (MLS) $64,500 GBAOR
- 2019-09-04 Listed $64,500 GBAOR
- 2019-02-07 Listed $64,500 GBAOR
- 2017-06-06 Listed $79,900 GBAOR
- 2015-01-05 Listed $89,900 GBAOR
- 2014-04-07 Listed $69,000 GBAOR
- 2013-03-26 Sold (Public Records) $41,250 Public Records
- 2008-06-25 Sold (Public Records) $46,391 Public Records
Property tax history
+1.8%/yrLatest (2025): $2,460 · +3.4% YoY. Source: county tax records.
Cash-flow waterfall
monthlySold comps — $/sqft
last 12 mo · ≤1 miLoading sold comps…