None · Aurora, IL
Flood risk No data
- FEMA flood zone
- —
- Chance of flooding over 30 yrs
- %
- Est. flood insurance / yr
- —
Fire risk No data
- Est. fire insurance / yr
- —
Heat risk No data
- Hot days now (above °F)
- days/yr
- Hot days in 30 yrs
- days/yr
Wind risk No data
- Chance of severe wind over 30 yrs
- %
Air-quality risk No data
- Unhealthy air days now
- days/yr
- Unhealthy air days in 30 yrs
- days/yr
Risk factors via First Street. Map © Google.
Why this score? — see what drove the F grade
The composite is a weighted blend of 9 inputs, each scored 0–100. Each bar is that input's sub-score; the figure is the points it added to the 100-point composite (weight × sub-score).
- Appreciation +10.0/10.0
- Cash flow +7.8/30.0
- Livability +3.8/5.0
- Schools +3.1/10.0
- Rent growth +2.5/5.0
- Condition / age +2.5/5.0
- 1% rule +2.3/10.0
- DSCR +1.8/10.0
- ARV discount +0.0/15.0
$340,000
🖨 Deal sheet (PDF) 📄 Offer letter ✓ Due diligence
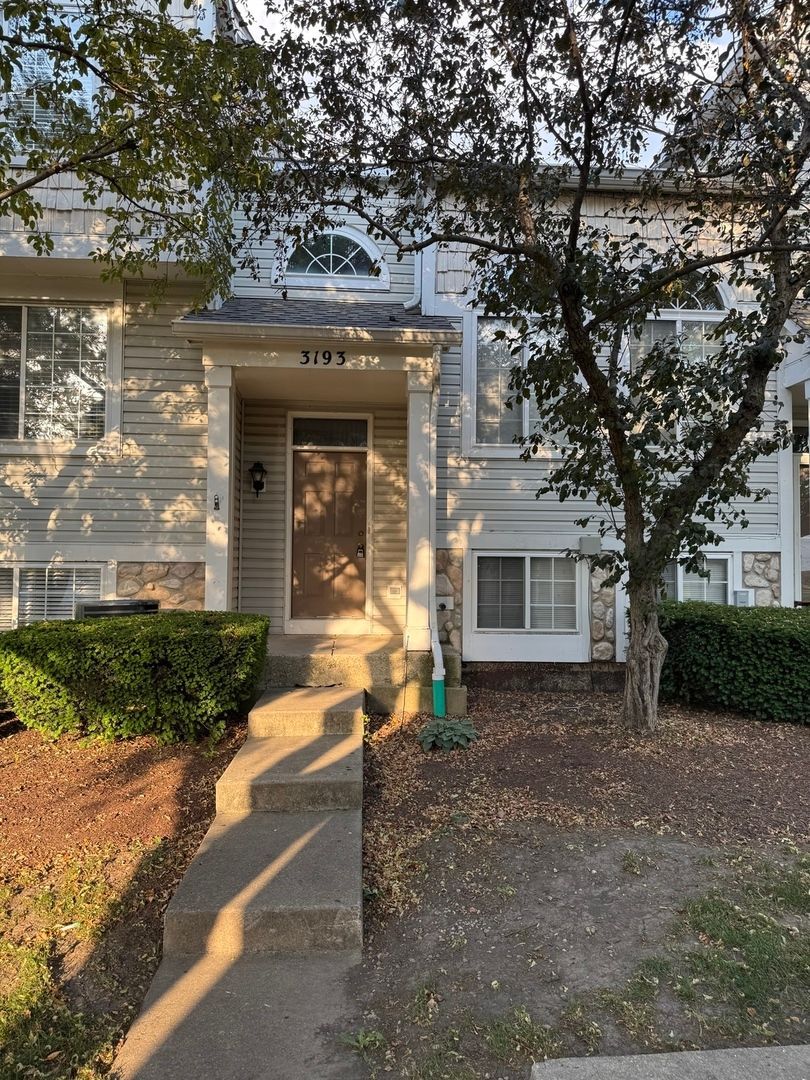
Listing remarks
Welcome home to this beautifully newly renovated and maintained townhome tucked away on a quiet cul-de-sac and backing to open green space. The inviting floor plan offers comfortable living and plenty of natural light throughout. The spacious living room flows seamlessly into the dining area, creating the perfect setting for everyday living and entertaining. The kitchen features ample cabinetry, generous counter space, and a sunny table area ideal for casual dining. Upstairs, you'll find two generously sized bedrooms, a full bathroom, and the convenience of a second-floor laundry room. The family room provides valuable additional living space and is perfect for a home office, media room, pl
Key facts
- Garage
- Built 2000
Neighborhood map
What this means for you Summary
Snapshot
- This is a 2-bed/1.5-bath townhouse listed at $340k.
Deal economics
- At list price, monthly cash flow is $-384 ($-5k/yr) — negative.
- To cash-flow at today's rent, offer at most $284k (16.4% below list).
- To meet the 1% rule (rent ≥ 1% of price), the offer needs to be $249k (26.8% below list).
- Recommended offer: $249k (26.8% below list) — sets the bar for 1% rule.
- Cap rate 4.9% vs local median 3.5% in Aurora — top-decile yield for the area; either an underpriced asset or a hidden risk that comps aren't pricing in. Stress-test before assuming the spread holds.
Location & tenants
- Location reads 75/100 on livability (#232 in IL, #4,272 nationally) — a middle-class / working-renter tenant base. Strengths: commute A+, housing A+, employment A-; Watch: schools F, amenities F, health & safety F.
- CUSD 308 (suburban): math 29% / reading 34% proficiency, ranked #179 of 620 in IL (top 29%) — families likely to look elsewhere, expect single-tenant / working-renter base with shorter leases; only 20% free/reduced lunch — higher-income household profile.
- Market conditions: 122 active listings in the ZIP; 17 comparable units currently listed for rent nearby; rentals at typical pace (median 15d on market — plan ~3-4 weeks tenant-placement turnaround); high-income renter base; 2,028 units permitted in Will County in 2024 (530 in 5+ unit buildings).
Forward outlook
- In year one you build about $36k of equity ($2k loan paydown + $34k appreciation (10.0% local appreciation)).
- Will County population projected to shrink 4% by 2050 — rents likely to lag national; underwrite the cash flow, not the appreciation.
- By year 2, paydown + projected appreciation supports a ~$58k cash-out refi (75% LTV) — recoverable capital for the next deal without selling this one.
Negotiation context
- Only 1 days on market — expect competitive offers; lowballing is unlikely to land.
Questions for the listing agent
- What do current leases actually rent for vs. the listed asking? Can we see a recent rent roll and the last 12 months of T-12 income?
- Is there a deadline driving the sale (1031 exchange, divorce, estate, relocation)? That informs how much negotiation room exists.
- Schools are F-rated, which usually means shorter tenancies and higher turnover. Who's the typical renter profile here, and what's been the actual vacancy rate?
- The area grade is low — what's the realistic commute time and amenity access for the typical tenant pool here? Any planned neighborhood developments (good or bad) we should know about?
- What's the average days-on-market for RENTAL listings here right now (not sales)? A rising rental-DOM trend means longer vacancies and softer asking-rent achievability than the comps imply.
- What's the recent tenant-quality profile in this submarket — average credit score on applications, eviction rate, late-payment / NSF rate, and stable-employment percentage? A property-management company in the area should have these aggregated.
- How much new for-sale + rental construction is in the pipeline within 1–3 miles? Heavy new supply typically softens prices + rents 12–24 months out; constrained supply supports both.
Investment metrics
- 1% rule
- 0.73% ✗
- Cap rate
- 4.94%
- Cash-on-cash
- -4.85%
- DSCR
- 0.78
- GRM
- 11.4
CMA / ARV
- ARV (on-the-fly)
- $258,500
- Comps found
- 12
Show comp detail 12 sales within ~0.75 mi
| Address | Dist | Beds/Ba | Sqft | Sold | Price | $/sf | Match |
|---|---|---|---|---|---|---|---|
| 1660 Normantown Rd | 0.51mi | 2/1.5 | 1,052 (-4%) | 12mo | $279,000 | $265 | 59 |
| 1704 Normantown Rd #445 | 0.47mi | 2/1.5 | 1,052 (-4%) | 16mo | $255,000 | $242 | 57 |
| 1700 Normantown Rd | 0.48mi | 2/1.5 | 1,052 (-4%) | 20mo | $250,000 | $238 | 54 |
| 1584 Normantown Rd | 0.57mi | 2/1.5 | 1,052 (-4%) | 22mo | $245,000 | $233 | 48 |
| 1500 Normantown Rd | 0.66mi | 2/1.5 | 1,052 (-4%) | 20mo | $245,000 | $233 | 46 |
| 1412 Normantown Rd | 0.75mi | 2/1.5 | 1,052 (-4%) | 16mo | $275,000 | $261 | 44 |
| 2649 Hillsboro Blvd | 0.73mi | 2/1.5 | 1,192 (+8%) | 13mo | $280,000 | $235 | 41 |
| 2843 Dorothy Dr | 0.63mi | 3/1.5 (+1) | 1,251 (+14%) | 3mo | $325,000 | $260 | 40 |
| 2870 Dorothy Dr | 0.68mi | 3/1.5 (+1) | 1,235 (+12%) | 7mo | $270,000 | $219 | 37 |
| 2992 Dorothy Dr | 0.57mi | 3/1.5 (+1) | 1,251 (+14%) | 14mo | $270,000 | $216 | 34 |
| 2922 Dorothy Dr | 0.63mi | 3/1.5 (+1) | 1,251 (+14%) | 16mo | $285,000 | $228 | 29 |
| 2260 Georgetown Cir #2260 | 0.75mi | 2/2.5 | 1,189 (+8%) | 23mo | $270,000 | $227 | 28 |
Match score weights: distance 35% · size 25% · config 20% · recency 20%. Top-matched comps best support the ARV.
Projected returns pro-forma
10.0% appreciation · 3.0% rent growth · sell at horizon
- IRR
- 20.8%
- Equity multiple
- 2.69×
- Total profit
- $160,723
- Equity at exit
- $306,299
- IRR
- 18.9%
- Equity multiple
- 6.17×
- Total profit
- $492,634
- Equity at exit
- $660,545
Cash invested: $95,200 (down + closing). Projections, not guarantees.
Landlord ↔ Tenant lean methodology
- Overall (STATE)
- 43 Moderately Tenant-Leaning
- State Illinois
- 43 Moderately Tenant-Leaning · D+7
- County
- — inherits STATE
- City
- — inherits STATE
ZIP-level market 60503
- Home prices YoY
- 4.6%
- Active inventory
- 122
- Price-to-rent
- 11.4×
Monthly cashflow live
- Estimated rent
- $2,488 high interval (Pro) →
- Mortgage (P&I)
- −$1,783
- Tax est. 1.5%
- −$425 /mo · $5,100/yr
- Insurance
- −$142
- HOA
- −$0
- Vacancy / Maint / Mgmt
- −$522
- Net cashflow
- $-384
Break-even live
Sensitivity live
| Price | -10% $-150 | -5% $-267 | +0% $-384 | +5% $-502 | +10% $-619 |
|---|---|---|---|---|---|
| Rent | -10% $-581 | -5% $-483 | +0% $-384 | +5% $-286 | +10% $-188 |
| Rate | -1.0pp $-213 | -0.5pp $-298 | base $-384 | +0.5pp $-473 | +1.0pp $-562 |
UW: 25.0% down · 7.5% · 30yr · 1.5% tax · 5.0% vac · 8.0% maint · 8.0% mgmt
Financing live
Cash to close
- Down payment
- $85,000
- Closing costs
- $10,200
- Reserves months
- —
- Total cash needed
- —
Loan-product check · same deal, 3 products live
Conventional
25% down · 7.5% · 30yr
- Down + closing
- —
- Monthly P&I
- —
- Monthly cashflow
- —
- DSCR
- —
- Eligible?
- —
Personal DTI + credit; lowest rate.
DSCR
20% down · 8.5% · 30yr
- Down + closing
- —
- Monthly P&I
- —
- Monthly cashflow
- —
- DSCR
- —
- Eligible?
- —
No personal income docs; deal must DSCR.
Hard money
10% down · 12.0% · 12mo
- Down + closing
- —
- Monthly P&I
- —
- Monthly cashflow
- —
- DSCR
- —
- Eligible?
- —
Short-term bridge; refi at stabilization.
Rent comps 17 comps
| Address | Beds | Baths | Sqft | Rent | $/sqft | DOM | Units | Dist |
|---|---|---|---|---|---|---|---|---|
| 1914 Spinnaker Ct Aurora, IL | 3.0 | 2.5 | 1412 | $3,000 | $2.12 | 45d | 1 | 0.12mi |
| 1860 Middlebury Dr Unit 1860 Aurora, IL | 2.0 | 2.5 | 1471 | $2,450 | $1.67 | 21d | 1 | 0.17mi |
| 1632 Normantown Rd Naperville, IL | 2.0 | 1.5 | 1052 | $2,150 | $2.04 | 3d | 1 | 0.56mi |
| 1516 Normantown Rd Unit 1516 Naperville, IL | 2.0 | 1.5 | 1052 | $2,100 | $2.00 | 26d | 1 | 0.66mi |
| 2598 Hillsboro Blvd Aurora, IL | 3.0 | 2.5 | 1482 | $2,395 | $1.62 | 22d | 1 | 0.71mi |
| 1420 Andover Dr Aurora, IL | 3.0 | 1.5 | 1300 | $2,200 | $1.69 | 4d | 1 | 0.73mi |
| 2516 Hillsboro Blvd Aurora, IL | 2.0 | 2.5 | 1482 | $2,300 | $1.55 | 19d | 1 | 0.80mi |
| 1210 Andover Cir Aurora, IL | 3.0 | 1.5 | 1194 | $2,100 | $1.76 | 9d | 1 | 0.97mi |
| 1227 Andover Cir Aurora, IL | 3.0 | 1.5 | 1194 | $2,300 | $1.93 | 45d | 1 | 0.99mi |
| 1419 Farrington Ln Aurora, IL | 3.0 | 1.5 | 1476 | $2,959 | $2.00 | 4d | 1 | 1.03mi |
| 1111 Brunswick Ln Aurora, IL | 3.0 | 2.0 | 1159 | $2,200 | $1.90 | 8d | 1 | 1.13mi |
| 1111 Brunswick Ln Aurora, IL | 3.0 | 1.5 | 1159 | $2,200 | $1.90 | 14d | 1 | 1.13mi |
| 1009 Pheasant Run Ln Aurora, IL | 3.0 | 2.0 | 1034 | $2,050 | $1.98 | 45d | 1 | 1.26mi |
| 3427 Fox Hill Rd Aurora, IL | 2.0 | 1.0 | 864 | $2,000 | $2.31 | 14d | 1 | 1.31mi |
| 826 Terrace Lake Dr Aurora, IL | 2.0 | 1.5 | 1090 | $2,132 | $1.96 | 0d | 9 | 1.39mi |
| 2565 Dickens Ct Aurora, IL | 2.0 | 2.5 | 1116 | $2,300 | $2.06 | 45d | 1 | 1.47mi |
| 2703 Showplace Dr Naperville, IL | 1.0–3.0 | 1.0–2.0 | 1017 | $2,615 | $2.57 | 0d | 33 | 1.50mi |
Listing history 2 events
-
2026-06-22remarks 699-char remark
-
2026-06-22$340,000 Coming Soon 1 DOM
ⓘ Source: listings_history table (triggers on properties + properties_extension) + one-shot
backfill from property_details.listing_events for pre-trigger history.
Nearby sold comps map
Loading sold comps map…
Walkable amenities ~0.75 mi
Loading nearby amenities…
Taxation est. · year 1
- Rental income
- $29,851
- − Mortgage interest
- −$19,045
- − Property taxes
- −$5,100
- − Insurance
- −$1,700
- − Repairs & maintenance
- −$2,388
- − Management
- −$2,388
- − Depreciation
- −$9,891
- Taxable loss
- −$10,661
- Est. tax savings @ 24.0%
- +$2,559
- After-tax cash flow
- $-2,055/yr
For passive investors: Depreciation is non-cash, so a rental often shows a tax loss while cash-flowing — sheltering income. Rental losses are passive: they offset passive income freely, and up to $25,000/yr can offset ordinary (W-2) income if you actively participate and your MAGI is under $100k (phasing out to $0 by $150k); unused losses carry forward. On sale, claimed depreciation is recaptured at up to 25%, and gains may owe capital-gains tax (a 1031 exchange can defer both). Figures are a year-1 estimate at your 24.0% rate — not tax advice; consult a CPA.
Schools (NCES district)
- District
- CUSD 308
- NCES district ID
- 1730270
- Math proficiency
- 29% ▼ -10.00%
- Reading proficiency
- 34% ▼ -9.00%
- Median HH income
- $89,945
- Composite
- 31.25/100
- National rank
- #6028
- State rank
- #179 of 620 in IL
Livability — Aurora
- Score
- 75/100
- State rank
- #232
- US rank
- #4272
Category grades
Schools grade is shown separately in the Schools card above.
Census & demographics
- Census place
- Aurora, IL
- County
- Will County · 412,448 people
- City population
- 186,692
- Metro
- Chicago-Naperville-Elgin, IL-IN-WI
- Population (ZIP)
- 16,789
- Household income
- $136,726
- Rent vs Own
- Severe rent burden
- 19.0
Population outlook (Will County) Hauer SSP2
- Today (2025)
- 705,368 people
- By 2030
- 708,154 · +0.4%
- By 2040
- 702,692 · -0.4%
- By 2050
- 680,249 · -3.6%
- By 2075
- 611,990 · -13.2%
- By 2100
- 516,215 · -26.8%
Race, ethnicity, and origin ACS 2023
- Neighborhood character
- Diverse neighborhood (Simpson 0.69)
- Race & ethnicity
- White 49% Asian 19% Black 14% Hispanic / Latino 14% Two or more races 7%
- Hispanic origin (detail)
- Mexican 11% Puerto Rican 1%
- Common ancestry
- Romanian 10% Scandinavian 3% Italian 1%
- Foreign-born
- 22% · Canada, China, Vietnam
- Languages at home
- 68% English-only · Other Indo-European 11% Spanish 8% Other Asian/Pacific 4%
Political lean MEDSL · Will
- 2024 margin
- Toss-up / Even · D 50.1% · R 48.5% · Other 1.4%
- 2008→2024 swing
- -11.6pp toward R · 2008: 13.2pp · 2024: 1.6pp
- All cycles
- 2024: D+1.6 2020: D+8.3 2016: D+5.7 2012: D+3.7 2008: D+13.2
Not yet ingested
- Civics
- —
Market trends
- HPI YoY
- ▲ 10.31%
- Current HPI
- 232.382
- Rent YoY
- —
- Metro
- Chicago-Naperville-Elgin, IL-IN-WI
- State GDP YoY
- ▲ 1.59%
- F500 in state
- 60
Industry mix (Fortune 500 HQ in IL)
| Industry | F500 HQs | Revenue |
|---|---|---|
| Insurance | 4 | $201B |
|
||
| Consumer Goods | 4 | $87B |
|
||
| Industrial Machinery | 3 | $64B |
|
||
| Healthcare | 2 | $55B |
|
||
| Retail / Pharmacy | 1 | $148B |
|
||
| Agriculture / Food | 1 | $86B |
|
||
Cash-flow waterfall
monthlySold comps — $/sqft
last 12 mo · ≤1 miLoading sold comps…