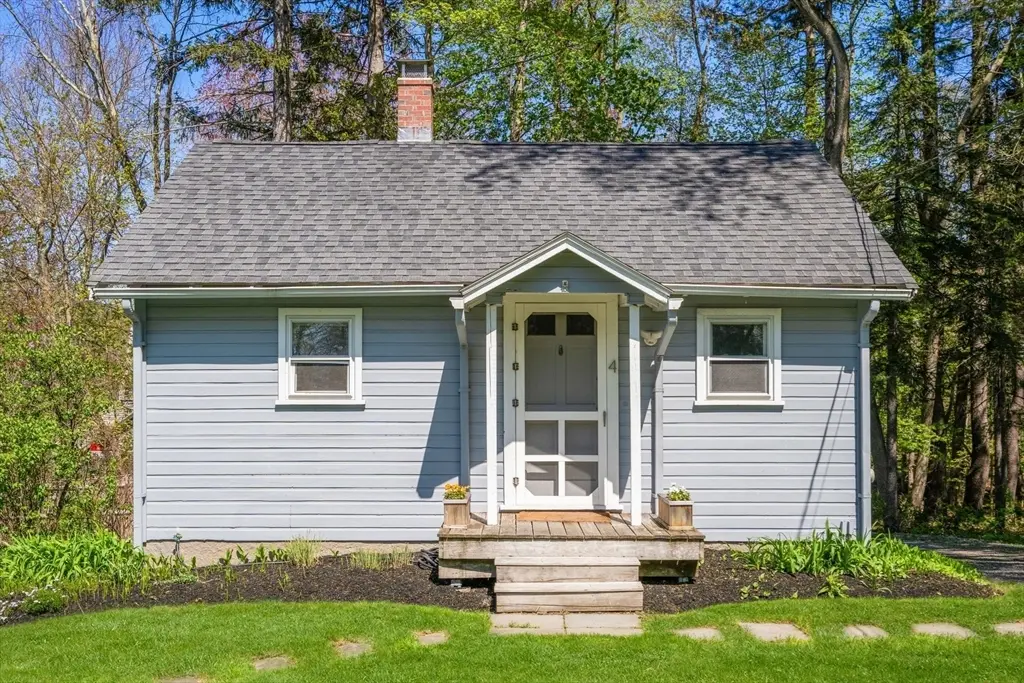
4 Maple Ave · Framingham, MA
Flood risk 6/10 · Moderate
- FEMA flood zone
- X (unshaded)
- Chance of flooding over 30 yrs
- 0.97%
- Est. flood insurance / yr
- $473 – $860
Fire risk 3/10 · Minor
- Est. fire insurance / yr
- $915 – $1,699
Heat risk 5/10 · Moderate
- Hot days now (above 98°F)
- 7 days/yr
- Hot days in 30 yrs
- 15 days/yr
Wind risk 6/10 · Moderate
- Chance of severe wind over 30 yrs
- 27.0%
Air-quality risk 2/10 · Minimal
- Unhealthy air days now
- 1 days/yr
- Unhealthy air days in 30 yrs
- 2 days/yr
Risk factors via First Street. Map © Google.
Why this score? — see what drove the F grade
The composite is a weighted blend of 9 inputs, each scored 0–100. Each bar is that input's sub-score; the figure is the points it added to the 100-point composite (weight × sub-score).
- ARV discount +7.5/15.0
- Schools +7.0/10.0
- Livability +3.8/5.0
- Rent growth +2.5/5.0
- Condition / age +2.5/5.0
- Cash flow +2.1/30.0
- 1% rule +0.0/10.0
- DSCR +0.0/10.0
- Appreciation +0.0/10.0
$485,000
🖨 Deal sheet (PDF) 📄 Offer letter ✓ Due diligence
Listing remarks MLS
Mini house on corner of Rte 20 & Maple Ave. 71+ ft on Rte. 20. Possible home business with special permit. New w/w carpeting in LR, BR & Family room. New hot water heater.
Key facts
- Mature plantings
- Updated kitchen
- Remodeled bungalow
Tags
Property features AI
Finance
- Other: Approximately 480 above-grade finished area and 480 below-grade finished area; Full finished walk-out basement
- HOA & community: Community amenities nearby include shopping, pool, tennis courts, parks, walk/jog trails, stables, golf, bike path, conservation area, and places of worship
Exterior
- Parking: Six off-street parking spaces on stone/gravel surface
- Utilities: Public water; Private sewer; 200+ amp electrical service; Gas for range
- Home design: Single family residence; Grey exterior; Entry level/main and basement (walk-out basement)
- Construction: Frame construction with block foundation; Shingle roof; Built originally per public records; renovated since
- Exterior features: Patio; Fenced yard; Garden; Corner lot with gentle slope; Public road frontage
Interior
- Kitchen: Laminate flooring, stone/granite/solid countertops, overhead lighting; Range, Dishwasher, Refrigerator
- Bedrooms: One main-level bedroom with closet and laminate flooring
- Flooring: Laminate; Tile / Stone-Ceramic
- Bathrooms: One full main-level bathroom with pedestal sink and stone/ceramic tile flooring
- Heating & cooling: Forced air, electric baseboard, and propane heating; Window AC units
- Interior features: Open floor plan with bonus room; Overhead and sconce lighting
- Laundry & utility: Washer and dryer included; Washer hookup and electric dryer hookup in basement; Water heater
Neighborhood map
What this means for you Summary
Snapshot
- This is a 1-bed/1.0-bath single-family listed at $485k.
Deal economics
- At list price, monthly cash flow is $-2k ($-21k/yr) — negative.
- To cash-flow at today's rent, offer at most $174k (64.2% below list).
- To meet the 1% rule (rent ≥ 1% of price), the offer needs to be $186k (61.6% below list).
- Recommended offer: $174k (64.2% below list) — sets the bar for cash-flow.
- Cap rate 1.9% vs local median 2.5% in Framingham — below-typical yield; the buyer is paying a premium for something (appreciation thesis, condition, location) that the cap rate doesn't capture.
Location & tenants
- Location reads 76/100 on livability (#62 in MA, #3,443 nationally) — a middle-class / working-renter tenant base. Strengths: commute A+, employment A+, health & safety A+; Watch: amenities F, cost of living F.
- Sudbury (suburban): math 67% / reading 73% proficiency, ranked #12 of 302 in MA (top 4%) — strong family-tenant draw, lease renewals of 3-5y typical; only 4% free/reduced lunch — higher-income household profile.
- Zoned schools: Israel Loring School (math 58% / reading 70%, grade B, #137 of 938 statewide, top 15%, 426 students, 0% FRL); Ephraim Curtis Middle (math 69% / reading 75%, grade A, #7 of 305 statewide, top 2%, 850 students, 0% FRL); Lincoln-Sudbury Regional High (math 84% / reading 84%, grade A, #28 of 343 statewide, top 8%, 1,484 students, 0% FRL) — zoned schools at 0% FRL track the district average.
- Market conditions: 56 active listings in the ZIP; 3,670 units permitted in Middlesex County in 2024 (2,611 in 5+ unit buildings).
Forward outlook
- Local home prices are declining (-3.0%/yr); year-one equity from $3k of loan paydown is wiped out by about $15k of value loss. Plan a longer hold.
- Middlesex County population projected at +20% by 2050 — long-run rental-demand tailwind backs the buy-and-hold thesis.
Negotiation context
- It's been on market 44 days — a 3% lower offer ($470k) is reasonable based on typical stale-listing flexibility.
- 2 sale attempts since 20y ago with the ask held roughly flat each time — persistent listings suggest the price (not the market) is what's stuck; bring a comps-based counter.
- Current owner paid $330k; 47% above their basis — modest negotiation headroom, anchor on the comps not their cost.
Risks & watch-outs
- Watch-outs: built in 1950 — expect roof / HVAC / electrical / plumbing capex.
- Climate carrying-cost: major flood risk; major wind risk, 27% chance of damaging wind over 30y; extreme-heat days projected 7→15/yr by 2055 (HVAC capex compounding) — expect insurance premiums to compound above CPI over the hold.
Questions for the listing agent
- What do current leases actually rent for vs. the listed asking? Can we see a recent rent roll and the last 12 months of T-12 income?
- It's been on market 44 days. Have you received any prior offers? Is the seller open to a 64% concession, seller financing, or rate buy-down credit?
- Built in 1950 — when were the roof, HVAC, electrical panel, plumbing, and water heater last replaced?
- Is there a deadline driving the sale (1031 exchange, divorce, estate, relocation)? That informs how much negotiation room exists.
- The area grade is low — what's the realistic commute time and amenity access for the typical tenant pool here? Any planned neighborhood developments (good or bad) we should know about?
- What's the average days-on-market for RENTAL listings here right now (not sales)? A rising rental-DOM trend means longer vacancies and softer asking-rent achievability than the comps imply.
- What's the recent tenant-quality profile in this submarket — average credit score on applications, eviction rate, late-payment / NSF rate, and stable-employment percentage? A property-management company in the area should have these aggregated.
- How much new for-sale + rental construction is in the pipeline within 1–3 miles? Heavy new supply typically softens prices + rents 12–24 months out; constrained supply supports both.
Investment metrics
- 1% rule
- 0.38% ✗
- Cap rate
- 1.93%
- Cash-on-cash
- -15.57%
- DSCR
- 0.31
- GRM
- 21.7
CMA / ARV
No comps found within radius.
Projected returns pro-forma
-3.0% appreciation · 3.0% rent growth · sell at horizon
- IRR
- -46.5%
- Equity multiple
- -0.41×
- Total profit
- $-190,861
- Equity at exit
- $72,315
- IRR
- -87.3%
- Equity multiple
- -1.29×
- Total profit
- $-310,889
- Equity at exit
- $41,934
Cash invested: $135,800 (down + closing). Projections, not guarantees.
Landlord ↔ Tenant lean methodology
- Overall (STATE)
- 20 Strongly Tenant-Friendly
- State Massachusetts
- 20 Strongly Tenant-Friendly · D+15
- County
- — inherits STATE
- City
- — inherits STATE
ZIP-level market 01776
- Active inventory
- 56
- Price-to-rent
- 21.7×
Monthly cashflow live
- Estimated rent
- $1,862 medium interval (Pro) →
- Mortgage (P&I)
- −$2,543
- Tax from tax record
- −$488 /mo · $5,850/yr
- Insurance
- −$202
- HOA
- −$0
- Vacancy / Maint / Mgmt
- −$391
- Net cashflow
- $-1,762
Break-even live
Sensitivity live
| Price | -10% $-1,487 | -5% $-1,625 | +0% $-1,762 | +5% $-1,899 | +10% $-2,037 |
|---|---|---|---|---|---|
| Rent | -10% $-1,909 | -5% $-1,836 | +0% $-1,762 | +5% $-1,688 | +10% $-1,615 |
| Rate | -1.0pp $-1,518 | -0.5pp $-1,639 | base $-1,762 | +0.5pp $-1,888 | +1.0pp $-2,016 |
UW: 25.0% down · 7.5% · 30yr · 1.5% tax · 5.0% vac · 8.0% maint · 8.0% mgmt
Financing live
Cash to close
- Down payment
- $121,250
- Closing costs
- $14,550
- Reserves months
- —
- Total cash needed
- —
Loan-product check · same deal, 3 products live
Conventional
25% down · 7.5% · 30yr
- Down + closing
- —
- Monthly P&I
- —
- Monthly cashflow
- —
- DSCR
- —
- Eligible?
- —
Personal DTI + credit; lowest rate.
DSCR
20% down · 8.5% · 30yr
- Down + closing
- —
- Monthly P&I
- —
- Monthly cashflow
- —
- DSCR
- —
- Eligible?
- —
No personal income docs; deal must DSCR.
Hard money
10% down · 12.0% · 12mo
- Down + closing
- —
- Monthly P&I
- —
- Monthly cashflow
- —
- DSCR
- —
- Eligible?
- —
Short-term bridge; refi at stabilization.
Listing history 20 events
-
2026-06-21days on market $485,000 Active 44 DOM
-
2026-06-18days on market $485,000 Active 41 DOM
-
2026-06-17days on market $485,000 Active 40 DOM
-
2026-06-16days on market $485,000 Active 39 DOM
-
2026-06-15days on market $485,000 Active 38 DOM
-
2026-06-13days on market $485,000 Active 36 DOM
-
2026-06-13statusdays on market $485,000 Active 35 DOM
-
2026-06-09days on market $485,000 Price Changed 32 DOM
-
2026-06-08pricestatusdays on market $485,000 Price Changed 31 DOM
-
2026-06-07days on market $500,000 Active 30 DOM
-
2026-06-04days on market $500,000 Active 27 DOM
-
2026-06-03days on market $500,000 Active 26 DOM
-
2026-06-02days on market $500,000 Active 25 DOM
-
2026-06-01days on market $500,000 Active 24 DOM
-
2026-05-31days on market $500,000 Active 23 DOM
-
2026-05-08$500,000 New
-
2006-09-08soldstatus $330,000 183-char remark
Show marketing remark (183 chars)
Mini house on corner of Rte 20 & Maple Ave. 71+ ft on Rte. 20. Possible home business with special permit. New w/w carpeting in LR, BR & Family room. New hot water heater.
-
2006-09-08soldstatus $330,000
Show marketing remark (183 chars)
Mini house on corner of Rte 20 & Maple Ave. 71+ ft on Rte. 20. Possible home business with special permit. New w/w carpeting in LR, BR & Family room. New hot water heater.
-
2006-08-22historical 183-char remark
Show marketing remark (183 chars)
Mini house on corner of Rte 20 & Maple Ave. 71+ ft on Rte. 20. Possible home business with special permit. New w/w carpeting in LR, BR & Family room. New hot water heater.
-
2006-08-15$339,900 183-char remark
Show marketing remark (183 chars)
Mini house on corner of Rte 20 & Maple Ave. 71+ ft on Rte. 20. Possible home business with special permit. New w/w carpeting in LR, BR & Family room. New hot water heater.
ⓘ Source: listings_history table (triggers on properties + properties_extension) + one-shot
backfill from property_details.listing_events for pre-trigger history.
Tax reassessment forecast MA · Partial reset (capped growth)
- Current annual tax
- $5,850 · $488/mo
- Projected year-2 tax
- $5,908 · $492/mo
- Expected delta
- +$58/yr (+$5/mo · 1.0%)
ⓘ Screening estimate from a state-policy table — verify with the county assessor before closing.
Climate risk First Street
- Flood 6/10 Major FEMA zone X (unshaded) · 97% chance over 30 yrs
- Wildfire 3/10 Moderate
- Heat 5/10 Major 7 d/yr ≥98°F today · 15 d/yr by 30 yrs out
- Wind 6/10 Major 27% chance of damaging wind over 30 yrs
- Air quality 2/10 Low 1 unhealthy d/yr today · 2 by 30 yrs out
Nearby sold comps map
Loading sold comps map…
Walkable amenities ~0.75 mi
Loading nearby amenities…
Taxation est. · year 1
- Rental income
- $22,343
- − Mortgage interest
- −$27,168
- − Property taxes
- −$5,850
- − Insurance
- −$2,425
- − Repairs & maintenance
- −$1,787
- − Management
- −$1,787
- − Depreciation
- −$14,109
- Taxable loss
- −$30,783
- Est. tax savings @ 24.0%
- +$7,388
- After-tax cash flow
- $-13,757/yr
For passive investors: Depreciation is non-cash, so a rental often shows a tax loss while cash-flowing — sheltering income. Rental losses are passive: they offset passive income freely, and up to $25,000/yr can offset ordinary (W-2) income if you actively participate and your MAGI is under $100k (phasing out to $0 by $150k); unused losses carry forward. On sale, claimed depreciation is recaptured at up to 25%, and gains may owe capital-gains tax (a 1031 exchange can defer both). Figures are a year-1 estimate at your 24.0% rate — not tax advice; consult a CPA.
Schools (NCES district)
- District
- Sudbury
- NCES district ID
- 2511340
- Math proficiency
- 67% ▼ -6.00%
- Reading proficiency
- 73% ▼ -3.00%
- Median HH income
- $162,050
- Composite
- 70.06/100
- National rank
- #278
- State rank
- #12 of 302 in MA
Livability — Framingham
- Score
- 76/100
- State rank
- #62
- US rank
- #3443
Category grades
Schools grade is shown separately in the Schools card above.
Census & demographics
- City population
- 72,407
- Population (ZIP)
- 19,067
Population outlook (Middlesex County) Hauer SSP2
- Today (2025)
- 1,740,269 people
- By 2030
- 1,817,187 · +4.4%
- By 2040
- 1,963,195 · +12.8%
- By 2050
- 2,087,461 · +20.0%
- By 2075
- 2,344,036 · +34.7%
- By 2100
- 2,383,776 · +37.0%
Race, ethnicity, and origin ACS 2023
- Neighborhood character
- Predominantly White (79%)
- Race & ethnicity
- White 79% Asian 10% Two or more races 6% Hispanic / Latino 4% Black 1%
- Common ancestry
- Romanian 4% Italian 4% Lithuanian 3%
- Foreign-born
- 13% · China, Canada, South Korea
- Languages at home
- 86% English-only · Other Indo-European 5% Chinese 4% Russian/Polish/Slavic 2%
Political lean MEDSL · Middlesex
- 2024 margin
- Solid D (+39.5) · D 68.5% · R 29.0% · Other 2.5%
- 2008→2024 swing
- +9.3pp toward D · 2008: 30.1pp · 2024: 39.5pp
- All cycles
- 2024: D+39.5 2020: D+45.2 2016: D+38.1 2012: D+26.9 2008: D+30.1
Not yet ingested
- Civics
- —
Market trends
- HPI YoY
- ▼ -404.24%
- Current HPI
- 239.3805
- Rent YoY
- —
- Metro
- —
- State GDP YoY
- ▲ 2.28%
- F500 in state
- 38
Industry mix (Fortune 500 HQ in MA)
| Industry | F500 HQs | Revenue |
|---|---|---|
| Technology | 3 | $17B |
|
||
| Insurance | 2 | $84B |
|
||
| Retail | 2 | $76B |
|
||
| Life Sciences | 1 | $43B |
|
||
| Energy Technology | 1 | $31B |
|
||
| Aerospace / Defense | 1 | $18B |
|
||
Price history
+47.1% since first listed5 events — show timeline
- 2026-05-08 Listed $500,000 MLS PIN
- 2006-09-08 Sold (Public Records) $330,000 Public Records
- 2006-09-08 Sold (MLS) $330,000 MLS PIN
- 2006-08-22 Listing Removed — MLS PIN
- 2006-08-15 Listed $339,900 MLS PIN
Property tax history
+1.8%/yrLatest (2025): $5,850 · +3.3% YoY. Source: county tax records.
Cash-flow waterfall
monthlySold comps — $/sqft
last 12 mo · ≤1 miLoading sold comps…