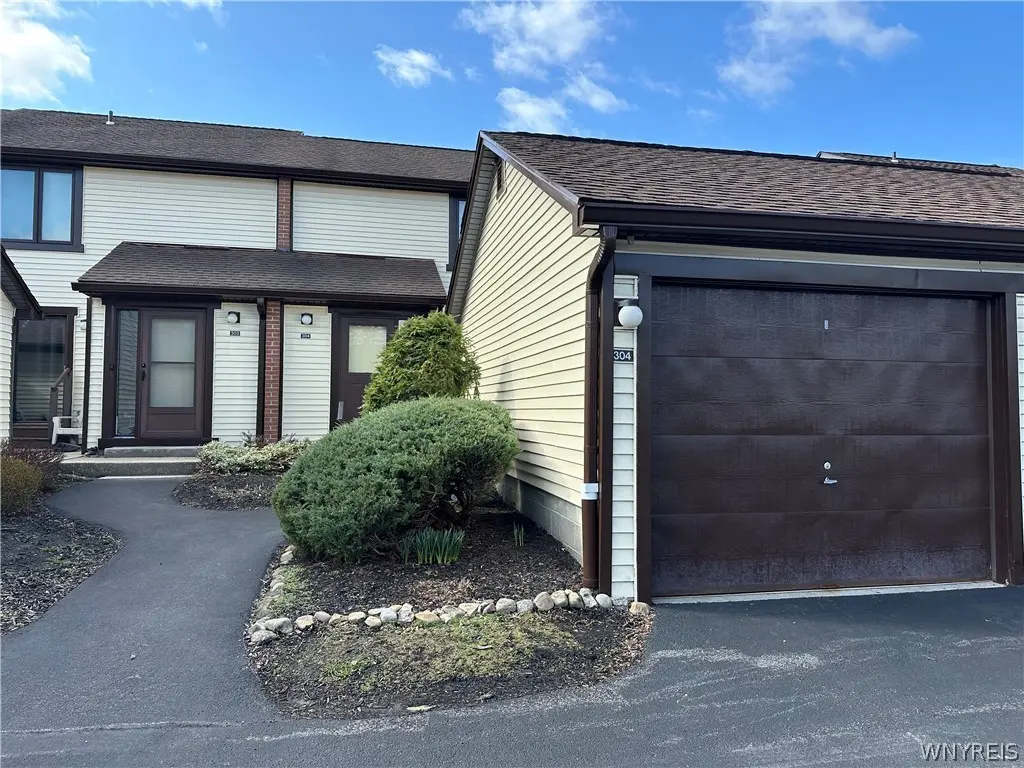
304 Charlesgate Cir · Harris Hill, NY
Flood risk 1/10 · Minimal
- FEMA flood zone
- X (shaded)
- Chance of flooding over 30 yrs
- 0.0%
- Est. flood insurance / yr
- $473 – $860
Fire risk 3/10 · Minor
- Est. fire insurance / yr
- $691 – $1,283
Heat risk 3/10 · Minor
- Hot days now (above 94°F)
- 7 days/yr
- Hot days in 30 yrs
- 16 days/yr
Wind risk 1/10 · Minimal
- Chance of severe wind over 30 yrs
- —
Air-quality risk 2/10 · Minimal
- Unhealthy air days now
- 2 days/yr
- Unhealthy air days in 30 yrs
- 2 days/yr
Risk factors via First Street. Map © Google.
Why this score? — see what drove the D grade
The composite is a weighted blend of 9 inputs, each scored 0–100. Each bar is that input's sub-score; the figure is the points it added to the 100-point composite (weight × sub-score).
- ARV discount +13.1/15.0
- Cash flow +6.8/30.0
- Schools +6.3/10.0
- 1% rule +3.9/10.0
- Rent growth +3.9/5.0
- Livability +3.6/5.0
- Condition / age +2.5/5.0
- DSCR +1.1/10.0
- Appreciation +0.0/10.0
$222,800
🖨 Deal sheet 📄 Offer letter ✓ Due diligence
Listing remarks MLS
Great 2-bedroom 11/2 bath in the Charlesgate community. Garage with an additional parking space, Patio in front and back yard. Living room, Dining room. Full basement partly finished. Easy living! Pools, tot lots and tennis part of the Ransom Oaks community for your pleasure. Some updates and all in nice condition 1 Dog or 1 cat allowed.
Key facts
- $305 HOA
- Garage
- Community pool
Neighborhood map
What this means for you Summary
Snapshot
- This is a 2-bed/1.5-bath townhouse listed at $223k.
Deal economics
- At list price, monthly cash flow is $-342 ($-4k/yr) — negative.
- To cash-flow at today's rent, offer at most $162k (27.1% below list).
- To meet the 1% rule (rent ≥ 1% of price), the offer needs to be $198k (11.3% below list).
- Recommended offer: $162k (27.1% below list) — sets the bar for cash-flow.
- Cap rate 4.4% vs local median 2.6% in Harris Hill — top-decile yield for the area; either an underpriced asset or a hidden risk that comps aren't pricing in. Stress-test before assuming the spread holds.
Location & tenants
- Location reads 72/100 on livability (#345 in NY) — a middle-class / working-renter tenant base. Strengths: employment A+, housing A+, health & safety A-; Watch: amenities F, commute F, cost of living F.
- Williamsville Central School District (suburban): math 64% / reading 77% proficiency, ranked #114 of 590 in NY (top 19%) — strong family-tenant draw, lease renewals of 3-5y typical; only 10% free/reduced lunch — higher-income household profile.
- Market conditions: Rents rising fast (+5.6%/yr); 152 active listings in the ZIP; 4 comparable units currently listed for rent nearby; rentals leasing fast (median 2d on market — plan ~1-2 weeks tenant-placement turnaround); high-income renter base; 1,244 units permitted in Erie County in 2024 (563 in 5+ unit buildings).
- This rent is only 17% of the median local income ($136k/yr) — well below the 30% rent-burden line; pricing power to push rent on renewal without tenant pushback.
Forward outlook
- Local home prices are declining (-3.0%/yr); year-one equity from $2k of loan paydown is wiped out by about $7k of value loss. Plan a longer hold.
Negotiation context
- It's been on market 73 days — a 6% lower offer ($209k) is reasonable based on typical stale-listing flexibility.
Questions for the listing agent
- What do current leases actually rent for vs. the listed asking? Can we see a recent rent roll and the last 12 months of T-12 income?
- It's been on market 73 days. Have you received any prior offers? Is the seller open to a 27% concession, seller financing, or rate buy-down credit?
- Built in 1973 — when were the roof, HVAC, electrical panel, plumbing, and water heater last replaced?
- What does the HOA fee cover, when was the last increase, and are there any pending special assessments or reserve-fund shortfalls?
- Why hasn't it sold? Are there any deal-killer items the seller is aware of (foundation, flood, title, zoning, code violations)?
- Is there a deadline driving the sale (1031 exchange, divorce, estate, relocation)? That informs how much negotiation room exists.
- Schools are B-rated — typically a magnet for longer-tenancy family renters. What's the average tenant stay here, and is there a school-zone premium baked into asking?
- The area grade is low — what's the realistic commute time and amenity access for the typical tenant pool here? Any planned neighborhood developments (good or bad) we should know about?
- What's the average days-on-market for RENTAL listings here right now (not sales)? A rising rental-DOM trend means longer vacancies and softer asking-rent achievability than the comps imply.
- What's the recent tenant-quality profile in this submarket — average credit score on applications, eviction rate, late-payment / NSF rate, and stable-employment percentage? A property-management company in the area should have these aggregated.
- How much new for-sale + rental construction is in the pipeline within 1–3 miles? Heavy new supply typically softens prices + rents 12–24 months out; constrained supply supports both.
Investment metrics
- 1% rule
- 0.89% ✗
- Cap rate
- 4.45%
- Cash-on-cash
- -6.59%
- DSCR
- 0.71
- GRM
- 9.4
CMA / ARV
- ARV (median comp)
- $254,276
- List price
- $222,800
- Delta
- -12.38%
- Verdict
- UNDERPRICED
- Comps
- 20 within 1.0 mi
Show comp detail 12 sales within ~0.75 mi
| Address | Dist | Beds/Ba | Sqft | Sold | Price | $/sf | Match |
|---|---|---|---|---|---|---|---|
| 1651 Charlesgate Cir #1651 | 0.13mi | 2/2.5 | 1,196 (+2%) | 4mo | $255,000 | $213 | 84 |
| 907 Charlesgate Cir | 0.07mi | 2/2.5 | 1,247 (+6%) | 1mo | $267,000 | $214 | 80 |
| 41 Tralee Ter | 0.31mi | 2/2.0 | 1,196 (+2%) | 0mo | $320,000 | $268 | 79 |
| 207 Charlesgate Cir | 0.02mi | 3/2.5 (+1) | 1,247 (+6%) | 4mo | $255,000 | $204 | 76 |
| 31 Tralee | 0.33mi | 2/2.0 | 1,214 (+4%) | 3mo | $285,000 | $235 | 74 |
| 1052 Charlesgate Cir | 0.13mi | 2/2.5 | 1,247 (+6%) | 7mo | $260,000 | $209 | 73 |
| 45 Bee Hunter Ct Unit D | 0.31mi | 2/2.0 | 1,102 (-6%) | 2mo | $185,000 | $168 | 72 |
| 24 Coolbrook Ct Unit D | 0.26mi | 2/2.0 | 1,102 (-6%) | 6mo | $172,000 | $156 | 71 |
| 2 Southcreek Ct Unit B | 0.21mi | 2/1.0 | 1,028 (-12%) | 7mo | $162,000 | $158 | 62 |
| 12 Southcreek Ct Unit B | 0.28mi | 2/1.0 | 1,028 (-12%) | 4mo | $168,000 | $163 | 61 |
| 10 Southcreek Ct Unit B | 0.26mi | 2/1.0 | 1,028 (-12%) | 7mo | $157,000 | $153 | 59 |
| 354 Old Meadow Dr | 0.37mi | 2/1.5 | 1,346 (+15%) | 7mo | $280,000 | $208 | 52 |
Match score weights: distance 35% · size 25% · config 20% · recency 20%. Top-matched comps best support the ARV.
Projected returns pro-forma
-3.0% appreciation · 5.59% rent growth · sell at horizon
- IRR
- -23.9%
- Equity multiple
- 0.16×
- Total profit
- $-52,376
- Equity at exit
- $33,220
- IRR
- -11.7%
- Equity multiple
- 0.20×
- Total profit
- $-49,807
- Equity at exit
- $19,264
Cash invested: $62,384 (down + closing). Projections, not guarantees.
Landlord ↔ Tenant lean methodology
- Overall (STATE)
- 15 Strongly Tenant-Friendly
- State New York
- 15 Strongly Tenant-Friendly · D+10
- County
- — inherits STATE
- City
- — inherits STATE
ZIP-level market 14051
- Home prices YoY
- -22.5%
- Rents YoY
- 5.6%
- Active inventory
- 152
- Price-to-rent
- 9.4×
Monthly cashflow live
- Estimated rent
- $1,975 medium interval (Pro) →
- Mortgage (P&I)
- −$1,168
- Tax from tax record
- −$337 /mo · $4,041/yr
- Insurance
- −$93
- HOA
- −$305
- Vacancy / Maint / Mgmt
- −$415
- Net cashflow
- $-342
Break-even live
UW: 25.0% down · 7.5% · 30yr · 1.5% tax · 5.0% vac · 8.0% maint · 8.0% mgmt
Financing live
Cash to close
- Down payment
- $55,700
- Closing costs
- $6,684
- Reserves months
- —
- Total cash needed
- —
Loan-product check · same deal, 3 products live
Conventional
25% down · 7.5% · 30yr
- Down + closing
- —
- Monthly P&I
- —
- Monthly cashflow
- —
- DSCR
- —
- Eligible?
- —
Personal DTI + credit; lowest rate.
DSCR
20% down · 8.5% · 30yr
- Down + closing
- —
- Monthly P&I
- —
- Monthly cashflow
- —
- DSCR
- —
- Eligible?
- —
No personal income docs; deal must DSCR.
Hard money
10% down · 12.0% · 12mo
- Down + closing
- —
- Monthly P&I
- —
- Monthly cashflow
- —
- DSCR
- —
- Eligible?
- —
Short-term bridge; refi at stabilization.
Rent comps 4 comps
| Address | Beds | Baths | Sqft | Rent | $/sqft | DOM | Units | Dist |
|---|---|---|---|---|---|---|---|---|
| 45 Beehunter Ct Unit D East Amherst, NY | 2.0 | 2.0 | 1102 | $1,850 | $1.68 | 43d | 1 | 0.28mi |
| 2250 N French Rd Getzville, NY | 1.0–2.0 | 1.0 | 814 | $1,700 | $2.09 | 1d | 1 | 1.28mi |
| 4410-4420 N French Rd East Amherst, NY | 1.0–3.0 | 1.0–2.5 | 1176 | $2,222 | $1.89 | 1d | 1 | 1.39mi |
| 5 Autumn Creek Ln East Amherst, NY | 1.0–2.0 | 1.0–2.0 | 1120 | $2,053 | $1.83 | 1d | 10 | 1.44mi |
HOA detail
- Monthly dues
- $305 · $3,660/yr
- Likely covers
- pool
Listing history 17 events
-
2026-06-18days on market $222,800 Active 73 DOM
-
2026-06-17days on market $222,800 Active 72 DOM
-
2026-06-16pricedays on market $222,800 Active 71 DOM
-
2026-06-15days on market $228,800 Active 70 DOM
-
2026-06-13days on market $228,800 Active 68 DOM
-
2026-06-10days on market $228,800 Active 65 DOM
-
2026-06-09days on market $228,800 Active 64 DOM
-
2026-06-08days on market $228,800 Active 63 DOM
-
2026-06-07remarks 373-char remark
-
2026-06-07days on market $228,800 Active 62 DOM
-
2026-06-05days on market $228,800 Active 59 DOM
-
2026-06-03days on market $228,800 Active 58 DOM
-
2026-06-02days on market $228,800 Active 57 DOM
-
2026-06-01days on market $228,800 Active 56 DOM
-
2026-05-31days on market $228,800 Active 55 DOM
-
2026-04-29price $228,800 343-char remark
Show marketing remark (343 chars)
Great 2-bedroom 11/2 bath in the Charlesgate community. Garage with an additional parking space, Patio in front and back yard. Living room, Dining room. Full basement partly finished. Easy living! Pools, tot lots and tennis part of the Ransom Oaks community for your pleasure. Some updates and all in nice condition 1 Dog or 1 cat allowed.
-
2026-04-06$238,000 Active 343-char remark
Show marketing remark (343 chars)
Great 2-bedroom 11/2 bath in the Charlesgate community. Garage with an additional parking space, Patio in front and back yard. Living room, Dining room. Full basement partly finished. Easy living! Pools, tot lots and tennis part of the Ransom Oaks community for your pleasure. Some updates and all in nice condition 1 Dog or 1 cat allowed.
ⓘ Source: listings_history table (triggers on properties + properties_extension) + one-shot
backfill from property_details.listing_events for pre-trigger history.
Tax reassessment forecast NY · Partial reset (capped growth)
- Current annual tax
- $4,041 · $337/mo
- Projected year-2 tax
- $4,041 · $337/mo
- Expected delta
- $0/yr ($0/mo · 0.0%)
ⓘ Screening estimate from a state-policy table — verify with the county assessor before closing.
Climate risk First Street
- Flood 1/10 Low FEMA zone X (shaded) · 0% chance over 30 yrs
- Wildfire 3/10 Moderate
- Heat 3/10 Moderate 7 d/yr ≥94°F today · 16 d/yr by 30 yrs out
- Wind 1/10 Low
- Air quality 2/10 Low 2 unhealthy d/yr today · 2 by 30 yrs out
Nearby sold comps map
Loading sold comps map…
Walkable amenities ~0.75 mi
Loading nearby amenities…
Taxation est. · year 1
- Rental income
- $23,705
- − Mortgage interest
- −$12,480
- − Property taxes
- −$4,041
- − Insurance
- −$1,114
- − Repairs & maintenance
- −$1,896
- − Management
- −$1,896
- − HOA
- −$3,660
- − Depreciation
- −$6,481
- Taxable loss
- −$7,864
- Est. tax savings @ 24.0%
- +$1,887
- After-tax cash flow
- $-2,221/yr
For passive investors: Depreciation is non-cash, so a rental often shows a tax loss while cash-flowing — sheltering income. Rental losses are passive: they offset passive income freely, and up to $25,000/yr can offset ordinary (W-2) income if you actively participate and your MAGI is under $100k (phasing out to $0 by $150k); unused losses carry forward. On sale, claimed depreciation is recaptured at up to 25%, and gains may owe capital-gains tax (a 1031 exchange can defer both). Figures are a year-1 estimate at your 24.0% rate — not tax advice; consult a CPA.
Schools (NCES district)
- District
- Williamsville Central School District
- NCES district ID
- 3631470
- Math proficiency
- 64% ▼ -14.00%
- Reading proficiency
- 77% ▲ 6.00%
- Median HH income
- $79,907
- Composite
- 62.59/100
- National rank
- #678
- State rank
- #114 of 590 in NY
Livability — Harris Hill
- Score
- 72/100
- State rank
- #345
- US rank
- #5816
Category grades
Schools grade is shown separately in the Schools card above.
Census & demographics
- County
- Erie County · 714,559 people
- Metro
- Buffalo-Cheektowaga, NY
- Population (ZIP)
- 19,739
- Household income
- $135,663
- Rent vs Own
- Severe rent burden
- 375.0
Population outlook (Erie County) Hauer SSP2
- Today (2025)
- 933,037 people
- By 2030
- 935,181 · +0.2%
- By 2040
- 928,531 · -0.5%
- By 2050
- 905,725 · -2.9%
- By 2075
- 834,037 · -10.6%
- By 2100
- 708,033 · -24.1%
Race, ethnicity, and origin ACS 2023
- Neighborhood character
- Predominantly White (82%)
- Race & ethnicity
- White 82% Asian 9% Two or more races 4% Hispanic / Latino 4% Black 2%
- Common ancestry
- Romanian 13% Italian 2% Subsaharan African 2%
- Foreign-born
- 14% · Canada, China, Jamaica
- Languages at home
- 85% English-only · Other Indo-European 6% Chinese 2% Russian/Polish/Slavic 2%
Political lean MEDSL · Erie
- 2024 margin
- Lean D (+9.7) · D 54.8% · R 45.2%
- 2008→2024 swing
- -7.9pp toward R · 2008: 17.5pp · 2024: 9.7pp
- All cycles
- 2024: D+9.7 2020: D+14.7 2016: D+4.8 2012: D+15.6 2008: D+17.5
Not yet ingested
- Civics
- —
Market trends
- HPI YoY
- ▼ -93.55%
- Current HPI
- 322.688
- Rent YoY
- ▲ 5.59%
- Metro
- Buffalo-Cheektowaga, NY
- State GDP YoY
- ▲ 2.60%
- F500 in state
- 92
Industry mix (Fortune 500 HQ in NY)
| Industry | F500 HQs | Revenue |
|---|---|---|
| Financial Services | 10 | $950B |
|
||
| Consumer Goods | 9 | $162B |
|
||
| Insurance | 4 | $225B |
|
||
| Telecommunications | 2 | $144B |
|
||
| Pharmaceuticals | 2 | $112B |
|
||
| Media / Entertainment | 2 | $69B |
|
||
Price history
-3.9% since first listed2 events — show timeline
- 2026-04-29 Price Changed $228,800 WNYREIS
- 2026-04-06 Listed $238,000 WNYREIS
Property tax history
+3.6%/yrLatest (2025): $4,041 · +1.7% YoY. Source: county tax records.
Cash-flow waterfall
monthlySold comps — $/sqft
last 12 mo · ≤1 miLoading sold comps…