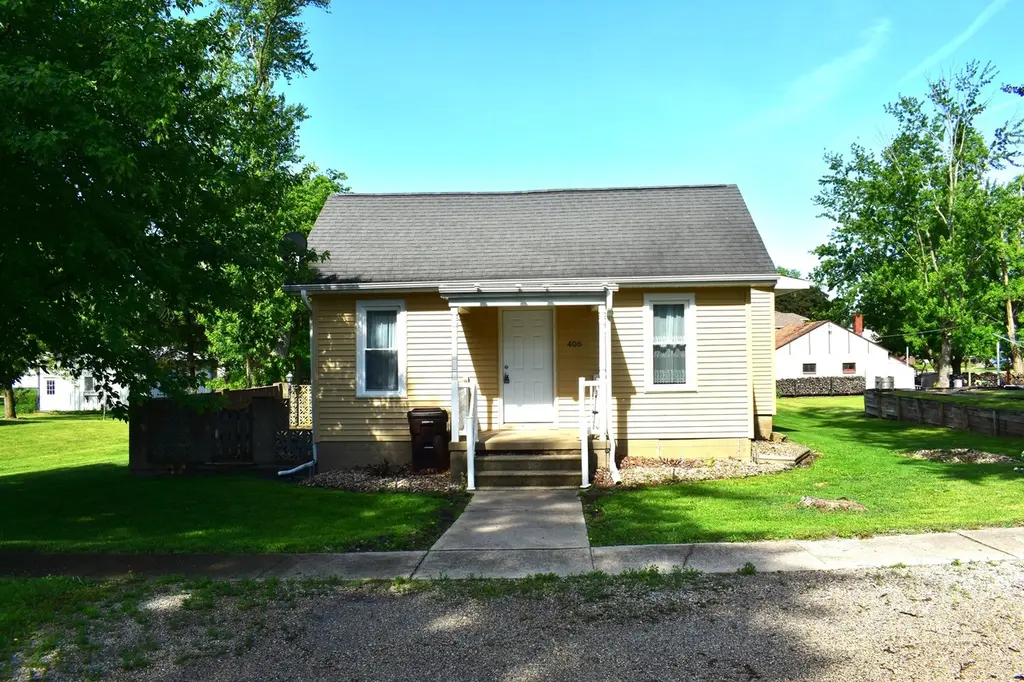
406 N Birch St · Wenona, IL
Flood risk 1/10 · Minimal
- FEMA flood zone
- X (unshaded)
- Chance of flooding over 30 yrs
- 0.0%
- Est. flood insurance / yr
- $473 – $860
Fire risk 1/10 · Minimal
- Est. fire insurance / yr
- $804 – $1,492
Heat risk 3/10 · Minor
- Hot days now (above 105°F)
- 7 days/yr
- Hot days in 30 yrs
- 17 days/yr
Wind risk 2/10 · Minimal
- Chance of severe wind over 30 yrs
- 1.0%
Air-quality risk 3/10 · Minor
- Unhealthy air days now
- 2 days/yr
- Unhealthy air days in 30 yrs
- 4 days/yr
Risk factors via First Street. Map © Google.
Why this score? — see what drove the F grade
The composite is a weighted blend of 9 inputs, each scored 0–100. Each bar is that input's sub-score; the figure is the points it added to the 100-point composite (weight × sub-score).
- Cash flow +11.9/30.0
- Appreciation +5.5/10.0
- DSCR +3.5/10.0
- 1% rule +3.4/10.0
- Livability +3.1/5.0
- Rent growth +2.5/5.0
- Condition / age +2.5/5.0
- Schools +2.1/10.0
- ARV discount +0.0/15.0
$112,900
🖨 Deal sheet (PDF) 📄 Offer letter ✓ Due diligence
Listing remarks MLS
Take a look at this ranch style home! 2 bedroom, 1 full bathroom, and main level laundry! Close to the highway, Open backyard, side cement patio, front porch, and more.
Key facts
- 0.26 acre lot
- 2 garage spots
- Built 1915
Property features AI
Finance
- Other: Parcel number 07242010070; Tax exemptions noted for homeowner, senior, and disabled veteran
- HOA & community: No master association fee required
Exterior
- Parking: Detached garage with garage door opener; Owned garage; Total parking for about 6 vehicles; Two garage spaces
- Utilities: Public water; Public sewer
- Home design: Detached single-family home; One-story; Fee simple ownership; Property over 100 years old; Built before 1978
- Construction: Vinyl and wood siding; No recent rebuild or rehab reported
- Exterior features: Lot dimensions about 70 x 160; Approximately 0.25–0.49 acre lot; Gravel parking area out front (per directions)
Interior
- Kitchen: Kitchen on main level (approx. 17 x 11)
- Bedrooms: Two bedrooms (main level); Master bedroom on main level (approx. 15 x 11); Second bedroom on main level (approx. 10 x 12); Additional bedrooms listed
- Bathrooms: One full bathroom
- Heating & cooling: Natural gas heating; Central air conditioning
- Interior features: Four total rooms; Kitchen/dining combo; Crawl space basement
- Laundry & utility: Main-level laundry room (approx. 9 x 7)
Neighborhood map
What this means for you Summary
Snapshot
- This is a 2-bed/1.0-bath single-family listed at $113k.
Deal economics
- At list price, monthly cash flow is $-29 ($-349/yr) — negative.
- To cash-flow at today's rent, offer at most $109k (3.7% below list).
- To meet the 1% rule (rent ≥ 1% of price), the offer needs to be $95k (15.8% below list).
- Recommended offer: $95k (15.8% below list) — sets the bar for 1% rule.
Location & tenants
- Location reads 61/100 on livability (#906 in IL) — a middle-class / working-renter tenant base. Strengths: crime A+, cost of living A+, housing A-; Watch: health & safety C-, amenities F, commute F.
- Fieldcrest CUSD 6 (rural): math 18% / reading 29% proficiency, ranked #361 of 620 in IL (top 58%) — low school quality limits family demand, transient renter base, plan for 1-2y turnover.
- Zoned schools: Fieldcrest Primary School (197 students, 0% FRL); Fieldcrest Middle School (math 17% / reading 37%, grade F, #302 of 665 statewide, top 47%, 195 students, 0% FRL); Fieldcrest High School (math 27% / reading 27%, grade F, #218 of 693 statewide, top 35%, 270 students, 0% FRL) — zoned schools average 0% FRL vs 41% district-wide (41 pts lower); this property's tenant base skews higher-income than the district average.
- Market conditions: 4 active listings in the ZIP; 9 units permitted in Marshall County in 2024 (0 in 5+ unit buildings).
Forward outlook
- In year one you build about $2k of equity ($781 loan paydown + $1k appreciation (1.1% local appreciation)).
- Marshall County population projected at -32% by 2050 — secular population decline; favor cash flow + early exit over multi-decade hold.
Negotiation context
- It's been on market 34 days — a 3% lower offer ($110k) is reasonable based on typical stale-listing flexibility.
- 2 sale attempts since 4y ago; this cycle's ask has dropped $7k (6%) from the opening price — seller is motivated, your offer sets the floor, not the list.
- Current owner paid $45k; list at $113k implies a 151% gain — meaningful room to come down on a strong offer.
Risks & watch-outs
- Watch-outs: built in 1915 — expect roof / HVAC / electrical / plumbing capex.
Questions for the listing agent
- What do current leases actually rent for vs. the listed asking? Can we see a recent rent roll and the last 12 months of T-12 income?
- It's been on market 34 days. Have you received any prior offers? Is the seller open to a 16% concession, seller financing, or rate buy-down credit?
- Built in 1915 — when were the roof, HVAC, electrical panel, plumbing, and water heater last replaced?
- Is there a deadline driving the sale (1031 exchange, divorce, estate, relocation)? That informs how much negotiation room exists.
- Schools are F-rated, which usually means shorter tenancies and higher turnover. Who's the typical renter profile here, and what's been the actual vacancy rate?
- The area grade is low — what's the realistic commute time and amenity access for the typical tenant pool here? Any planned neighborhood developments (good or bad) we should know about?
- What's the average days-on-market for RENTAL listings here right now (not sales)? A rising rental-DOM trend means longer vacancies and softer asking-rent achievability than the comps imply.
- What's the recent tenant-quality profile in this submarket — average credit score on applications, eviction rate, late-payment / NSF rate, and stable-employment percentage? A property-management company in the area should have these aggregated.
- How much new for-sale + rental construction is in the pipeline within 1–3 miles? Heavy new supply typically softens prices + rents 12–24 months out; constrained supply supports both.
Investment metrics
- 1% rule
- 0.84% ✗
- Cap rate
- 5.98%
- Cash-on-cash
- -1.10%
- DSCR
- 0.95
- GRM
- 9.9
CMA / ARV
- ARV (on-the-fly)
- $89,420
- Comps found
- 6
Show comp detail 6 sales within ~0.75 mi
| Address | Dist | Beds/Ba | Sqft | Sold | Price | $/sf | Match |
|---|---|---|---|---|---|---|---|
| 401 N Pine St | 0.06mi | 2/1.0 | 996 (-5%) | 14mo | $85,000 | $85 | 77 |
| 118 Spruce St | 0.29mi | 2/1.0 | 1,042 (-1%) | 20mo | $59,000 | $57 | 69 |
| 302 S Hickory St | 0.42mi | 2/1.0 | 1,117 (+6%) | 10mo | $75,000 | $67 | 62 |
| 210 S Spruce St | 0.39mi | 3/1.0 (+1) | 1,020 (-3%) | 20mo | $59,500 | $58 | 56 |
| 311 S Hickory St | 0.45mi | 3/1.5 (+1) | 940 (-11%) | 12mo | $112,000 | $119 | 44 |
| 316 S Walnut St | 0.49mi | 2/1.0 | 912 (-13%) | 22mo | $99,000 | $109 | 36 |
Match score weights: distance 35% · size 25% · config 20% · recency 20%. Top-matched comps best support the ARV.
Projected returns pro-forma
1.08% appreciation · 3.0% rent growth · sell at horizon
- IRR
- 0.4%
- Equity multiple
- 1.02×
- Total profit
- $705
- Equity at exit
- $39,001
- IRR
- 5.1%
- Equity multiple
- 1.63×
- Total profit
- $20,020
- Equity at exit
- $52,185
Cash invested: $31,612 (down + closing). Projections, not guarantees.
Landlord ↔ Tenant lean methodology
- Overall (STATE)
- 43 Moderately Tenant-Leaning
- State Illinois
- 43 Moderately Tenant-Leaning · D+7
- County
- — inherits STATE
- City
- — inherits STATE
ZIP-level market 61377
- Home prices YoY
- 0.6%
- Active inventory
- 4
- Price-to-rent
- 9.9×
Monthly cashflow live
- Estimated rent
- $951 medium interval (Pro) →
- Mortgage (P&I)
- −$592
- Tax est. 1.5%
- −$141 /mo · $1,694/yr
- Insurance
- −$47
- HOA
- −$0
- Vacancy / Maint / Mgmt
- −$200
- Net cashflow
- $-29
Break-even live
Sensitivity live
| Price | -10% $49 | -5% $10 | +0% $-29 | +5% $-68 | +10% $-107 |
|---|---|---|---|---|---|
| Rent | -10% $-104 | -5% $-67 | +0% $-29 | +5% $8 | +10% $46 |
| Rate | -1.0pp $28 | -0.5pp $0 | base $-29 | +0.5pp $-58 | +1.0pp $-88 |
UW: 25.0% down · 7.5% · 30yr · 1.5% tax · 5.0% vac · 8.0% maint · 8.0% mgmt
Financing live
Cash to close
- Down payment
- $28,225
- Closing costs
- $3,387
- Reserves months
- —
- Total cash needed
- —
Loan-product check · same deal, 3 products live
Conventional
25% down · 7.5% · 30yr
- Down + closing
- —
- Monthly P&I
- —
- Monthly cashflow
- —
- DSCR
- —
- Eligible?
- —
Personal DTI + credit; lowest rate.
DSCR
20% down · 8.5% · 30yr
- Down + closing
- —
- Monthly P&I
- —
- Monthly cashflow
- —
- DSCR
- —
- Eligible?
- —
No personal income docs; deal must DSCR.
Hard money
10% down · 12.0% · 12mo
- Down + closing
- —
- Monthly P&I
- —
- Monthly cashflow
- —
- DSCR
- —
- Eligible?
- —
Short-term bridge; refi at stabilization.
Listing history 20 events
-
2026-06-19days on market $112,900 Active 34 DOM
-
2026-06-18days on market $112,900 Active 33 DOM
-
2026-06-17days on market $112,900 Active 32 DOM
-
2026-06-17price $112,900 Active 31 DOM
-
2026-06-16days on market $119,900 Active 31 DOM
-
2026-06-15days on market $119,900 Active 30 DOM
-
2026-06-14days on market $119,900 Active 28 DOM
-
2026-06-12days on market $119,900 Active 27 DOM
-
2026-06-09days on market $119,900 Active 24 DOM
-
2026-06-08days on market $119,900 Active 23 DOM
-
2026-06-07days on market $119,900 Active 22 DOM
-
2026-06-02days on market $119,900 Active 17 DOM
-
2026-06-01days on market $119,900 Active 16 DOM
-
2026-05-31days on market $119,900 Active 15 DOM
-
2026-05-30days on market $119,900 Active 14 DOM
-
2026-05-16$119,900 Active
-
2022-04-06soldstatus $45,000 168-char remark
Show marketing remark (168 chars)
Take a look at this ranch style home! 2 bedroom, 1 full bathroom, and main level laundry! Close to the highway, Open backyard, side cement patio, front porch, and more.
-
2022-04-06soldstatus $45,000
Show marketing remark (168 chars)
Take a look at this ranch style home! 2 bedroom, 1 full bathroom, and main level laundry! Close to the highway, Open backyard, side cement patio, front porch, and more.
-
2022-03-19$49,900 168-char remark
Show marketing remark (168 chars)
Take a look at this ranch style home! 2 bedroom, 1 full bathroom, and main level laundry! Close to the highway, Open backyard, side cement patio, front porch, and more.
-
2012-10-24soldstatus $31,000
ⓘ Source: listings_history table (triggers on properties + properties_extension) + one-shot
backfill from property_details.listing_events for pre-trigger history.
Climate risk First Street
- Flood 1/10 Low FEMA zone X (unshaded) · 0% chance over 30 yrs
- Wildfire 1/10 Low
- Heat 3/10 Moderate 7 d/yr ≥105°F today · 17 d/yr by 30 yrs out
- Wind 2/10 Low 100% chance of damaging wind over 30 yrs
- Air quality 3/10 Moderate 2 unhealthy d/yr today · 4 by 30 yrs out
Nearby sold comps map
Loading sold comps map…
Walkable amenities ~0.75 mi
Loading nearby amenities…
Taxation est. · year 1
- Rental income
- $11,410
- − Mortgage interest
- −$6,324
- − Property taxes
- −$1,694
- − Insurance
- −$564
- − Repairs & maintenance
- −$913
- − Management
- −$913
- − Depreciation
- −$3,284
- Taxable loss
- −$2,282
- Est. tax savings @ 24.0%
- +$548
- After-tax cash flow
- $199/yr
For passive investors: Depreciation is non-cash, so a rental often shows a tax loss while cash-flowing — sheltering income. Rental losses are passive: they offset passive income freely, and up to $25,000/yr can offset ordinary (W-2) income if you actively participate and your MAGI is under $100k (phasing out to $0 by $150k); unused losses carry forward. On sale, claimed depreciation is recaptured at up to 25%, and gains may owe capital-gains tax (a 1031 exchange can defer both). Figures are a year-1 estimate at your 24.0% rate — not tax advice; consult a CPA.
Schools (NCES district)
- District
- Fieldcrest CUSD 6
- NCES district ID
- 1715100
- Math proficiency
- 18% ▲ 2.00%
- Reading proficiency
- 29% ▼ -5.00%
- Median HH income
- $50,151
- Composite
- 20.79/100
- National rank
- #8512
- State rank
- #361 of 620 in IL
Livability — Wenona
- Score
- 61/100
- State rank
- #906
- US rank
- #17593
Category grades
Schools grade is shown separately in the Schools card above.
Census & demographics
- Census place
- Wenona, IL
- Population (ZIP)
- 1,458
Population outlook (Marshall County) Hauer SSP2
- Today (2025)
- 10,717 people
- By 2030
- 9,992 · -6.8%
- By 2040
- 8,554 · -20.2%
- By 2050
- 7,236 · -32.5%
- By 2075
- 4,958 · -53.7%
- By 2100
- 3,326 · -69.0%
Race, ethnicity, and origin ACS 2023
- Neighborhood character
- Predominantly White (93%)
- Race & ethnicity
- White 93% Two or more races 4% Hispanic / Latino 3%
- Common ancestry
- Italian 2% Polish 2% Lithuanian 1%
- Foreign-born
- 3% · Canada
- Languages at home
- 98% English-only · Spanish 2%
Political lean MEDSL · Marshall
- 2024 margin
- Solid R (+36.0) · D 31.2% · R 67.2% · Other 1.6%
- 2008→2024 swing
- -35.0pp toward R · 2008: -1.0pp · 2024: -36.0pp
- All cycles
- 2024: R+36.0 2020: R+34.5 2016: R+33.8 2012: R+14.3 2008: R+1.0
Not yet ingested
- Civics
- —
Market trends
- HPI YoY
- ▲ 1.08%
- Current HPI
- 170.4349
- Rent YoY
- —
- Metro
- —
- State GDP YoY
- ▲ 1.59%
- F500 in state
- 60
Industry mix (Fortune 500 HQ in IL)
| Industry | F500 HQs | Revenue |
|---|---|---|
| Insurance | 4 | $201B |
|
||
| Consumer Goods | 4 | $87B |
|
||
| Industrial Machinery | 3 | $64B |
|
||
| Healthcare | 2 | $55B |
|
||
| Retail / Pharmacy | 1 | $148B |
|
||
| Agriculture / Food | 1 | $86B |
|
||
Price history
+264.2% since first listed6 events — show timeline
- 2026-06-16 Price Changed $112,900 MRED as Distributed by MLS Grid
- 2026-05-16 Listed $119,900 MRED as Distributed by MLS Grid
- 2022-04-06 Sold (Public Records) $45,000 Public Records
- 2022-04-06 Sold (MLS) $45,000 RMLSA as Distributed by MLS Grid
- 2022-03-19 Listed $49,900 RMLSA as Distributed by MLS Grid
- 2012-10-24 Sold (Public Records) $31,000 Public Records
Property tax history
-15.0%/yrLatest (2025): $169 · -85.7% YoY. Source: county tax records.
Cash-flow waterfall
monthlySold comps — $/sqft
last 12 mo · ≤1 miLoading sold comps…