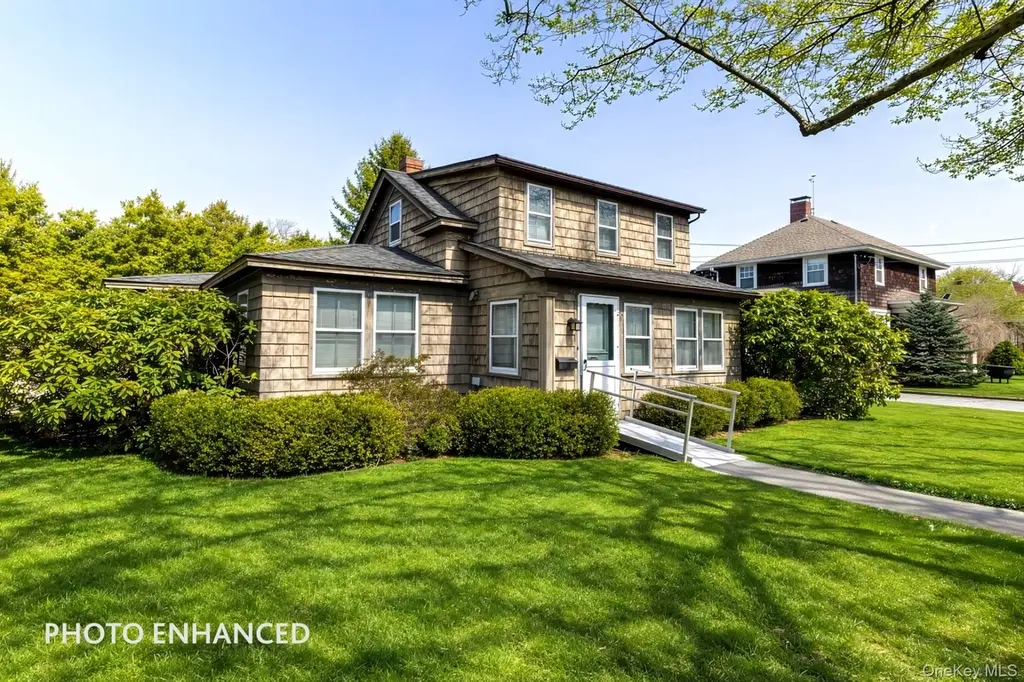
23 John St · Southampton, NY
Flood risk 1/10 · Minimal
- FEMA flood zone
- X (unshaded)
- Chance of flooding over 30 yrs
- 0.0%
- Est. flood insurance / yr
- $507 – $1,088
Fire risk 1/10 · Minimal
- Est. fire insurance / yr
- $691 – $1,283
Heat risk 5/10 · Moderate
- Hot days now (above 90°F)
- 7 days/yr
- Hot days in 30 yrs
- 20 days/yr
Wind risk 8/10 · Major
- Chance of severe wind over 30 yrs
- 80.0%
Air-quality risk 3/10 · Minor
- Unhealthy air days now
- 3 days/yr
- Unhealthy air days in 30 yrs
- 4 days/yr
Risk factors via First Street. Map © Google.
Why this score? — see what drove the B grade
The composite is a weighted blend of 9 inputs, each scored 0–100. Each bar is that input's sub-score; the figure is the points it added to the 100-point composite (weight × sub-score).
- Cash flow +27.1/30.0
- ARV discount +12.8/15.0
- DSCR +9.4/10.0
- 1% rule +7.3/10.0
- Rent growth +5.0/5.0
- Schools +4.8/10.0
- Livability +3.5/5.0
- Condition / age +2.5/5.0
- Appreciation +0.0/10.0
$1,750,000
🖨 Deal sheet 📄 Offer letter ✓ Due diligence
Listing remarks MLS
ON ONE OF THE BEST BLOCKS IN SOUTHAMPTON VILLAGE In the heart of peaceful Southampton Village, this enviably located property places the best of the Village just moments away with boutiques, shops, cafés, and everyday essentials. Set on a flat, cleared 54x90 parcel, the cedar shake-sided 2-level home has 1,284 +/- SF of living space with 3 bedrooms and 1 bath, plus there's an auxiliary structure at the rear of the property. A rare chance to be close to it all in Southampton Village, where charm, convenience, and a quiet neighborhood atmosphere come together seamlessly.
Key facts
- Auxiliary structure
- Flat cleared parcel
- 4,792 sq ft lot
Tags
Neighborhood map
What this means for you Summary
Snapshot
- This is a 4-bed/1.0-bath single-family listed at $1.75M.
Deal economics
- At list price, monthly cash flow is $5k ($59k/yr) — positive.
- The deal already cash-flows at list — no discount required.
- Meets the 1% rule at list price ($22k rent vs $1.75M).
- Recommended offer: $1.65M (6.0% below list) — sets the bar for market timing.
- Cap rate 9.7% vs local median 2.8% in Southampton — top-decile yield for the area; either an underpriced asset or a hidden risk that comps aren't pricing in. Stress-test before assuming the spread holds.
Location & tenants
- Location reads 69/100 on livability (#472 in NY) — a middle-class / working-renter tenant base. Strengths: crime A+, employment A+; Watch: commute D+, amenities F, cost of living F.
- Southampton Union Free School District (suburban): math 53% / reading 51% proficiency, ranked #293 of 590 in NY (top 50%) — acceptable for families but not a draw, mixed tenant base, ~2y average lease.
- Market conditions: Rents rising fast (+14.6%/yr); 95 active listings in the ZIP; 3 comparable units currently listed for rent nearby; rentals lingering (median 44d on market — plan ~5-8 weeks vacancy on turnover, expect pricing pressure); 100% of comp listings sitting > 30 days — soft ceiling on asking rent; high-income renter base; 1,366 units permitted in Suffolk County in 2024 (216 in 5+ unit buildings).
- At $21,568/mo this rent would consume 166% of the median local household income ($156k/yr) (locally 274% of renters already pay >50% of income on rent) — very limited rent-growth headroom before tenants either downsize or default.
Forward outlook
- Local home prices are declining (-3.0%/yr); year-one equity from $12k of loan paydown is wiped out by about $52k of value loss. Plan a longer hold.
- Suffolk County population projected to shrink 5% by 2050 — rents likely to lag national; underwrite the cash flow, not the appreciation.
- At projected returns (-3.0% appreciation + 8.0% rent growth), your $490k cash investment doubles in ~7 years — after that, you're playing with house money.
Negotiation context
- It's been on market 69 days — a 6% lower offer ($1.65M) is reasonable based on typical stale-listing flexibility.
- Current owner paid $105k; list at $1.75M implies a 1567% gain — meaningful room to come down on a strong offer.
Risks & watch-outs
- Climate carrying-cost: severe wind risk, 80% chance of damaging wind over 30y; extreme-heat days projected 7→20/yr by 2055 (HVAC capex compounding) — expect insurance premiums to compound above CPI over the hold.
Questions for the listing agent
- It's been on market 69 days. Have you received any prior offers? Is the seller open to a 6% concession, seller financing, or rate buy-down credit?
- Why hasn't it sold? Are there any deal-killer items the seller is aware of (foundation, flood, title, zoning, code violations)?
- Is there a deadline driving the sale (1031 exchange, divorce, estate, relocation)? That informs how much negotiation room exists.
- What's the average days-on-market for RENTAL listings here right now (not sales)? A rising rental-DOM trend means longer vacancies and softer asking-rent achievability than the comps imply.
- What's the recent tenant-quality profile in this submarket — average credit score on applications, eviction rate, late-payment / NSF rate, and stable-employment percentage? A property-management company in the area should have these aggregated.
- How much new for-sale + rental construction is in the pipeline within 1–3 miles? Heavy new supply typically softens prices + rents 12–24 months out; constrained supply supports both.
Investment metrics
- 1% rule
- 1.23% ✓
- Cap rate
- 9.68%
- Cash-on-cash
- 12.11%
- DSCR
- 1.54
- GRM
- 6.8
CMA / ARV
- ARV (median comp)
- $1,985,912
- List price
- $1,750,000
- Delta
- -11.88%
- Verdict
- UNDERPRICED
- Comps
- 6 within 1.0 mi
Show comp detail 1 sale within ~0.75 mi
| Address | Dist | Beds/Ba | Sqft | Sold | Price | $/sf | Match |
|---|---|---|---|---|---|---|---|
| 33 Halsey Ave | 0.15mi | 3/2.5 (-1) | 1,470 (+14%) | 4mo | $2,400,000 | $1,633 | 55 |
Match score weights: distance 35% · size 25% · config 20% · recency 20%. Top-matched comps best support the ARV.
Projected returns pro-forma
-3.0% appreciation · 8.0% rent growth · sell at horizon
- IRR
- 7.2%
- Equity multiple
- 1.30×
- Total profit
- $145,646
- Equity at exit
- $260,931
- IRR
- 20.5%
- Equity multiple
- 3.15×
- Total profit
- $1,052,421
- Equity at exit
- $151,308
Cash invested: $490,000 (down + closing). Projections, not guarantees.
Landlord ↔ Tenant lean methodology
- Overall (STATE)
- 15 Strongly Tenant-Friendly
- State New York
- 15 Strongly Tenant-Friendly · D+10
- County
- — inherits STATE
- City
- — inherits STATE
ZIP-level market 11968
- Home prices YoY
- -28.6%
- Rents YoY
- 14.6%
- Active inventory
- 95
- Price-to-rent
- 6.8×
Monthly cashflow live
- Estimated rent
- $21,568 medium interval (Pro) →
- Mortgage (P&I)
- −$9,177
- Tax est. 1.5%
- −$2,188 /mo · $26,250/yr
- Insurance
- −$729
- HOA
- −$0
- Vacancy / Maint / Mgmt
- −$4,529
- Net cashflow
- $4,944
Break-even live
UW: 25.0% down · 7.5% · 30yr · 1.5% tax · 5.0% vac · 8.0% maint · 8.0% mgmt
Financing live
Cash to close
- Down payment
- $437,500
- Closing costs
- $52,500
- Reserves months
- —
- Total cash needed
- —
Loan-product check · same deal, 3 products live
Conventional
25% down · 7.5% · 30yr
- Down + closing
- —
- Monthly P&I
- —
- Monthly cashflow
- —
- DSCR
- —
- Eligible?
- —
Personal DTI + credit; lowest rate.
DSCR
20% down · 8.5% · 30yr
- Down + closing
- —
- Monthly P&I
- —
- Monthly cashflow
- —
- DSCR
- —
- Eligible?
- —
No personal income docs; deal must DSCR.
Hard money
10% down · 12.0% · 12mo
- Down + closing
- —
- Monthly P&I
- —
- Monthly cashflow
- —
- DSCR
- —
- Eligible?
- —
Short-term bridge; refi at stabilization.
Rent comps 3 comps
| Address | Beds | Baths | Sqft | Rent | $/sqft | DOM | Units | Dist |
|---|---|---|---|---|---|---|---|---|
| 10 Leland Ln #19 Southampton, NY | 3.0 | 3.0 | 1400 | $30,000 | $21.43 | 43d | 1 | 0.44mi |
| 3 Meadowgrass Ln Southampton, NY | 3.0 | 2.0 | 1434 | $84,000 | $58.58 | 43d | 1 | 0.66mi |
| 393 Hill St Southampton, NY | 3.0 | 2.0 | 1345 | $35,000 | $26.02 | 43d | 1 | 1.17mi |
Listing history 16 events
-
2026-06-18days on market $1,750,000 Active 69 DOM
-
2026-06-17days on market $1,750,000 Active 68 DOM
-
2026-06-16days on market $1,750,000 Active 67 DOM
-
2026-06-15days on market $1,750,000 Active 66 DOM
-
2026-06-13days on market $1,750,000 Active 64 DOM
-
2026-06-13days on market $1,750,000 Active 63 DOM
-
2026-06-09days on market $1,750,000 Active 60 DOM
-
2026-06-08days on market $1,750,000 Active 59 DOM
-
2026-06-07days on market $1,750,000 Active 58 DOM
-
2026-06-04days on market $1,750,000 Active 55 DOM
-
2026-06-03days on market $1,750,000 Active 54 DOM
-
2026-06-02days on market $1,750,000 Active 53 DOM
-
2026-06-01days on market $1,750,000 Active 52 DOM
-
2026-05-31pricedays on market $1,750,000 Active 51 DOM
-
2026-04-10$1,895,000 Active 582-char remark
Show marketing remark (582 chars)
ON ONE OF THE BEST BLOCKS IN SOUTHAMPTON VILLAGE In the heart of peaceful Southampton Village, this enviably located property places the best of the Village just moments away with boutiques, shops, cafés, and everyday essentials. Set on a flat, cleared 54x90 parcel, the cedar shake-sided 2-level home has 1,284 +/- SF of living space with 3 bedrooms and 1 bath, plus there's an auxiliary structure at the rear of the property. A rare chance to be close to it all in Southampton Village, where charm, convenience, and a quiet neighborhood atmosphere come together seamlessly.
-
1986-11-19soldstatus $105,000
ⓘ Source: listings_history table (triggers on properties + properties_extension) + one-shot
backfill from property_details.listing_events for pre-trigger history.
Climate risk First Street
- Flood 1/10 Low FEMA zone X (unshaded) · 0% chance over 30 yrs
- Wildfire 1/10 Low
- Heat 5/10 Major 7 d/yr ≥90°F today · 20 d/yr by 30 yrs out
- Wind 8/10 Severe 80% chance of damaging wind over 30 yrs
- Air quality 3/10 Moderate 3 unhealthy d/yr today · 4 by 30 yrs out
Nearby sold comps map
Loading sold comps map…
Walkable amenities ~0.75 mi
Loading nearby amenities…
Taxation est. · year 1
- Rental income
- $258,810
- − Mortgage interest
- −$98,027
- − Property taxes
- −$26,250
- − Insurance
- −$8,750
- − Repairs & maintenance
- −$20,705
- − Management
- −$20,705
- − Depreciation
- −$50,909
- Taxable income
- $33,464
- Est. tax owed @ 24.0%
- −$8,031
- After-tax cash flow
- $51,302/yr
For passive investors: Depreciation is non-cash, so a rental often shows a tax loss while cash-flowing — sheltering income. Rental losses are passive: they offset passive income freely, and up to $25,000/yr can offset ordinary (W-2) income if you actively participate and your MAGI is under $100k (phasing out to $0 by $150k); unused losses carry forward. On sale, claimed depreciation is recaptured at up to 25%, and gains may owe capital-gains tax (a 1031 exchange can defer both). Figures are a year-1 estimate at your 24.0% rate — not tax advice; consult a CPA.
Schools (NCES district)
- District
- Southampton Union Free School District
- NCES district ID
- 3627540
- Math proficiency
- 53% ▬ 0.00%
- Reading proficiency
- 51% ▲ 4.00%
- Median HH income
- $85,977
- Composite
- 47.9/100
- National rank
- #2213
- State rank
- #293 of 590 in NY
Livability — Southampton
- Score
- 69/100
- State rank
- #472
- US rank
- #8333
Category grades
Schools grade is shown separately in the Schools card above.
Census & demographics
- Census place
- Southampton, NY
- County
- Suffolk County · 679,920 people
- City population
- 15,312
- Metro
- New York-Newark-Jersey City, NY-NJ-PA
- Population (ZIP)
- 15,312
- Household income
- $156,219
- Rent vs Own
- Severe rent burden
- 274.0
Population outlook (Suffolk County) Hauer SSP2
- Today (2025)
- 1,505,262 people
- By 2030
- 1,498,318 · -0.5%
- By 2040
- 1,471,101 · -2.3%
- By 2050
- 1,424,848 · -5.3%
- By 2075
- 1,337,157 · -11.2%
- By 2100
- 1,217,720 · -19.1%
Race, ethnicity, and origin ACS 2023
- Neighborhood character
- Predominantly White (71%)
- Race & ethnicity
- White 71% Hispanic / Latino 13% Two or more races 10% Black 9% Asian 3% Native American 2%
- Hispanic origin (detail)
- Mexican 3% Puerto Rican 2%
- Common ancestry
- Romanian 5% Scotch-Irish 2% Danish 2%
- Foreign-born
- 15% · Canada, Jamaica, Vietnam
- Languages at home
- 81% English-only · Spanish 11% Other Indo-European 3% German/W. Germanic 2%
Political lean MEDSL · Suffolk
- 2024 margin
- Lean R (+10.0) · D 45.0% · R 55.0%
- 2008→2024 swing
- -16.0pp toward R · 2008: 6.0pp · 2024: -10.0pp
- All cycles
- 2024: R+10.0 2020: R+0.0 2016: R+8.2 2012: D+2.9 2008: D+6.0
Not yet ingested
- Civics
- —
Market trends
- HPI YoY
- ▼ -184.86%
- Current HPI
- 461.1144
- Rent YoY
- ▲ 14.62%
- Metro
- New York-Newark-Jersey City, NY-NJ-PA
- State GDP YoY
- ▲ 2.60%
- F500 in state
- 92
Industry mix (Fortune 500 HQ in NY)
| Industry | F500 HQs | Revenue |
|---|---|---|
| Financial Services | 10 | $950B |
|
||
| Consumer Goods | 9 | $162B |
|
||
| Insurance | 4 | $225B |
|
||
| Telecommunications | 2 | $144B |
|
||
| Pharmaceuticals | 2 | $112B |
|
||
| Media / Entertainment | 2 | $69B |
|
||
Price history
+1704.8% since first listed2 events — show timeline
- 2026-04-10 Listed $1,895,000 OneKey® MLS as Distributed by MLS Grid
- 1986-11-19 Sold (Public Records) $105,000 Public Records
Property tax history
-4.5%/yrLatest (2023): $866 · -75.6% YoY. Source: county tax records.
Cash-flow waterfall
monthlySold comps — $/sqft
last 12 mo · ≤1 miLoading sold comps…