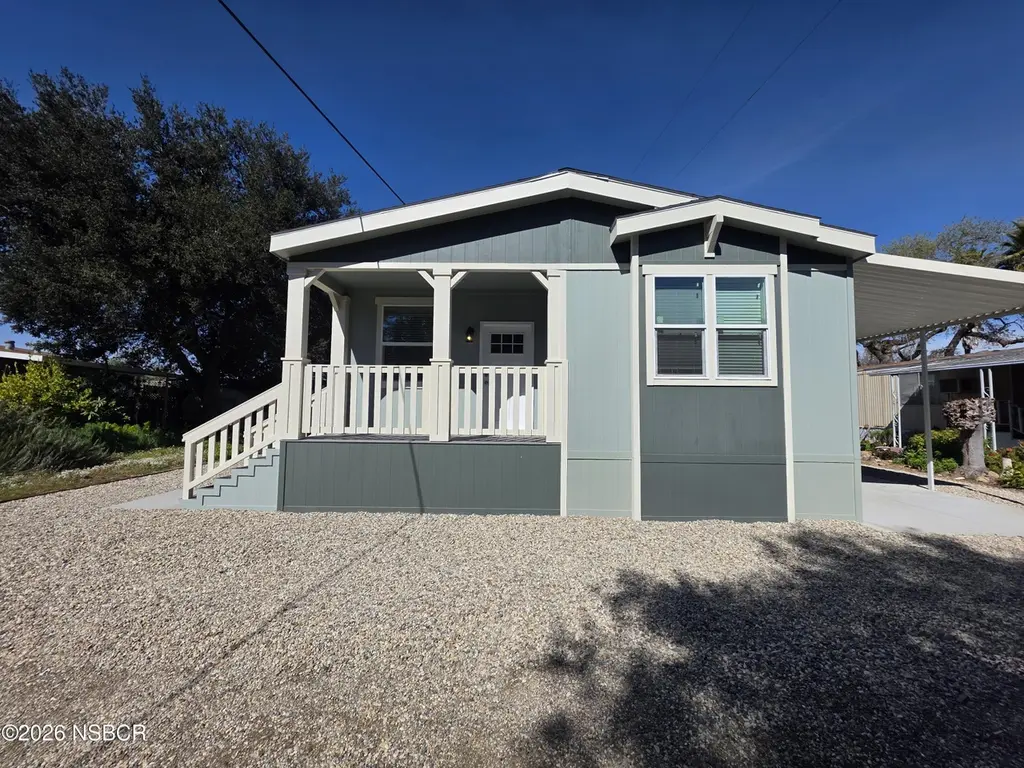
2056 Ca-154 #6 · Ballard, CA
Flood risk 1/10 · Minimal
- FEMA flood zone
- X (unshaded)
- Chance of flooding over 30 yrs
- 0.0%
- Est. flood insurance / yr
- $507 – $1,088
Fire risk 7/10 · Major
- Est. fire insurance / yr
- $659 – $1,223
Heat risk 4/10 · Minor
- Hot days now (above 93°F)
- 7 days/yr
- Hot days in 30 yrs
- 18 days/yr
Wind risk 1/10 · Minimal
- Chance of severe wind over 30 yrs
- —
Air-quality risk 6/10 · Moderate
- Unhealthy air days now
- 8 days/yr
- Unhealthy air days in 30 yrs
- 8 days/yr
Risk factors via First Street. Map © Google.
Why this score? — see what drove the C grade
The composite is a weighted blend of 9 inputs, each scored 0–100. Each bar is that input's sub-score; the figure is the points it added to the 100-point composite (weight × sub-score).
- Cash flow +24.5/30.0
- DSCR +7.9/10.0
- ARV discount +7.5/15.0
- 1% rule +6.3/10.0
- Schools +5.4/10.0
- Livability +2.6/5.0
- Rent growth +2.5/5.0
- Condition / age +2.5/5.0
- Appreciation +0.0/10.0
$489,000
🖨 Deal sheet 📄 Offer letter ✓ Due diligence
Listing remarks
Welcome to this beautiful 2024 new manufactured home in the desirable Rancho Oneonta Mobile Home Park, set in a quiet country setting near vineyards. This spacious home features 3 bedrooms and 2 bathrooms with an open-concept layout connecting the living, dining, and kitchen areas. The modern kitchen includes sleek appliances and ample storage, while generously sized bedrooms and updated bathrooms provide comfort and functionality. Enjoy outdoor living with a private patio and covered porch, plus a covered carport with a storage shed. Rancho Oneonta offers a well-maintained community and exceptionally low space rent, making this an outstanding and affordable opportunity in a sought-after lo
Key facts
- Covered porch
- Covered carport
- Private patio
Tags
Property features AI
Exterior
- Utilities: Has heating (forced air); Land lease: $407
- Home design: Manufactured home; Model: Victory; Make: Skyline; New (year built listed as New); Single-story (all main rooms listed on first level)
- Construction: 27 feet by 60 feet (mobile dimensions)
- Exterior features: Composition/shingle roof; Pillar/post/pier foundation
Interior
- Kitchen: Gas range/oven; Dishwasher; Garbage disposal; Refrigerator
- Bedrooms: Primary bedroom (first level); Bedroom 2 (first level); Bedroom 3 (first level)
- Flooring: Laminate flooring
- Bathrooms: 2 full bathrooms
- Heating & cooling: Forced air heating
- Interior features: Five total rooms; Energy Star appliance(s)
- Laundry & utility: Gas hookup for laundry
Neighborhood map
What this means for you Summary
Snapshot
- This is a 3-bed/2.0-bath manufactured listed at $489k.
Deal economics
- At list price, monthly cash flow is $1k ($12k/yr) — positive.
- The deal already cash-flows at list — no discount required.
- Meets the 1% rule at list price ($6k rent vs $489k).
- Recommended offer: $460k (6.0% below list) — sets the bar for market timing.
Location & tenants
- Location reads 52/100 on livability (#1,005 in CA) — a working-class tenant base; expect higher turnover. Strengths: employment A+, crime A-; Watch: housing C-, schools F, amenities F.
- College Elementary (town): math 50% / reading 65% proficiency, ranked #234 of 1,400 in CA (top 17%) — acceptable for families but not a draw, mixed tenant base, ~2y average lease.
- Market conditions: 56 active listings in the ZIP; 719 units permitted in Santa Barbara County in 2024 (217 in 5+ unit buildings).
Forward outlook
- Local home prices are declining (-3.0%/yr); year-one equity from $3k of loan paydown is wiped out by about $15k of value loss. Plan a longer hold.
- Santa Barbara County population projected at +20% by 2050 — long-run rental-demand tailwind backs the buy-and-hold thesis.
Negotiation context
- It's been on market 71 days — a 6% lower offer ($460k) is reasonable based on typical stale-listing flexibility.
Risks & watch-outs
- Climate carrying-cost: major wildfire risk — expect insurance premiums to compound above CPI over the hold.
Questions for the listing agent
- It's been on market 71 days. Have you received any prior offers? Is the seller open to a 6% concession, seller financing, or rate buy-down credit?
- Why hasn't it sold? Are there any deal-killer items the seller is aware of (foundation, flood, title, zoning, code violations)?
- Is there a deadline driving the sale (1031 exchange, divorce, estate, relocation)? That informs how much negotiation room exists.
- Schools are F-rated, which usually means shorter tenancies and higher turnover. Who's the typical renter profile here, and what's been the actual vacancy rate?
- What's the average days-on-market for RENTAL listings here right now (not sales)? A rising rental-DOM trend means longer vacancies and softer asking-rent achievability than the comps imply.
- What's the recent tenant-quality profile in this submarket — average credit score on applications, eviction rate, late-payment / NSF rate, and stable-employment percentage? A property-management company in the area should have these aggregated.
- How much new for-sale + rental construction is in the pipeline within 1–3 miles? Heavy new supply typically softens prices + rents 12–24 months out; constrained supply supports both.
Investment metrics
- 1% rule
- 1.13% ✓
- Cap rate
- 8.76%
- Cash-on-cash
- 8.81%
- DSCR
- 1.39
- GRM
- 7.3
CMA / ARV
- ARV (on-the-fly)
- $286,740
- Comps found
- 1
Show comp detail 1 sale within ~0.75 mi
| Address | Dist | Beds/Ba | Sqft | Sold | Price | $/sf | Match |
|---|---|---|---|---|---|---|---|
| 2056 W Highway 154 #10 | 0.00mi | 2/2.0 (-1) | 1,440 (-11%) | 9mo | $255,000 | $177 | 69 |
Match score weights: distance 35% · size 25% · config 20% · recency 20%. Top-matched comps best support the ARV.
Projected returns pro-forma
-3.0% appreciation · 3.0% rent growth · sell at horizon
- IRR
- -2.9%
- Equity multiple
- 0.89×
- Total profit
- $-15,154
- Equity at exit
- $72,911
- IRR
- 6.8%
- Equity multiple
- 1.51×
- Total profit
- $69,557
- Equity at exit
- $42,280
Cash invested: $136,920 (down + closing). Projections, not guarantees.
Landlord ↔ Tenant lean methodology
- Overall (STATE)
- 18 Strongly Tenant-Friendly
- State California
- 18 Strongly Tenant-Friendly · D+13
- County
- — inherits STATE
- City
- — inherits STATE
ZIP-level market 93460
- Active inventory
- 56
- Price-to-rent
- 7.3×
Monthly cashflow live
- Estimated rent
- $5,550 medium interval (Pro) →
- Mortgage (P&I)
- −$2,564
- Tax est. 1.5%
- −$611 /mo · $7,335/yr
- Insurance
- −$204
- HOA
- −$0
- Vacancy / Maint / Mgmt
- −$1,165
- Net cashflow
- $1,005
Break-even live
UW: 25.0% down · 7.5% · 30yr · 1.5% tax · 5.0% vac · 8.0% maint · 8.0% mgmt
Financing live
Cash to close
- Down payment
- $122,250
- Closing costs
- $14,670
- Reserves months
- —
- Total cash needed
- —
Loan-product check · same deal, 3 products live
Conventional
25% down · 7.5% · 30yr
- Down + closing
- —
- Monthly P&I
- —
- Monthly cashflow
- —
- DSCR
- —
- Eligible?
- —
Personal DTI + credit; lowest rate.
DSCR
20% down · 8.5% · 30yr
- Down + closing
- —
- Monthly P&I
- —
- Monthly cashflow
- —
- DSCR
- —
- Eligible?
- —
No personal income docs; deal must DSCR.
Hard money
10% down · 12.0% · 12mo
- Down + closing
- —
- Monthly P&I
- —
- Monthly cashflow
- —
- DSCR
- —
- Eligible?
- —
Short-term bridge; refi at stabilization.
Listing history 16 events
-
2026-06-18days on market $489,000 Active 71 DOM
-
2026-06-17days on market $489,000 Active 70 DOM
-
2026-06-16days on market $489,000 Active 69 DOM
-
2026-06-15days on market $489,000 Active 68 DOM
-
2026-06-14days on market $489,000 Active 66 DOM
-
2026-06-13days on market $489,000 Active 65 DOM
-
2026-06-10days on market $489,000 Active 63 DOM
-
2026-06-09days on market $489,000 Active 62 DOM
-
2026-06-08days on market $489,000 Active 61 DOM
-
2026-06-07days on market $489,000 Active 60 DOM
-
2026-06-03days on market $489,000 Active 56 DOM
-
2026-06-02days on market $489,000 Active 55 DOM
-
2026-06-01days on market $489,000 Active 54 DOM
-
2026-05-31days on market $489,000 Active 53 DOM
-
2026-05-30days on market $489,000 Active 52 DOM
-
2026-04-03$489,000 Active
ⓘ Source: listings_history table (triggers on properties + properties_extension) + one-shot
backfill from property_details.listing_events for pre-trigger history.
Climate risk First Street
- Flood 1/10 Low FEMA zone X (unshaded) · 0% chance over 30 yrs
- Wildfire 7/10 Severe
- Heat 4/10 Moderate 7 d/yr ≥93°F today · 18 d/yr by 30 yrs out
- Wind 1/10 Low
- Air quality 6/10 Major 8 unhealthy d/yr today · 8 by 30 yrs out
Nearby sold comps map
Loading sold comps map…
Walkable amenities ~0.75 mi
Loading nearby amenities…
Taxation est. · year 1
- Rental income
- $66,596
- − Mortgage interest
- −$27,392
- − Property taxes
- −$7,335
- − Insurance
- −$2,445
- − Repairs & maintenance
- −$5,328
- − Management
- −$5,328
- − Depreciation
- −$14,225
- Taxable income
- $4,544
- Est. tax owed @ 24.0%
- −$1,091
- After-tax cash flow
- $10,968/yr
For passive investors: Depreciation is non-cash, so a rental often shows a tax loss while cash-flowing — sheltering income. Rental losses are passive: they offset passive income freely, and up to $25,000/yr can offset ordinary (W-2) income if you actively participate and your MAGI is under $100k (phasing out to $0 by $150k); unused losses carry forward. On sale, claimed depreciation is recaptured at up to 25%, and gains may owe capital-gains tax (a 1031 exchange can defer both). Figures are a year-1 estimate at your 24.0% rate — not tax advice; consult a CPA.
Schools (NCES district)
- District
- College Elementary
- NCES district ID
- 0609330
- Math proficiency
- 50% ▬ 0.00%
- Reading proficiency
- 65% ▲ 5.00%
- Median HH income
- $88,496
- Composite
- 54.36/100
- National rank
- #2919
- State rank
- #234 of 1400 in CA
Livability — Ballard
- Score
- 52/100
- State rank
- #1005
- US rank
- #24868
Category grades
Schools grade is shown separately in the Schools card above.
Census & demographics
- Population (ZIP)
- 6,425
Population outlook (Santa Barbara County) Hauer SSP2
- Today (2025)
- 484,679 people
- By 2030
- 505,323 · +4.3%
- By 2040
- 545,783 · +12.6%
- By 2050
- 584,263 · +20.5%
- By 2075
- 682,586 · +40.8%
- By 2100
- 723,188 · +49.2%
Race, ethnicity, and origin ACS 2023
- Neighborhood character
- Predominantly White (70%)
- Race & ethnicity
- White 70% Hispanic / Latino 22% Two or more races 12% Native American 2%
- Hispanic origin (detail)
- Mexican 18%
- Common ancestry
- Portuguese 4% Lithuanian 3% Romanian 2%
- Foreign-born
- 16% · Canada
- Languages at home
- 81% English-only · Spanish 14% Tagalog/Filipino 2% German/W. Germanic 1%
Political lean MEDSL · Santa Barbara
- 2024 margin
- Strong D (+26.7) · D 61.8% · R 35.1% · Other 3.1%
- 2008→2024 swing
- +3.8pp toward D · 2008: 22.9pp · 2024: 26.7pp
- All cycles
- 2024: D+26.7 2020: D+32.1 2016: D+28.2 2012: D+17.1 2008: D+22.9
Not yet ingested
- Civics
- —
Market trends
- HPI YoY
- ▼ -250.90%
- Current HPI
- 322.2953
- Rent YoY
- —
- Metro
- —
- State GDP YoY
- ▲ 3.21%
- F500 in state
- 116
Industry mix (Fortune 500 HQ in CA)
| Industry | F500 HQs | Revenue |
|---|---|---|
| Technology | 27 | $1,492B |
|
||
| Financial Services | 3 | $174B |
|
||
| Retail | 3 | $44B |
|
||
| Insurance | 3 | $26B |
|
||
| Media / Entertainment | 2 | $115B |
|
||
| Pharmaceuticals / Biotech | 2 | $62B |
|
||
Price history
1 event — show timeline
- 2026-04-03 Listed $489,000 NSBCRMLS
Cash-flow waterfall
monthlySold comps — $/sqft
last 12 mo · ≤1 miLoading sold comps…