20415 Ruby Industrial Rd · Carlos, MD
Flood risk No data
- FEMA flood zone
- —
- Chance of flooding over 30 yrs
- —
- Est. flood insurance / yr
- —
Fire risk No data
- Est. fire insurance / yr
- —
Heat risk No data
- Hot days now (above threshold)
- —
- Hot days in 30 yrs
- —
Wind risk No data
- Chance of severe wind over 30 yrs
- —
Air-quality risk No data
- Unhealthy air days now
- —
- Unhealthy air days in 30 yrs
- —
Risk factors via First Street. Map © Google.
Why this score? — see what drove the B grade
The composite is a weighted blend of 9 inputs, each scored 0–100. Each bar is that input's sub-score; the figure is the points it added to the 100-point composite (weight × sub-score).
- Cash flow +26.8/30.0
- ARV discount +15.0/15.0
- DSCR +9.2/10.0
- 1% rule +7.2/10.0
- Appreciation +5.0/10.0
- Livability +3.1/5.0
- Rent growth +2.5/5.0
- Condition / age +2.5/5.0
- Schools +1.9/10.0
$89,000
🖨 Deal sheet (PDF) 📄 Offer letter ✓ Due diligence
Listing remarks
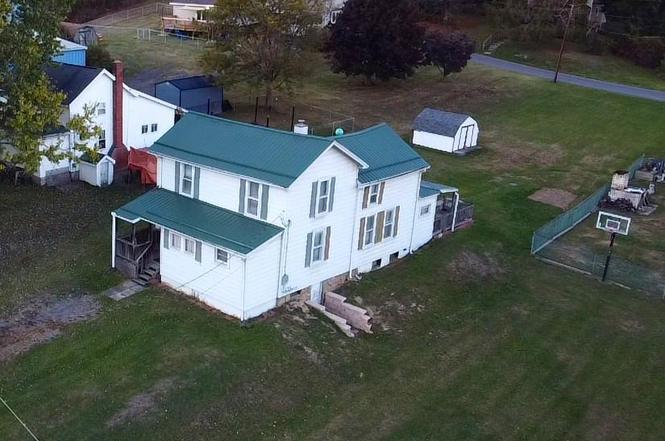
Discover the potential of this spacious farmhouse nestled in the quiet community of Carlos just minutes away from Frostburg State University and downtown Frostburg. This home offers two inviting living rooms, a large kitchen perfect for family gatherings, a full bathroom and a convenient mud room/entry way on the main level. Upstairs you will find 2-3 generous sized bedrooms, providing flexible space for your needs. There is a full basement for extra storage. Enjoy the evenings on the rear deck overlooking a large yard ideal for gardening, entertaining, or simply relaxing. This home is ready for your personal upgrades and modern touches to make it truly your own. Did I mention it comes full
Key facts
- Convenient mud room
- Spacious farmhouse
- Full bathroom
Tags
Neighborhood map
What this means for you Summary
Snapshot
- This is a 2-bed/1.0-bath single-family listed at $89k.
Deal economics
- At list price, monthly cash flow is $242 ($3k/yr) — positive.
- The deal already cash-flows at list — no discount required.
- Meets the 1% rule at list price ($1k rent vs $89k).
- Recommended offer: $78k (12.0% below list) — sets the bar for market timing.
Location & tenants
- Location reads 61/100 on livability (#340 in MD) — a middle-class / working-renter tenant base. Strengths: cost of living A+, housing B; Watch: crime F, amenities F, commute F.
- Allegany County Public Schools (other): math 15% / reading 30% proficiency, ranked #18 of 24 in MD (top 75%) — low school quality limits family demand, transient renter base, plan for 1-2y turnover.
- Zoned schools: Frost Elementary (math 37% / reading 32%, grade F, #146 of 860 statewide, top 18%, 236 students, 43% FRL); Mount Savage Middle (math 15% / reading 38%, grade F, #86 of 225 statewide, top 40%, 425 students, 54% FRL); Mountain Ridge High School (math 32% / reading 72%, grade D+, #100 of 222 statewide, top 47%, 736 students, 48% FRL) — zoned schools at 48% FRL track the district average.
- Zoned-school proficiency averages 38% at this address vs 22% district-wide (+15 pts) — the actual schools serving this property are materially stronger than the Allegany County Public Schools average implies; a family-tenant draw the district grade alone would hide.
- Market conditions: 1 active listings in the ZIP; 24 units permitted in Allegany County in 2024 (0 in 5+ unit buildings).
Forward outlook
- In year one you build about $3k of equity ($615 loan paydown + $3k appreciation (3.0% local appreciation)).
- Allegany County population projected at -14% by 2050 — secular population decline; favor cash flow + early exit over multi-decade hold.
- At projected returns (3.0% appreciation + 3.0% rent growth), your $25k cash investment doubles in ~4 years — after that, you're playing with house money.
- By year 10, paydown + projected appreciation supports a ~$32k cash-out refi (75% LTV) — recoverable capital for the next deal without selling this one.
Negotiation context
- It's been on market 190 days — a 12% lower offer ($78k) is reasonable based on typical stale-listing flexibility.
- 3 sale attempts; this cycle's ask has dropped $26k (23%) from the opening price — seller is motivated, your offer sets the floor, not the list.
Risks & watch-outs
- Watch-outs: built in 1910 — expect roof / HVAC / electrical / plumbing capex.
Questions for the listing agent
- It's been on market 190 days. Have you received any prior offers? Is the seller open to a 12% concession, seller financing, or rate buy-down credit?
- Built in 1910 — when were the roof, HVAC, electrical panel, plumbing, and water heater last replaced?
- Why hasn't it sold? Are there any deal-killer items the seller is aware of (foundation, flood, title, zoning, code violations)?
- Is there a deadline driving the sale (1031 exchange, divorce, estate, relocation)? That informs how much negotiation room exists.
- Crime grade is F in this area — have there been break-ins, vandalism, or insurance claims at this property in the last 3 years? What carrier currently insures it and at what premium?
- What's the average days-on-market for RENTAL listings here right now (not sales)? A rising rental-DOM trend means longer vacancies and softer asking-rent achievability than the comps imply.
- What's the recent tenant-quality profile in this submarket — average credit score on applications, eviction rate, late-payment / NSF rate, and stable-employment percentage? A property-management company in the area should have these aggregated.
- How much new for-sale + rental construction is in the pipeline within 1–3 miles? Heavy new supply typically softens prices + rents 12–24 months out; constrained supply supports both.
Investment metrics
- 1% rule
- 1.22% ✓
- Cap rate
- 9.56%
- Cash-on-cash
- 11.67%
- DSCR
- 1.52
- GRM
- 6.8
CMA / ARV
- ARV (on-the-fly)
- $109,020
- Comps found
- 1
Show comp detail 1 sale within ~0.75 mi
| Address | Dist | Beds/Ba | Sqft | Sold | Price | $/sf | Match |
|---|---|---|---|---|---|---|---|
| 20403 Morgan St SW | 0.14mi | 3/1.0 (+1) | 1,814 (+15%) | 11mo | $125,000 | $69 | 55 |
Match score weights: distance 35% · size 25% · config 20% · recency 20%. Top-matched comps best support the ARV.
Projected returns pro-forma
3.0% appreciation · 3.0% rent growth · sell at horizon
- IRR
- 18.4%
- Equity multiple
- 2.05×
- Total profit
- $26,178
- Equity at exit
- $40,018
- IRR
- 19.8%
- Equity multiple
- 3.87×
- Total profit
- $71,589
- Equity at exit
- $61,673
Cash invested: $24,920 (down + closing). Projections, not guarantees.
Landlord ↔ Tenant lean methodology
- Overall (STATE)
- 27 Tenant-Leaning
- State Maryland
- 27 Tenant-Leaning · D+14
- County
- — inherits STATE
- City
- — inherits STATE
ZIP-level market 21543
- Active inventory
- 1
- Price-to-rent
- 6.8×
Monthly cashflow live
- Estimated rent
- $1,085 medium interval (Pro) →
- Mortgage (P&I)
- −$467
- Tax est. 1.5%
- −$111 /mo · $1,335/yr
- Insurance
- −$37
- HOA
- −$0
- Vacancy / Maint / Mgmt
- −$228
- Net cashflow
- $242
Break-even live
Sensitivity live
| Price | -10% $304 | -5% $273 | +0% $242 | +5% $212 | +10% $181 |
|---|---|---|---|---|---|
| Rent | -10% $157 | -5% $200 | +0% $242 | +5% $285 | +10% $328 |
| Rate | -1.0pp $287 | -0.5pp $265 | base $242 | +0.5pp $219 | +1.0pp $196 |
UW: 25.0% down · 7.5% · 30yr · 1.5% tax · 5.0% vac · 8.0% maint · 8.0% mgmt
Financing live
Cash to close
- Down payment
- $22,250
- Closing costs
- $2,670
- Reserves months
- —
- Total cash needed
- —
Loan-product check · same deal, 3 products live
Conventional
25% down · 7.5% · 30yr
- Down + closing
- —
- Monthly P&I
- —
- Monthly cashflow
- —
- DSCR
- —
- Eligible?
- —
Personal DTI + credit; lowest rate.
DSCR
20% down · 8.5% · 30yr
- Down + closing
- —
- Monthly P&I
- —
- Monthly cashflow
- —
- DSCR
- —
- Eligible?
- —
No personal income docs; deal must DSCR.
Hard money
10% down · 12.0% · 12mo
- Down + closing
- —
- Monthly P&I
- —
- Monthly cashflow
- —
- DSCR
- —
- Eligible?
- —
Short-term bridge; refi at stabilization.
Listing history 11 events
-
2026-04-28status Pending
-
2026-04-17price $89,000
-
2026-04-11status Active
-
2026-04-10historical
-
2026-04-04price $95,000
-
2026-02-28price $98,000
-
2025-12-18status Active
-
2025-12-10historical Active Under Contract
-
2025-12-03price $99,000
-
2025-10-29price $111,000
-
2025-10-10$115,000 Active
ⓘ Source: listings_history table (triggers on properties + properties_extension) + one-shot
backfill from property_details.listing_events for pre-trigger history.
Nearby sold comps map
Loading sold comps map…
Walkable amenities ~0.75 mi
Loading nearby amenities…
Taxation est. · year 1
- Rental income
- $13,025
- − Mortgage interest
- −$4,985
- − Property taxes
- −$1,335
- − Insurance
- −$445
- − Repairs & maintenance
- −$1,042
- − Management
- −$1,042
- − Depreciation
- −$2,589
- Taxable income
- $1,587
- Est. tax owed @ 24.0%
- −$381
- After-tax cash flow
- $2,528/yr
For passive investors: Depreciation is non-cash, so a rental often shows a tax loss while cash-flowing — sheltering income. Rental losses are passive: they offset passive income freely, and up to $25,000/yr can offset ordinary (W-2) income if you actively participate and your MAGI is under $100k (phasing out to $0 by $150k); unused losses carry forward. On sale, claimed depreciation is recaptured at up to 25%, and gains may owe capital-gains tax (a 1031 exchange can defer both). Figures are a year-1 estimate at your 24.0% rate — not tax advice; consult a CPA.
Schools (NCES district)
- District
- Allegany County Public Schools
- NCES district ID
- 2400030
- Math proficiency
- 15% ▼ -26.00%
- Reading proficiency
- 30% ▼ -20.00%
- Median HH income
- $39,760
- Composite
- 18.95/100
- National rank
- #8854
- State rank
- #18 of 24 in MD
Livability — Carlos
- Score
- 61/100
- State rank
- #340
- US rank
- #18356
Category grades
Schools grade is shown separately in the Schools card above.
Census & demographics
- Census place
- Carlos, MD
- Population (ZIP)
- 325
Population outlook (Allegany County) Hauer SSP2
- Today (2025)
- 68,778 people
- By 2030
- 66,766 · -2.9%
- By 2040
- 62,784 · -8.7%
- By 2050
- 59,179 · -14.0%
- By 2075
- 50,732 · -26.2%
- By 2100
- 40,837 · -40.6%
Race, ethnicity, and origin ACS 2023
- Neighborhood character
- Predominantly White (98%)
- Race & ethnicity
- White 98% Black 2%
- Common ancestry
- Polish 18% Iranian 17% Slovak 12%
- Foreign-born
- 1%
Political lean MEDSL · Allegany
- 2024 margin
- Solid R (+40.3) · D 28.9% · R 69.2% · Other 2.0%
- 2008→2024 swing
- -14.4pp toward R · 2008: -25.9pp · 2024: -40.3pp
- All cycles
- 2024: R+40.3 2020: R+38.3 2016: R+48.0 2012: R+32.9 2008: R+25.9
Not yet ingested
- Civics
- —
Market trends
- HPI YoY
- —
- Current HPI
- —
- Rent YoY
- —
- Metro
- —
- State GDP YoY
- ▲ 2.97%
- F500 in state
- 12
Industry mix (Fortune 500 HQ in MD)
| Industry | F500 HQs | Revenue |
|---|---|---|
| Aerospace / Defense | 1 | $71B |
|
||
| Utilities | 1 | $25B |
|
||
| Hotels | 1 | $24B |
|
||
| Consumer Goods | 1 | $7B |
|
||
| Real Estate | 1 | $6B |
|
||
| Chemicals | 1 | $2B |
|
||
Price history
-22.6% since first listed11 events — show timeline
- 2026-04-28 Pending — BRIGHT MLS
- 2026-04-17 Price Changed $89,000 BRIGHT MLS
- 2026-04-11 Relisted — BRIGHT MLS
- 2026-04-10 Listing Removed — BRIGHT MLS
- 2026-04-04 Price Changed $95,000 BRIGHT MLS
- 2026-02-28 Price Changed $98,000 BRIGHT MLS
- 2025-12-18 Relisted — BRIGHT MLS
- 2025-12-10 Contingent — BRIGHT MLS
- 2025-12-03 Price Changed $99,000 BRIGHT MLS
- 2025-10-29 Price Changed $111,000 BRIGHT MLS
- 2025-10-10 Listed $115,000 BRIGHT MLS
Cash-flow waterfall
monthlySold comps — $/sqft
last 12 mo · ≤1 miLoading sold comps…