1749 S Valley Vw · Ridgecrest, CA
Flood risk 1/10 · Minimal
- FEMA flood zone
- X (unshaded)
- Chance of flooding over 30 yrs
- 0.0%
- Est. flood insurance / yr
- $507 – $1,088
Fire risk 4/10 · Minor
- Est. fire insurance / yr
- $659 – $1,223
Heat risk 8/10 · Major
- Hot days now (above 103°F)
- 9 days/yr
- Hot days in 30 yrs
- 25 days/yr
Wind risk 1/10 · Minimal
- Chance of severe wind over 30 yrs
- —
Air-quality risk 7/10 · Major
- Unhealthy air days now
- 14 days/yr
- Unhealthy air days in 30 yrs
- 15 days/yr
Risk factors via First Street. Map © Google.
Why this score? — see what drove the D- grade
The composite is a weighted blend of 9 inputs, each scored 0–100. Each bar is that input's sub-score; the figure is the points it added to the 100-point composite (weight × sub-score).
- ARV discount +14.7/15.0
- Cash flow +8.3/30.0
- Livability +3.5/5.0
- Rent growth +3.4/5.0
- Schools +2.9/10.0
- Condition / age +2.5/5.0
- 1% rule +2.3/10.0
- DSCR +2.3/10.0
- Appreciation +0.0/10.0
$259,000
🖨 Deal sheet (PDF) 📄 Offer letter ✓ Due diligence
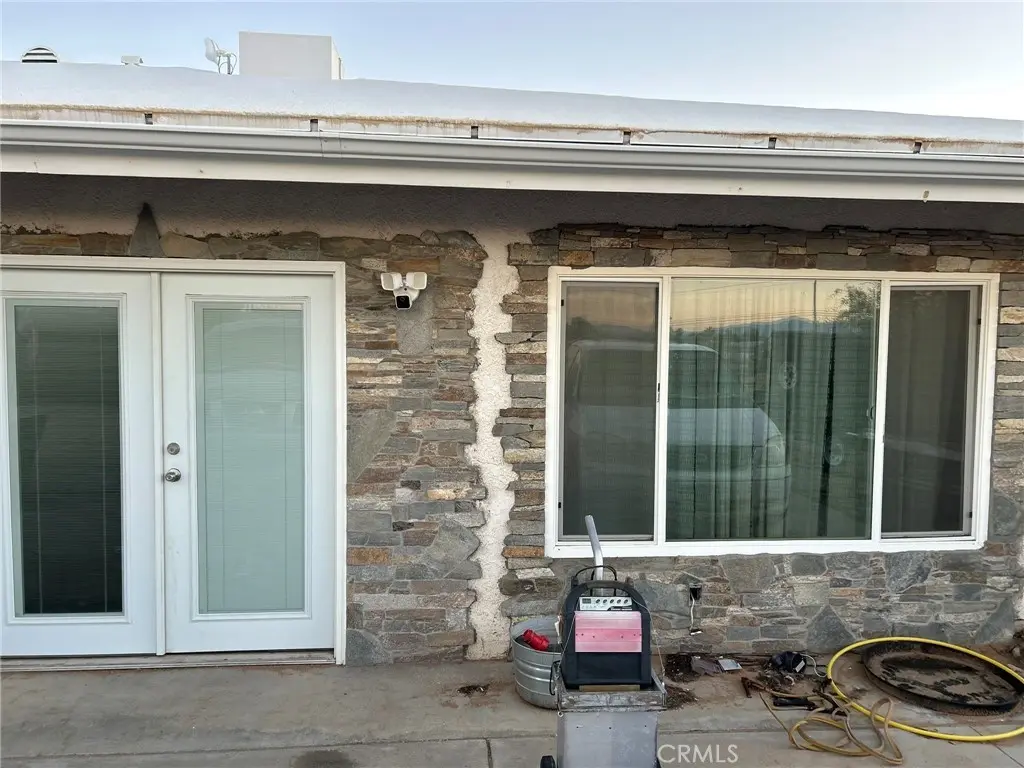
Listing remarks MLS
Investor opportunity in Ridgecrest! Seller finance available! This single-family home sits on 1-acre lot (approx. ), The perfect fix-and-flip or value-add project for cash or hard-money buyers. Property needs repairs and updating, offering strong upside for the right investor. Great potential, spacious layout, and ample room for expansion, storage, or RV parking. Sold as-is with no repairs or credits. Buyer to verify all information, permits, and property features.
Key facts
- 1 acre lot
- Built 1979
- Listed 189 days
Neighborhood map
What this means for you Summary
Snapshot
- This is a 3-bed/2.0-bath single-family listed at $259k.
Deal economics
- At list price, monthly cash flow is $-237 ($-3k/yr) — negative.
- To cash-flow at today's rent, offer at most $217k (16.1% below list).
- To meet the 1% rule (rent ≥ 1% of price), the offer needs to be $190k (26.8% below list).
- Recommended offer: $190k (26.8% below list) — sets the bar for 1% rule.
- Cap rate 5.2% vs local median 4.0% in Ridgecrest — meaningfully above typical; check what's discounted (condition, days-on-market, listing class) to confirm the premium yield is real.
Location & tenants
- Location reads 70/100 on livability (#243 in CA) — a middle-class / working-renter tenant base. Strengths: commute A+, housing A+; Watch: amenities D+, cost of living D+, crime F.
- Sierra Sands Unified (town): math 25% / reading 39% proficiency, ranked #294 of 517 in CA (top 57%) — families likely to look elsewhere, expect single-tenant / working-renter base with shorter leases.
- Zoned schools: Faller Elementary (math 21% / reading 37%, grade F, #891 of 1,571 statewide, top 57%, 538 students, 48% FRL); Murray Middle (math 26% / reading 41%, grade F, #197 of 498 statewide, top 40%, 690 students, 46% FRL); Burroughs High (math 37% / reading 70%, grade C-, #281 of 1,170 statewide, top 24%, 1,479 students, 40% FRL) — zoned schools at 45% FRL track the district average.
- Market conditions: Rents rising (+3.6%/yr); 332 active listings in the ZIP; 4 comparable units currently listed for rent nearby; rentals lingering (median 46d on market — plan ~5-8 weeks vacancy on turnover, expect pricing pressure); 75% of comp listings sitting > 30 days — soft ceiling on asking rent; solid renter incomes; 3,244 units permitted in Kern County in 2024 (73 in 5+ unit buildings).
Forward outlook
- Local home prices are declining (-3.0%/yr); year-one equity from $2k of loan paydown is wiped out by about $8k of value loss. Plan a longer hold.
- Kern County population projected at +17% by 2050 — long-run rental-demand tailwind backs the buy-and-hold thesis.
Negotiation context
- It's been on market 189 days — a 12% lower offer ($228k) is reasonable based on typical stale-listing flexibility.
Risks & watch-outs
- Climate carrying-cost: extreme-heat days projected 9→25/yr by 2055 (HVAC capex compounding) — expect insurance premiums to compound above CPI over the hold.
Questions for the listing agent
- What do current leases actually rent for vs. the listed asking? Can we see a recent rent roll and the last 12 months of T-12 income?
- It's been on market 189 days. Have you received any prior offers? Is the seller open to a 27% concession, seller financing, or rate buy-down credit?
- Built in 1979 — when were the roof, HVAC, electrical panel, plumbing, and water heater last replaced?
- Why hasn't it sold? Are there any deal-killer items the seller is aware of (foundation, flood, title, zoning, code violations)?
- Is there a deadline driving the sale (1031 exchange, divorce, estate, relocation)? That informs how much negotiation room exists.
- Crime grade is F in this area — have there been break-ins, vandalism, or insurance claims at this property in the last 3 years? What carrier currently insures it and at what premium?
- The area grade is low — what's the realistic commute time and amenity access for the typical tenant pool here? Any planned neighborhood developments (good or bad) we should know about?
- What's the average days-on-market for RENTAL listings here right now (not sales)? A rising rental-DOM trend means longer vacancies and softer asking-rent achievability than the comps imply.
- What's the recent tenant-quality profile in this submarket — average credit score on applications, eviction rate, late-payment / NSF rate, and stable-employment percentage? A property-management company in the area should have these aggregated.
- How much new for-sale + rental construction is in the pipeline within 1–3 miles? Heavy new supply typically softens prices + rents 12–24 months out; constrained supply supports both.
Investment metrics
- 1% rule
- 0.73% ✗
- Cap rate
- 5.20%
- Cash-on-cash
- -3.91%
- DSCR
- 0.83
- GRM
- 11.4
CMA / ARV
- ARV (median comp)
- $308,147
- List price
- $259,000
- Delta
- -15.95%
- Verdict
- UNDERPRICED
- Comps
- 20 within 1.0 mi
Show comp detail 12 sales within ~0.75 mi
| Address | Dist | Beds/Ba | Sqft | Sold | Price | $/sf | Match |
|---|---|---|---|---|---|---|---|
| 1751 S Mahan St | 0.43mi | 4/2.0 (+1) | 2,101 (-1%) | 5mo | $549,900 | $262 | 69 |
| 908 Oregon | 0.32mi | 4/2.0 (+1) | 1,882 (-11%) | 4mo | $345,000 | $183 | 58 |
| 1524 Mayo St | 0.39mi | 3/2.5 | 1,934 (-9%) | 13mo | $335,000 | $173 | 55 |
| 1633 Mayo St | 0.34mi | 4/2.0 (+1) | 1,878 (-11%) | 7mo | $341,000 | $182 | 55 |
| 919 W Burns Ave | 0.46mi | 4/2.0 (+1) | 1,859 (-12%) | 2mo | $324,000 | $174 | 51 |
| 1528 S Mayo St | 0.39mi | 4/2.0 (+1) | 1,858 (-12%) | 8mo | $355,000 | $191 | 50 |
| 915 W Coral Ave | 0.72mi | 3/2.0 | 1,932 (-9%) | 4mo | $242,000 | $125 | 48 |
| 1406 Porter St | 0.55mi | 4/2.0 (+1) | 1,882 (-11%) | 4mo | $340,000 | $181 | 47 |
| 1301 S Mccall St | 0.61mi | 4/3.0 (+1) | 1,881 (-11%) | 2mo | $330,000 | $175 | 42 |
| 1305 Sims St | 0.63mi | 4/2.0 (+1) | 1,847 (-13%) | 3mo | $320,000 | $173 | 42 |
| 1446 W Franklin Ave Unit B | 0.71mi | 3/2.0 | 1,896 (-10%) | 14mo | $299,000 | $158 | 38 |
| 1237 S Farragut St | 0.66mi | 4/2.0 (+1) | 1,934 (-9%) | 16mo | $365,000 | $189 | 37 |
Match score weights: distance 35% · size 25% · config 20% · recency 20%. Top-matched comps best support the ARV.
Projected returns pro-forma
-3.0% appreciation · 3.58% rent growth · sell at horizon
- IRR
- -22.3%
- Equity multiple
- 0.23×
- Total profit
- $-55,928
- Equity at exit
- $38,618
- IRR
- -15.0%
- Equity multiple
- 0.12×
- Total profit
- $-63,500
- Equity at exit
- $22,394
Cash invested: $72,520 (down + closing). Projections, not guarantees.
Landlord ↔ Tenant lean methodology
- Overall (STATE)
- 18 Strongly Tenant-Friendly
- State California
- 18 Strongly Tenant-Friendly · D+13
- County
- — inherits STATE
- City
- — inherits STATE
ZIP-level market 93555
- Home prices YoY
- -24.0%
- Rents YoY
- 3.6%
- Active inventory
- 332
- Price-to-rent
- 11.4×
Monthly cashflow live
- Estimated rent
- $1,897 medium interval (Pro) →
- Mortgage (P&I)
- −$1,358
- Tax from tax record
- −$269 /mo · $3,226/yr
- Insurance
- −$108
- HOA
- −$0
- Vacancy / Maint / Mgmt
- −$398
- Net cashflow
- $-237
Break-even live
Sensitivity live
| Price | -10% $-90 | -5% $-163 | +0% $-237 | +5% $-310 | +10% $-383 |
|---|---|---|---|---|---|
| Rent | -10% $-386 | -5% $-311 | +0% $-237 | +5% $-162 | +10% $-87 |
| Rate | -1.0pp $-106 | -0.5pp $-171 | base $-237 | +0.5pp $-304 | +1.0pp $-372 |
UW: 25.0% down · 7.5% · 30yr · 1.5% tax · 5.0% vac · 8.0% maint · 8.0% mgmt
Financing live
Cash to close
- Down payment
- $64,750
- Closing costs
- $7,770
- Reserves months
- —
- Total cash needed
- —
Loan-product check · same deal, 3 products live
Conventional
25% down · 7.5% · 30yr
- Down + closing
- —
- Monthly P&I
- —
- Monthly cashflow
- —
- DSCR
- —
- Eligible?
- —
Personal DTI + credit; lowest rate.
DSCR
20% down · 8.5% · 30yr
- Down + closing
- —
- Monthly P&I
- —
- Monthly cashflow
- —
- DSCR
- —
- Eligible?
- —
No personal income docs; deal must DSCR.
Hard money
10% down · 12.0% · 12mo
- Down + closing
- —
- Monthly P&I
- —
- Monthly cashflow
- —
- DSCR
- —
- Eligible?
- —
Short-term bridge; refi at stabilization.
Rent comps 4 comps
| Address | Beds | Baths | Sqft | Rent | $/sqft | DOM | Units | Dist |
|---|---|---|---|---|---|---|---|---|
| 922 W Vulcan Ave Ridgecrest, CA | 3.0 | 2.0 | 1458 | $2,100 | $1.44 | 45d | 1 | 1.06mi |
| 804 S Nevada St Ridgecrest, CA | 4.0 | 2.0 | 1470 | $1,900 | $1.29 | 45d | 1 | 1.20mi |
| 1215 Beasley St Ridgecrest, CA | 4.0 | 2.0 | 1634 | $1,700 | $1.04 | 4d | 1 | 1.25mi |
| 936 W Boston Ave Ridgecrest, CA | 4.0 | 2.0 | 1835 | $2,100 | $1.14 | 46d | 1 | 1.34mi |
Listing history 19 events
-
2026-06-21days on market $259,000 Active 189 DOM
-
2026-06-18days on market $259,000 Active 186 DOM
-
2026-06-17days on market $259,000 Active 185 DOM
-
2026-06-16days on market $259,000 Active 184 DOM
-
2026-06-15days on market $259,000 Active 183 DOM
-
2026-06-14days on market $259,000 Active 181 DOM
-
2026-06-13days on market $259,000 Active 180 DOM
-
2026-06-10days on market $259,000 Active 178 DOM
-
2026-06-09days on market $259,000 Active 177 DOM
-
2026-06-08days on market $259,000 Active 176 DOM
-
2026-06-07days on market $259,000 Active 175 DOM
-
2026-06-05days on market $259,000 Active 172 DOM
-
2026-06-03days on market $259,000 Active 171 DOM
-
2026-06-03days on market $259,000 Active 170 DOM
-
2026-06-01days on market $259,000 Active 169 DOM
-
2026-05-31days on market $259,000 Active 168 DOM
-
2025-12-14$259,000 Active 469-char remark
Show marketing remark (469 chars)
Investor opportunity in Ridgecrest! Seller finance available! This single-family home sits on 1-acre lot (approx. ), The perfect fix-and-flip or value-add project for cash or hard-money buyers. Property needs repairs and updating, offering strong upside for the right investor. Great potential, spacious layout, and ample room for expansion, storage, or RV parking. Sold as-is with no repairs or credits. Buyer to verify all information, permits, and property features.
-
2015-10-27soldstatus $228,000
-
2010-06-24soldstatus $160,000
ⓘ Source: listings_history table (triggers on properties + properties_extension) + one-shot
backfill from property_details.listing_events for pre-trigger history.
Tax reassessment forecast CA · Resets to sale price
- Current annual tax
- $3,226 · $269/mo
- Projected year-2 tax
- $3,226 · $269/mo
- Expected delta
- $0/yr ($0/mo · 0.0%)
ⓘ Screening estimate from a state-policy table — verify with the county assessor before closing.
Climate risk First Street
- Flood 1/10 Low FEMA zone X (unshaded) · 0% chance over 30 yrs
- Wildfire 4/10 Moderate
- Heat 8/10 Severe 9 d/yr ≥103°F today · 25 d/yr by 30 yrs out
- Wind 1/10 Low
- Air quality 7/10 Severe 14 unhealthy d/yr today · 15 by 30 yrs out
Nearby sold comps map
Loading sold comps map…
Walkable amenities ~0.75 mi
Loading nearby amenities…
Taxation est. · year 1
- Rental income
- $22,761
- − Mortgage interest
- −$14,508
- − Property taxes
- −$3,226
- − Insurance
- −$1,295
- − Repairs & maintenance
- −$1,821
- − Management
- −$1,821
- − Depreciation
- −$7,535
- Taxable loss
- −$7,445
- Est. tax savings @ 24.0%
- +$1,787
- After-tax cash flow
- $-1,052/yr
For passive investors: Depreciation is non-cash, so a rental often shows a tax loss while cash-flowing — sheltering income. Rental losses are passive: they offset passive income freely, and up to $25,000/yr can offset ordinary (W-2) income if you actively participate and your MAGI is under $100k (phasing out to $0 by $150k); unused losses carry forward. On sale, claimed depreciation is recaptured at up to 25%, and gains may owe capital-gains tax (a 1031 exchange can defer both). Figures are a year-1 estimate at your 24.0% rate — not tax advice; consult a CPA.
Schools (NCES district)
- District
- Sierra Sands Unified
- NCES district ID
- 0636800
- Math proficiency
- 25% ▼ -11.00%
- Reading proficiency
- 39% ▼ -11.00%
- Median HH income
- $58,937
- Composite
- 28.66/100
- National rank
- #6699
- State rank
- #294 of 517 in CA
Livability — Ridgecrest
- Score
- 70/100
- State rank
- #243
- US rank
- #8014
Category grades
Schools grade is shown separately in the Schools card above.
Census & demographics
- County
- Kern County · 710,371 people
- City population
- 33,845
- Metro
- Bakersfield, CA
- Population (ZIP)
- 33,845
- Household income
- $86,700
- Rent vs Own
- Severe rent burden
- 975.0
Population outlook (Kern County) Hauer SSP2
- Today (2025)
- 947,286 people
- By 2030
- 978,984 · +3.3%
- By 2040
- 1,045,018 · +10.3%
- By 2050
- 1,105,232 · +16.7%
- By 2075
- 1,229,538 · +29.8%
- By 2100
- 1,238,059 · +30.7%
Race, ethnicity, and origin ACS 2023
- Neighborhood character
- Majority White (65%)
- Race & ethnicity
- White 65% Hispanic / Latino 20% Two or more races 12% Black 4% Asian 4% Native American 1%
- Hispanic origin (detail)
- Mexican 15%
- Common ancestry
- Italian 4% Lithuanian 2% Slovak 2%
- Foreign-born
- 7% · Canada
- Languages at home
- 84% English-only · Spanish 11% Other Indo-European 1% Other Asian/Pacific 1%
Political lean MEDSL · Kern
- 2024 margin
- Strong R (+21.1) · D 38.2% · R 59.3% · Other 2.5%
- 2008→2024 swing
- -3.3pp toward R · 2008: -17.8pp · 2024: -21.1pp
- All cycles
- 2024: R+21.1 2020: R+10.2 2016: R+15.0 2012: R+20.9 2008: R+17.8
Not yet ingested
- Civics
- —
Market trends
- HPI YoY
- ▼ -120.17%
- Current HPI
- 380.5208
- Rent YoY
- ▲ 3.58%
- Metro
- Bakersfield, CA
- State GDP YoY
- ▲ 3.21%
- F500 in state
- 116
Industry mix (Fortune 500 HQ in CA)
| Industry | F500 HQs | Revenue |
|---|---|---|
| Technology | 27 | $1,492B |
|
||
| Financial Services | 3 | $174B |
|
||
| Retail | 3 | $44B |
|
||
| Insurance | 3 | $26B |
|
||
| Media / Entertainment | 2 | $115B |
|
||
| Pharmaceuticals / Biotech | 2 | $62B |
|
||
Price history
+61.9% since first listed3 events — show timeline
- 2025-12-14 Listed $259,000 CRMLS
- 2015-10-27 Sold (Public Records) $228,000 Public Records
- 2010-06-24 Sold (Public Records) $160,000 Public Records
Property tax history
+5.4%/yrLatest (2025): $3,226 · +7.0% YoY. Source: county tax records.
Cash-flow waterfall
monthlySold comps — $/sqft
last 12 mo · ≤1 miLoading sold comps…