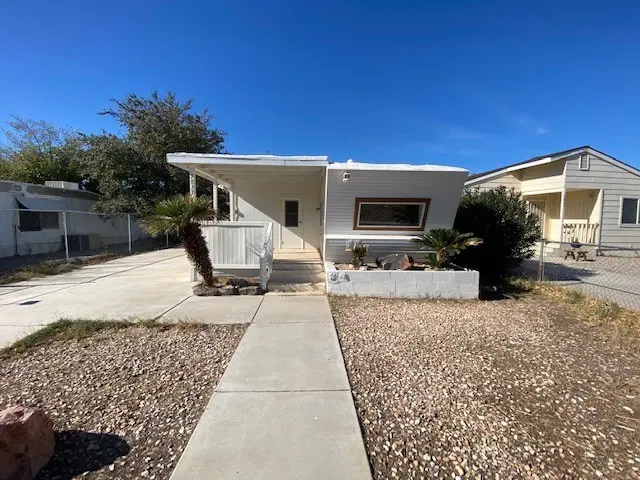
7837 S Mallard St · Willow Valley, AZ
Flood risk 1/10 · Minimal
- FEMA flood zone
- X (shaded)
- Chance of flooding over 30 yrs
- 0.0%
- Est. flood insurance / yr
- $507 – $1,088
Fire risk 4/10 · Minor
- Est. fire insurance / yr
- $610 – $1,132
Heat risk 9/10 · Severe
- Hot days now (above 117°F)
- 7 days/yr
- Hot days in 30 yrs
- 16 days/yr
Wind risk 1/10 · Minimal
- Chance of severe wind over 30 yrs
- —
Air-quality risk 1/10 · Minimal
- Unhealthy air days now
- 0 days/yr
- Unhealthy air days in 30 yrs
- 0 days/yr
Risk factors via First Street. Map © Google.
Why this score? — see what drove the C grade
The composite is a weighted blend of 9 inputs, each scored 0–100. Each bar is that input's sub-score; the figure is the points it added to the 100-point composite (weight × sub-score).
- Cash flow +20.3/30.0
- Appreciation +10.0/10.0
- ARV discount +7.5/15.0
- DSCR +6.4/10.0
- 1% rule +4.1/10.0
- Livability +3.0/5.0
- Rent growth +2.5/5.0
- Condition / age +2.5/5.0
- Schools +1.3/10.0
$139,000
🖨 Deal sheet (PDF) 📄 Offer letter ✓ Due diligence
Listing remarks
Located in the popular "Willow Valley Marina Club" and easy access for all your watercraft for the Colorado River! Here is your perfect starter home "At the River!" Old school mobile in great condition, has had a new roof installed 2025. Ready for you to use as full time residence, Seasonal or Full time Rental! Just in time for Summer! Huge lot with many parking options with concrete driveway equipped for MotorCoach, Travel trailers, Boats RV, etc. Bring the crowd, enjoy this "Tiny Home " setup with two bedrooms, 1 bath and" Efficiency Econo kitchen" Fenced yard, Porch Patio in front, all in a mature neighborhood where neighbors are neighborly! Member
Key facts
- Fenced yard
- Porch patio
- New roof installed
Tags
Property features AI
Exterior
- Utilities: Public water; Electricity available; Natural gas available
- Home design: Manufactured home (double wide); Residential property
- Construction: Membrane roof; Metal roof
- Exterior features: Chain link fencing; Has a view
Interior
- Kitchen: Disposal; Oven; Range; Solid surface counters
- Flooring: Carpet; Vinyl
- Bathrooms: 1 full bathroom
- Heating & cooling: Central air; Electric cooling; Ceiling fan(s)
- Interior features: Ceiling fans; Open floorplan; Vaulted ceilings; Unfurnished
Neighborhood map
What this means for you Summary
Snapshot
- This is a 2-bed/1.0-bath manufactured listed at $139k.
Deal economics
- At list price, monthly cash flow is $177 ($2k/yr) — positive.
- The deal already cash-flows at list — no discount required.
- To meet the 1% rule (rent ≥ 1% of price), the offer needs to be $127k (8.8% below list).
- Recommended offer: $127k (8.8% below list) — sets the bar for 1% rule.
Location & tenants
- Location reads 60/100 on livability (#170 in AZ) — a middle-class / working-renter tenant base. Strengths: cost of living A+, housing A-; Watch: health & safety C-, crime D, amenities F.
- Colorado River Union High School District (4381) (town): math 13% / reading 17% proficiency, ranked #213 of 249 in AZ (top 86%) — low school quality limits family demand, transient renter base, plan for 1-2y turnover.
- Zoned schools: Camp Mohave Elementary School (math 29% / reading 40%, grade F, #471 of 1,109 statewide, top 44%, 375 students, 66% FRL); Mohave Valley Junior High School (math 28% / reading 31%, grade F, #84 of 218 statewide, top 41%, 448 students, 55% FRL); River Valley High School (math 12% / reading 12%, grade F, #287 of 381 statewide, top 76%, 545 students, 50% FRL).
- Market conditions: 223 active listings in the ZIP; 2,543 units permitted in Mohave County in 2024 (33 in 5+ unit buildings).
Forward outlook
- In year one you build about $15k of equity ($961 loan paydown + $14k appreciation (10.0% local appreciation)).
- Mohave County population projected to shrink 6% by 2050 — rents likely to lag national; underwrite the cash flow, not the appreciation.
- At projected returns (10.0% appreciation + 3.0% rent growth), your $39k cash investment doubles in ~3 years — after that, you're playing with house money.
- By year 3, paydown + projected appreciation supports a ~$38k cash-out refi (75% LTV) — recoverable capital for the next deal without selling this one.
Negotiation context
- It's been on market 69 days — a 6% lower offer ($131k) is reasonable based on typical stale-listing flexibility.
- 8 sale attempts since 12y ago with the ask held roughly flat each time — persistent listings suggest the price (not the market) is what's stuck; bring a comps-based counter.
- Current owner paid $40k; list at $139k implies a 248% gain — meaningful room to come down on a strong offer.
Risks & watch-outs
- Climate carrying-cost: extreme-heat days projected 7→16/yr by 2055 (HVAC capex compounding) — expect insurance premiums to compound above CPI over the hold.
Questions for the listing agent
- It's been on market 69 days. Have you received any prior offers? Is the seller open to a 9% concession, seller financing, or rate buy-down credit?
- Built in 1961 — when were the roof, HVAC, electrical panel, plumbing, and water heater last replaced?
- Why hasn't it sold? Are there any deal-killer items the seller is aware of (foundation, flood, title, zoning, code violations)?
- Is there a deadline driving the sale (1031 exchange, divorce, estate, relocation)? That informs how much negotiation room exists.
- Schools are F-rated, which usually means shorter tenancies and higher turnover. Who's the typical renter profile here, and what's been the actual vacancy rate?
- Crime grade is D in this area — have there been break-ins, vandalism, or insurance claims at this property in the last 3 years? What carrier currently insures it and at what premium?
- What's the average days-on-market for RENTAL listings here right now (not sales)? A rising rental-DOM trend means longer vacancies and softer asking-rent achievability than the comps imply.
- What's the recent tenant-quality profile in this submarket — average credit score on applications, eviction rate, late-payment / NSF rate, and stable-employment percentage? A property-management company in the area should have these aggregated.
- How much new for-sale + rental construction is in the pipeline within 1–3 miles? Heavy new supply typically softens prices + rents 12–24 months out; constrained supply supports both.
Investment metrics
- 1% rule
- 0.91% ✗
- Cap rate
- 7.82%
- Cash-on-cash
- 5.46%
- DSCR
- 1.24
- GRM
- 9.1
CMA / ARV
- ARV (on-the-fly)
- $90,500
- Comps found
- 3
Show comp detail 3 sales within ~0.75 mi
| Address | Dist | Beds/Ba | Sqft | Sold | Price | $/sf | Match |
|---|---|---|---|---|---|---|---|
| 7858 S Canadian St | 0.13mi | 2/2.0 | 470 (-6%) | 15mo | $85,000 | $181 | 68 |
| 8011 S Smoketree Ln | 0.52mi | 2/2.0 | 450 (-10%) | 4mo | $70,000 | $156 | 51 |
| 593 E Clearview Dr | 0.29mi | 1/1.0 (-1) | 460 (-8%) | 21mo | $105,000 | $228 | 51 |
Match score weights: distance 35% · size 25% · config 20% · recency 20%. Top-matched comps best support the ARV.
Projected returns pro-forma
10.0% appreciation · 3.0% rent growth · sell at horizon
- IRR
- 28.2%
- Equity multiple
- 3.23×
- Total profit
- $86,907
- Equity at exit
- $125,222
- IRR
- 24.6%
- Equity multiple
- 7.34×
- Total profit
- $246,938
- Equity at exit
- $270,046
Cash invested: $38,920 (down + closing). Projections, not guarantees.
Landlord ↔ Tenant lean methodology
- Overall (STATE)
- 87 Strongly Landlord-Friendly
- State Arizona
- 87 Strongly Landlord-Friendly · R+3
- County
- — inherits STATE
- City
- — inherits STATE
ZIP-level market 86440
- Home prices YoY
- 4.2%
- Active inventory
- 223
- Price-to-rent
- 9.1×
Monthly cashflow live
- Estimated rent
- $1,268 medium interval (Pro) →
- Mortgage (P&I)
- −$729
- Tax from tax record
- −$38 /mo · $457/yr
- Insurance
- −$58
- HOA
- −$0
- Vacancy / Maint / Mgmt
- −$266
- Net cashflow
- $177
Break-even live
Sensitivity live
| Price | -10% $256 | -5% $216 | +0% $177 | +5% $138 | +10% $98 |
|---|---|---|---|---|---|
| Rent | -10% $77 | -5% $127 | +0% $177 | +5% $227 | +10% $277 |
| Rate | -1.0pp $247 | -0.5pp $212 | base $177 | +0.5pp $141 | +1.0pp $104 |
UW: 25.0% down · 7.5% · 30yr · 1.5% tax · 5.0% vac · 8.0% maint · 8.0% mgmt
Financing live
Cash to close
- Down payment
- $34,750
- Closing costs
- $4,170
- Reserves months
- —
- Total cash needed
- —
Loan-product check · same deal, 3 products live
Conventional
25% down · 7.5% · 30yr
- Down + closing
- —
- Monthly P&I
- —
- Monthly cashflow
- —
- DSCR
- —
- Eligible?
- —
Personal DTI + credit; lowest rate.
DSCR
20% down · 8.5% · 30yr
- Down + closing
- —
- Monthly P&I
- —
- Monthly cashflow
- —
- DSCR
- —
- Eligible?
- —
No personal income docs; deal must DSCR.
Hard money
10% down · 12.0% · 12mo
- Down + closing
- —
- Monthly P&I
- —
- Monthly cashflow
- —
- DSCR
- —
- Eligible?
- —
Short-term bridge; refi at stabilization.
Listing history 42 events
-
2026-06-22days on market $139,000 Active 69 DOM
-
2026-06-18days on market $139,000 Active 66 DOM
-
2026-06-17days on market $139,000 Active 65 DOM
-
2026-06-16days on market $139,000 Active 64 DOM
-
2026-06-15days on market $139,000 Active 63 DOM
-
2026-06-14days on market $139,000 Active 61 DOM
-
2026-06-13days on market $139,000 Active 60 DOM
-
2026-06-10days on market $139,000 Active 58 DOM
-
2026-06-09days on market $139,000 Active 57 DOM
-
2026-06-08days on market $139,000 Active 56 DOM
-
2026-06-07days on market $139,000 Active 55 DOM
-
2026-06-05days on market $139,000 Active 52 DOM
-
2026-06-03days on market $139,000 Active 51 DOM
-
2026-06-02days on market $139,000 Active 50 DOM
-
2026-06-01days on market $139,000 Active 49 DOM
-
2026-05-31days on market $139,000 Active 48 DOM
-
2026-05-30days on market $139,000 Active 47 DOM
-
2026-04-13$139,000 Active
-
2026-03-09historical $1,000
-
2026-02-27price $1,000
-
2025-12-22price $1,100
-
2025-11-14price $1,195
-
2025-10-09price $1,325
-
2025-09-05$1,380
-
2025-08-02price $118,000
-
2025-06-12price $123,000
-
2025-05-17price $129,990
-
2025-05-07price $165,000
-
2025-02-18price $178,900
-
2024-10-14price $179,000
-
2024-10-02historical $1,200
-
2024-09-27$199,900 Active
-
2024-08-26price $1,200
-
2024-08-13$1,300
-
2024-06-28historical $1,300
-
2024-04-12$1,300
-
2024-04-10historical $1,300
-
2024-04-02$1,300
-
2022-12-15historical
-
2021-05-29$124,900
-
2014-06-18$35,900
-
1994-04-15soldstatus $40,000
ⓘ Source: listings_history table (triggers on properties + properties_extension) + one-shot
backfill from property_details.listing_events for pre-trigger history.
Tax reassessment forecast AZ · Resets to sale price
- Current annual tax
- $457 · $38/mo
- Projected year-2 tax
- $917 · $76/mo
- Expected delta
- +$460/yr (+$38/mo · 100.7%)
ⓘ Screening estimate from a state-policy table — verify with the county assessor before closing.
Climate risk First Street
- Flood 1/10 Low FEMA zone X (shaded) · 0% chance over 30 yrs
- Wildfire 4/10 Moderate
- Heat 9/10 Extreme 7 d/yr ≥117°F today · 16 d/yr by 30 yrs out
- Wind 1/10 Low
- Air quality 1/10 Low 0 unhealthy d/yr today · 0 by 30 yrs out
Nearby sold comps map
Loading sold comps map…
Walkable amenities ~0.75 mi
Loading nearby amenities…
Taxation est. · year 1
- Rental income
- $15,218
- − Mortgage interest
- −$7,786
- − Property taxes
- −$457
- − Insurance
- −$695
- − Repairs & maintenance
- −$1,217
- − Management
- −$1,217
- − Depreciation
- −$4,044
- Taxable loss
- −$199
- Est. tax savings @ 24.0%
- +$48
- After-tax cash flow
- $2,171/yr
For passive investors: Depreciation is non-cash, so a rental often shows a tax loss while cash-flowing — sheltering income. Rental losses are passive: they offset passive income freely, and up to $25,000/yr can offset ordinary (W-2) income if you actively participate and your MAGI is under $100k (phasing out to $0 by $150k); unused losses carry forward. On sale, claimed depreciation is recaptured at up to 25%, and gains may owe capital-gains tax (a 1031 exchange can defer both). Figures are a year-1 estimate at your 24.0% rate — not tax advice; consult a CPA.
Schools (NCES district)
- District
- Colorado River Union High School District (4381)
- NCES district ID
- 0400082
- Math proficiency
- 13% ▼ -17.00%
- Reading proficiency
- 17% ▼ -18.00%
- Median HH income
- $39,132
- Composite
- 12.72/100
- National rank
- #9603
- State rank
- #213 of 249 in AZ
Livability — Willow Valley
- Score
- 60/100
- State rank
- #170
- US rank
- #18589
Category grades
Schools grade is shown separately in the Schools card above.
Census & demographics
- Census place
- Willow Valley, AZ
- Population (ZIP)
- 8,403
Population outlook (Mohave County) Hauer SSP2
- Today (2025)
- 209,184 people
- By 2030
- 209,674 · +0.2%
- By 2040
- 205,897 · -1.6%
- By 2050
- 196,810 · -5.9%
- By 2075
- 169,454 · -19.0%
- By 2100
- 136,630 · -34.7%
Race, ethnicity, and origin ACS 2023
- Neighborhood character
- Predominantly White (73%)
- Race & ethnicity
- White 73% Hispanic / Latino 20% Two or more races 11% Native American 4%
- Hispanic origin (detail)
- Mexican 11%
- Common ancestry
- Lithuanian 3% Iranian 2% Italian 2%
- Foreign-born
- 1% · Canada
- Languages at home
- 96% English-only · Spanish 3%
Political lean MEDSL · Mohave
- 2024 margin
- Solid R (+55.8) · D 21.8% · R 77.6%
- 2008→2024 swing
- -22.9pp toward R · 2008: -32.9pp · 2024: -55.8pp
- All cycles
- 2024: R+55.8 2020: R+51.3 2016: R+51.5 2012: R+42.6 2008: R+32.9
Not yet ingested
- Civics
- —
Market trends
- HPI YoY
- ▲ 13.05%
- Current HPI
- 322.7772
- Rent YoY
- —
- Metro
- —
- State GDP YoY
- ▲ 4.54%
- F500 in state
- 20
Industry mix (Fortune 500 HQ in AZ)
| Industry | F500 HQs | Revenue |
|---|---|---|
| Technology | 2 | $13B |
|
||
| Mining / Metals | 1 | $23B |
|
||
| Environmental Services | 1 | $16B |
|
||
| Metals / Steel | 1 | $14B |
|
||
| Technology Distribution | 1 | $9B |
|
||
| Homebuilding | 1 | $8B |
|
||
Price history
+247.5% since first listed25 events — show timeline
- 2026-04-13 Listed $139,000 WARDEX
- 2026-03-09 Rental Removed $1,000 APPFOLIO
- 2026-02-27 Price Changed $1,000 APPFOLIO
- 2025-12-22 Price Changed $1,100 APPFOLIO
- 2025-11-14 Price Changed $1,195 APPFOLIO
- 2025-10-09 Price Changed $1,325 APPFOLIO
- 2025-09-05 Listed for Rent $1,380 APPFOLIO
- 2025-08-02 Price Changed $118,000 WARDEX
- 2025-06-12 Price Changed $123,000 WARDEX
- 2025-05-17 Price Changed $129,990 WARDEX
- 2025-05-07 Price Changed $165,000 WARDEX
- 2025-02-18 Price Changed $178,900 WARDEX
- 2024-10-14 Price Changed $179,000 WARDEX
- 2024-10-02 Rental Removed $1,200 APPFOLIO
- 2024-09-27 Listed $199,900 WARDEX
- 2024-08-26 Price Changed $1,200 APPFOLIO
- 2024-08-13 Listed for Rent $1,300 APPFOLIO
- 2024-06-28 Rental Removed $1,300 APPFOLIO
- 2024-04-12 Listed for Rent $1,300 APPFOLIO
- 2024-04-10 Rental Removed $1,300 APPFOLIO
- 2024-04-02 Listed for Rent $1,300 APPFOLIO
- 2022-12-15 Rental Removed — APPFOLIO
- 2021-05-29 Listed $124,900 WARDEX
- 2014-06-18 Listed $35,900 WARDEX
- 1994-04-15 Sold (Public Records) $40,000 Public Records
Property tax history
+1.1%/yrLatest (2025): $457 · +13.5% YoY. Source: county tax records.
Cash-flow waterfall
monthlySold comps — $/sqft
last 12 mo · ≤1 miLoading sold comps…