31 Rio Grande Cir #11 · Florence, KY
Flood risk 1/10 · Minimal
- FEMA flood zone
- X (unshaded)
- Chance of flooding over 30 yrs
- 0.0%
- Est. flood insurance / yr
- $507 – $1,088
Fire risk 1/10 · Minimal
- Est. fire insurance / yr
- $839 – $1,559
Heat risk 4/10 · Minor
- Hot days now (above 102°F)
- 7 days/yr
- Hot days in 30 yrs
- 19 days/yr
Wind risk 2/10 · Minimal
- Chance of severe wind over 30 yrs
- 1.0%
Air-quality risk 2/10 · Minimal
- Unhealthy air days now
- 1 days/yr
- Unhealthy air days in 30 yrs
- 3 days/yr
Risk factors via First Street. Map © Google.
Why this score? — see what drove the D grade
The composite is a weighted blend of 9 inputs, each scored 0–100. Each bar is that input's sub-score; the figure is the points it added to the 100-point composite (weight × sub-score).
- Cash flow +11.1/30.0
- ARV discount +7.5/15.0
- 1% rule +4.8/10.0
- Schools +4.1/10.0
- Livability +3.9/5.0
- Rent growth +3.4/5.0
- DSCR +3.2/10.0
- Condition / age +2.5/5.0
- Appreciation +0.0/10.0
$173,000
🖨 Deal sheet 📄 Offer letter ✓ Due diligence
Listing remarks MLS
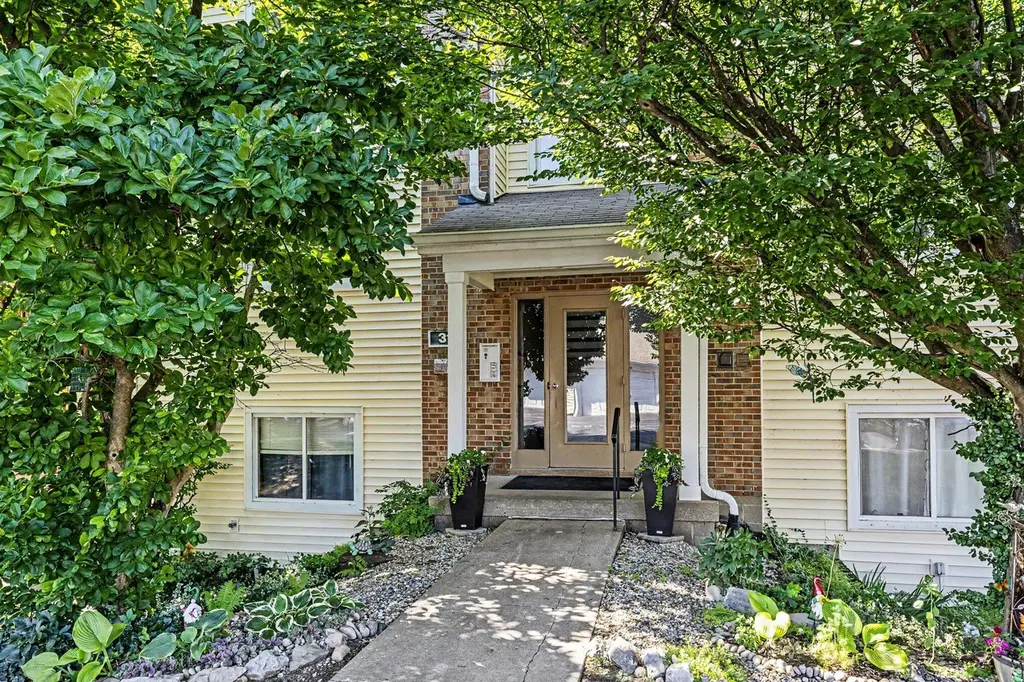
You must see this really nice open and spacious condo with cathedral ceilings, fresh paint, laminate floors, super nice layout with split bedroom design, 2 full baths, pretty kitchen with newer appliances, and white kitchen cabinets, washer & dryer stay! Nice deck, walk in closets, clubhouse, pool and tennis courts!
Key facts
- Covered deck
- Private bath
- Updated kitchen
Tags
Property features AI
Finance
- HOA & community: Monthly association fee (includes association fees, grounds maintenance, and management); Community amenities: parking, landscaping, pool, clubhouse
Exterior
- Parking: Assigned parking
- Utilities: Public water; Public sewer; Cable available
- Home design: Condominium; One level; Entry level: 3; Existing structure; Built in 1991
- Construction: Aluminum siding and brick exterior; Shingle roof; Poured concrete foundation
- Exterior features: Covered patio; Deck; Balcony; Storage structure
Interior
- Kitchen: Stainless steel appliances; Electric cooktop; Electric oven; Dishwasher; Disposal; Microwave; Refrigerator; Pantry
- Bedrooms: Primary bedroom (16 x 11); Bedroom 2 (11 x 11)
- Bathrooms: 2 full bathrooms
- Heating & cooling: Electric heating; Central air conditioning
- Interior features: Walk-in closets; Storage; Pantry; Open floor plan; High-speed internet available; Entrance foyer; Ceiling fans; Intercom; Vaulted ceilings; Wood-burning fireplace with ceramic surround
- Laundry & utility: Laundry on main level
Neighborhood map
What this means for you Summary
Snapshot
- This is a 2-bed/2.0-bath condo listed at $173k.
Deal economics
- At list price, monthly cash flow is $-69 ($-822/yr) — negative.
- To cash-flow at today's rent, offer at most $161k (7.0% below list).
- To meet the 1% rule (rent ≥ 1% of price), the offer needs to be $169k (2.3% below list).
- Recommended offer: $161k (7.0% below list) — sets the bar for cash-flow.
- Cap rate 5.8% vs local median 3.4% in Florence — top-decile yield for the area; either an underpriced asset or a hidden risk that comps aren't pricing in. Stress-test before assuming the spread holds.
Location & tenants
- Location reads 78/100 on livability (#82 in KY, #2,763 nationally) — a middle-class / working-renter tenant base. Strengths: commute A+, cost of living A+, housing A+; Watch: crime C-.
- Boone County (suburban): math 43% / reading 49% proficiency, ranked #12 of 165 in KY (top 7%) — families likely to look elsewhere, expect single-tenant / working-renter base with shorter leases.
- Zoned schools: Erpenbeck Elementary School (math 65% / reading 68%, grade B+, #17 of 676 statewide, top 2%, 702 students, 28% FRL); Ockerman Middle School (math 35% / reading 50%, grade D-, #47 of 217 statewide, top 22%, 653 students, 47% FRL); Randall K. Cooper High School (math 46% / reading 50%, grade D, #17 of 254 statewide, top 6%, 1,462 students, 30% FRL).
- Market conditions: Rents rising (+3.4%/yr); 265 active listings in the ZIP; 5 comparable units currently listed for rent nearby; rentals leasing fast (median 2d on market — plan ~1-2 weeks tenant-placement turnaround); solid renter incomes; 1,430 units permitted in Boone County in 2024 (928 in 5+ unit buildings).
Forward outlook
- Local home prices are declining (-3.0%/yr); year-one equity from $1k of loan paydown is wiped out by about $5k of value loss. Plan a longer hold.
- Boone County population projected at +24% by 2050 — long-run rental-demand tailwind backs the buy-and-hold thesis.
Negotiation context
- Only 14 days on market — expect competitive offers; lowballing is unlikely to land.
- 5 sale attempts since 32y ago with the ask held roughly flat each time — persistent listings suggest the price (not the market) is what's stuck; bring a comps-based counter.
- Current owner paid $90k; list at $173k implies a 92% gain — meaningful room to come down on a strong offer.
Questions for the listing agent
- What do current leases actually rent for vs. the listed asking? Can we see a recent rent roll and the last 12 months of T-12 income?
- What does the HOA fee cover, when was the last increase, and are there any pending special assessments or reserve-fund shortfalls?
- Any open or pending special assessments — roof, HVAC, plumbing, elevator, façade? What's the per-unit balance and payoff schedule, and is the seller paying it off at close or rolling it to the buyer?
- Is there a deadline driving the sale (1031 exchange, divorce, estate, relocation)? That informs how much negotiation room exists.
- Schools are D-rated, which usually means shorter tenancies and higher turnover. Who's the typical renter profile here, and what's been the actual vacancy rate?
- The area grade is low — what's the realistic commute time and amenity access for the typical tenant pool here? Any planned neighborhood developments (good or bad) we should know about?
- What's the average days-on-market for RENTAL listings here right now (not sales)? A rising rental-DOM trend means longer vacancies and softer asking-rent achievability than the comps imply.
- What's the recent tenant-quality profile in this submarket — average credit score on applications, eviction rate, late-payment / NSF rate, and stable-employment percentage? A property-management company in the area should have these aggregated.
- How much new apartment / multifamily construction is in the pipeline within 1–3 miles? Heavy new supply (>2% of stock underway) typically softens rents 12–24 months out; light construction supports rent growth.
Investment metrics
- 1% rule
- 0.98% ✗
- Cap rate
- 5.82%
- Cash-on-cash
- -1.70%
- DSCR
- 0.92
- GRM
- 8.5
CMA / ARV
No comps found within radius.
Projected returns pro-forma
-3.0% appreciation · 3.42% rent growth · sell at horizon
- IRR
- -18.4%
- Equity multiple
- 0.35×
- Total profit
- $-31,526
- Equity at exit
- $25,795
- IRR
- -9.7%
- Equity multiple
- 0.39×
- Total profit
- $-29,480
- Equity at exit
- $14,958
Cash invested: $48,440 (down + closing). Projections, not guarantees.
Landlord ↔ Tenant lean methodology
- Overall (STATE)
- 83 Strongly Landlord-Friendly
- State Kentucky
- 83 Strongly Landlord-Friendly · R+16
- County
- — inherits STATE
- City
- — inherits STATE
ZIP-level market 41042
- Rents YoY
- 3.4%
- Active inventory
- 265
- Price-to-rent
- 8.5×
Monthly cashflow live
- Estimated rent
- $1,690 high interval (Pro) →
- Mortgage (P&I)
- −$907
- Tax from tax record
- −$102 /mo · $1,228/yr
- Insurance
- −$72
- HOA
- −$322
- Vacancy / Maint / Mgmt
- −$355
- Net cashflow
- $-69
Break-even live
UW: 25.0% down · 7.5% · 30yr · 1.5% tax · 5.0% vac · 8.0% maint · 8.0% mgmt
Financing live
Cash to close
- Down payment
- $43,250
- Closing costs
- $5,190
- Reserves months
- —
- Total cash needed
- —
Loan-product check · same deal, 3 products live
Conventional
25% down · 7.5% · 30yr
- Down + closing
- —
- Monthly P&I
- —
- Monthly cashflow
- —
- DSCR
- —
- Eligible?
- —
Personal DTI + credit; lowest rate.
DSCR
20% down · 8.5% · 30yr
- Down + closing
- —
- Monthly P&I
- —
- Monthly cashflow
- —
- DSCR
- —
- Eligible?
- —
No personal income docs; deal must DSCR.
Hard money
10% down · 12.0% · 12mo
- Down + closing
- —
- Monthly P&I
- —
- Monthly cashflow
- —
- DSCR
- —
- Eligible?
- —
Short-term bridge; refi at stabilization.
Rent comps 5 comps
| Address | Beds | Baths | Sqft | Rent | $/sqft | DOM | Units | Dist |
|---|---|---|---|---|---|---|---|---|
| 1620 Corinthian Dr Florence, KY | 2.0–3.0 | 2.0 | 1165 | $1,451 | $1.25 | 2d | 21 | 0.99mi |
| 239 Landon Ct Florence, KY | 1.0–2.0 | 1.0–2.0 | 1228 | $2,222 | $1.81 | 1d | 11 | 1.00mi |
| 1000 Tamarack Cir Florence, KY | 2.0 | 1.0 | 825 | $1,434 | $1.74 | 2d | 6 | 1.01mi |
| 1919 Promenade CIR Union, KY | 1.0–3.0 | 1.0–2.5 | 1071 | $2,020 | $1.89 | 3d | 38 | 1.41mi |
| 8000 Preakness Dr Florence, KY | 1.0–3.0 | 1.0–2.0 | 1110 | $1,585 | $1.43 | 1d | 30 | 1.45mi |
HOA detail condo
- Monthly dues
- $322 · $3,864/yr
- Likely covers
- pool
- Assessments
- None detected in remarks — confirm with the listing agent.
Listing history 10 events
-
2026-06-18days on market $173,000 Active 14 DOM
-
2026-06-17days on market $173,000 Active 13 DOM
-
2026-06-16days on market $173,000 Active 12 DOM
-
2026-06-15days on market $173,000 Active 11 DOM
-
2026-06-13days on market $173,000 Active 9 DOM
-
2026-06-09days on market $173,000 Active 5 DOM
-
2026-06-08days on market $173,000 Active 4 DOM
-
2026-06-07days on market $173,000 Active 3 DOM
-
2026-06-05remarks 699-char remark
-
2026-06-05$173,000 Active 1 DOM
ⓘ Source: listings_history table (triggers on properties + properties_extension) + one-shot
backfill from property_details.listing_events for pre-trigger history.
Tax reassessment forecast KY · Resets to sale price
- Current annual tax
- $1,228 · $102/mo
- Projected year-2 tax
- $1,488 · $124/mo
- Expected delta
- +$260/yr (+$22/mo · 21.1%)
ⓘ Screening estimate from a state-policy table — verify with the county assessor before closing.
Climate risk First Street
- Flood 1/10 Low FEMA zone X (unshaded) · 0% chance over 30 yrs
- Wildfire 1/10 Low
- Heat 4/10 Moderate 7 d/yr ≥102°F today · 19 d/yr by 30 yrs out
- Wind 2/10 Low 100% chance of damaging wind over 30 yrs
- Air quality 2/10 Low 1 unhealthy d/yr today · 3 by 30 yrs out
Nearby sold comps map
Loading sold comps map…
Walkable amenities ~0.75 mi
Loading nearby amenities…
Taxation est. · year 1
- Rental income
- $20,281
- − Mortgage interest
- −$9,691
- − Property taxes
- −$1,228
- − Insurance
- −$865
- − Repairs & maintenance
- −$1,622
- − Management
- −$1,622
- − HOA
- −$3,864
- − Depreciation
- −$5,033
- Taxable loss
- −$3,645
- Est. tax savings @ 24.0%
- +$875
- After-tax cash flow
- $53/yr
For passive investors: Depreciation is non-cash, so a rental often shows a tax loss while cash-flowing — sheltering income. Rental losses are passive: they offset passive income freely, and up to $25,000/yr can offset ordinary (W-2) income if you actively participate and your MAGI is under $100k (phasing out to $0 by $150k); unused losses carry forward. On sale, claimed depreciation is recaptured at up to 25%, and gains may owe capital-gains tax (a 1031 exchange can defer both). Figures are a year-1 estimate at your 24.0% rate — not tax advice; consult a CPA.
Schools (NCES district)
- District
- Boone County
- NCES district ID
- 2100510
- Math proficiency
- 43% ▼ -10.00%
- Reading proficiency
- 49% ▼ -12.00%
- Median HH income
- $68,096
- Composite
- 41.18/100
- National rank
- #3550
- State rank
- #12 of 165 in KY
Livability — Florence
- Score
- 78/100
- State rank
- #82
- US rank
- #2763
Category grades
Schools grade is shown separately in the Schools card above.
Census & demographics
- Census place
- Florence, KY
- County
- Boone County · 99,563 people
- City population
- 57,634
- Metro
- Cincinnati, OH-KY-IN
- Population (ZIP)
- 57,634
- Household income
- $79,712
- Rent vs Own
- Severe rent burden
- 1397.0
Population outlook (Boone County) Hauer SSP2
- Today (2025)
- 144,066 people
- By 2030
- 152,005 · +5.5%
- By 2040
- 166,776 · +15.8%
- By 2050
- 178,974 · +24.2%
- By 2075
- 204,515 · +42.0%
- By 2100
- 215,306 · +49.4%
Race, ethnicity, and origin ACS 2023
- Neighborhood character
- Predominantly White (78%)
- Race & ethnicity
- White 78% Hispanic / Latino 8% Black 7% Two or more races 7% Asian 3%
- Hispanic origin (detail)
- Mexican 5%
- Common ancestry
- Romanian 3% Slovak 2% Iranian 2%
- Foreign-born
- 9% · Canada, Vietnam
- Languages at home
- 89% English-only · Spanish 5% French/Haitian/Cajun 2% Other Indo-European 2%
Political lean MEDSL · Boone
- 2024 margin
- Solid R (+37.2) · D 30.6% · R 67.8% · Other 1.7%
- 2008→2024 swing
- -2.7pp toward R · 2008: -34.5pp · 2024: -37.2pp
- All cycles
- 2024: R+37.2 2020: R+35.7 2016: R+41.8 2012: R+38.7 2008: R+34.5
Not yet ingested
- Civics
- —
Market trends
- HPI YoY
- ▼ -195.07%
- Current HPI
- 206.3259
- Rent YoY
- ▲ 3.42%
- Metro
- Cincinnati, OH-KY-IN
- State GDP YoY
- ▲ 1.81%
- F500 in state
- 4
Industry mix (Fortune 500 HQ in KY)
| Industry | F500 HQs | Revenue |
|---|---|---|
| Healthcare | 1 | $118B |
|
||
| Food / Beverage | 1 | $7B |
|
||
Price history
+166.6% since first listed11 events — show timeline
- 2026-06-03 Listed $173,000 NKMLS
- 2019-12-02 Sold (Public Records) $90,000 Public Records
- 2019-11-04 Sold (MLS) $90,000 NKMLS
- 2019-08-12 Listing Removed — NKMLS
- 2019-08-01 Listed $93,000 NKMLS
- 1998-03-27 Sold (MLS) $65,900 NKMLS
- 1998-01-30 Listed $67,500 NKMLS
- 1995-09-22 Sold (MLS) $62,900 NKMLS
- 1995-08-10 Listed $63,750 NKMLS
- 1995-04-13 Sold (MLS) $62,033 NKMLS
- 1994-12-12 Listed $64,900 NKMLS
Property tax history
+12.4%/yrLatest (2025): $1,228 · +2.0% YoY. Source: county tax records.
Cash-flow waterfall
monthlySold comps — $/sqft
last 12 mo · ≤1 miLoading sold comps…