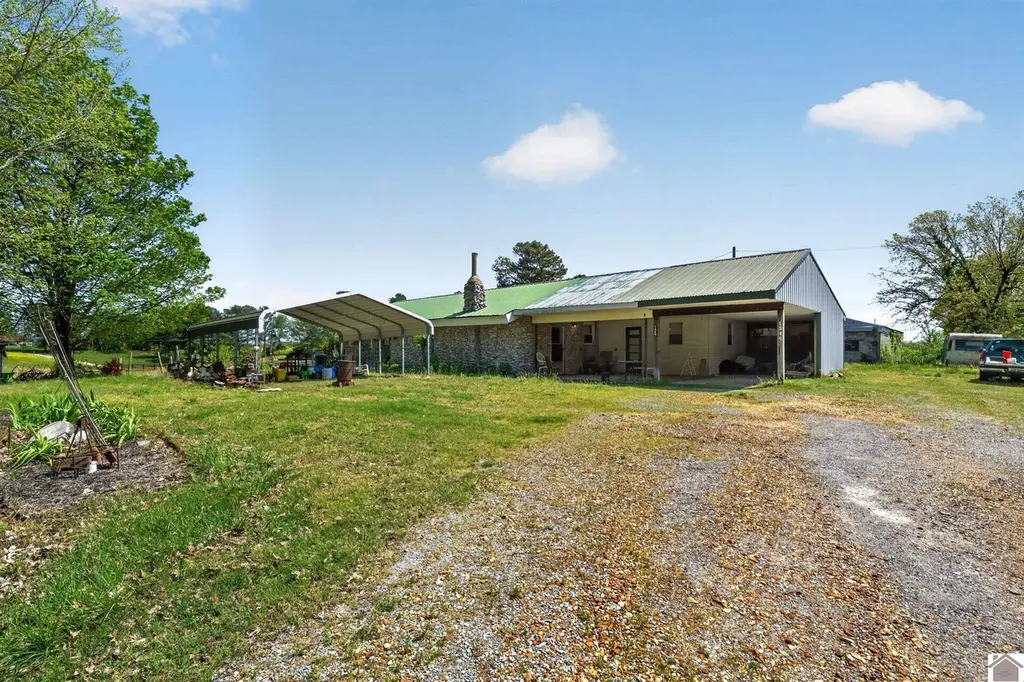
1549 Golo Rd · Farmington, KY
Flood risk 1/10 · Minimal
- FEMA flood zone
- X (unshaded)
- Chance of flooding over 30 yrs
- 0.0%
- Est. flood insurance / yr
- $507 – $1,088
Fire risk 4/10 · Minor
- Est. fire insurance / yr
- $839 – $1,559
Heat risk 5/10 · Moderate
- Hot days now (above 107°F)
- 7 days/yr
- Hot days in 30 yrs
- 20 days/yr
Wind risk 4/10 · Minor
- Chance of severe wind over 30 yrs
- 8.0%
Air-quality risk 2/10 · Minimal
- Unhealthy air days now
- 0 days/yr
- Unhealthy air days in 30 yrs
- 1 days/yr
Risk factors via First Street. Map © Google.
Why this score? — see what drove the B- grade
The composite is a weighted blend of 9 inputs, each scored 0–100. Each bar is that input's sub-score; the figure is the points it added to the 100-point composite (weight × sub-score).
- Cash flow +30.0/30.0
- 1% rule +10.0/10.0
- DSCR +10.0/10.0
- ARV discount +7.5/15.0
- Schools +4.2/10.0
- Livability +2.8/5.0
- Rent growth +2.5/5.0
- Condition / age +2.5/5.0
- Appreciation +0.0/10.0
$65,000
🖨 Deal sheet (PDF) 📄 Offer letter ✓ Due diligence
Listing remarks
CALLING ALL INVESTORS!! This property features multiple outbuildings, each ready for storage, workshops, equipment, or future conversion projects. The layout provides endless possibilities—whether you’re looking to expand your rental portfolio or establish a small agricultural operation. The main homesite sits peacefully off the road, there’s room for livestock, gardens, additional structures, or recreational use. Investors will appreciate the flexibility of the land, the existing infrastructure, and the opportunity to add value through updates or development.
Key facts
- Room for livestock
- 0.75 acre lot
- Parking
Tags
Property features AI
Exterior
- Parking: Carport with 1 space
- Utilities: Shared well water; Septic tank sewer
- Home design: Single family residence; Residential property
- Exterior features: Metal roof; 0.75 acre lot
Interior
- Kitchen: Microwave; Refrigerator; Cooktop
- Bathrooms: 1 full bathroom
- Heating & cooling: Central Air
- Interior features: Microwave; Refrigerator; Cooktop
Neighborhood map
What this means for you Summary
Snapshot
- This is a 3-bed/1.0-bath single-family listed at $65k.
Deal economics
- At list price, monthly cash flow is $492 ($6k/yr) — positive.
- The deal already cash-flows at list — no discount required.
- Meets the 1% rule at list price ($1k rent vs $65k).
- Recommended offer: $63k (3.0% below list) — sets the bar for market timing.
Location & tenants
- Location reads 56/100 on livability (#458 in KY) — a working-class tenant base; expect higher turnover. Strengths: cost of living A+; Watch: housing D, amenities F, commute F.
- Graves County (rural): math 47% / reading 52% proficiency, ranked #10 of 165 in KY (top 6%) — families likely to look elsewhere, expect single-tenant / working-renter base with shorter leases.
- Zoned schools: Farmington Elementary School (math 52% / reading 62%, grade C+, #47 of 676 statewide, top 8%, 266 students, 62% FRL); Graves County Middle School (math 37% / reading 52%, grade D, #36 of 217 statewide, top 18%, 621 students, 53% FRL); Graves County High School (math 35% / reading 40%, grade F, #57 of 254 statewide, top 22%, 1,096 students, 49% FRL).
- Market conditions: 126 active listings in the ZIP; 9 units permitted in Graves County in 2024 (0 in 5+ unit buildings).
Forward outlook
- Local home prices are declining (-3.0%/yr); year-one equity from $449 of loan paydown is wiped out by about $2k of value loss. Plan a longer hold.
- Graves County population projected to shrink 8% by 2050 — rents likely to lag national; underwrite the cash flow, not the appreciation.
- At projected returns (-3.0% appreciation + 3.0% rent growth), your $18k cash investment doubles in ~4 years — after that, you're playing with house money.
Negotiation context
- It's been on market 45 days — a 3% lower offer ($63k) is reasonable based on typical stale-listing flexibility.
Risks & watch-outs
- Watch-outs: built in 1952 — expect roof / HVAC / electrical / plumbing capex.
- Climate carrying-cost: extreme-heat days projected 7→20/yr by 2055 (HVAC capex compounding) — expect insurance premiums to compound above CPI over the hold.
Questions for the listing agent
- It's been on market 45 days. Have you received any prior offers? Is the seller open to a 3% concession, seller financing, or rate buy-down credit?
- Built in 1952 — when were the roof, HVAC, electrical panel, plumbing, and water heater last replaced?
- Is there a deadline driving the sale (1031 exchange, divorce, estate, relocation)? That informs how much negotiation room exists.
- Schools are F-rated, which usually means shorter tenancies and higher turnover. Who's the typical renter profile here, and what's been the actual vacancy rate?
- What's the average days-on-market for RENTAL listings here right now (not sales)? A rising rental-DOM trend means longer vacancies and softer asking-rent achievability than the comps imply.
- What's the recent tenant-quality profile in this submarket — average credit score on applications, eviction rate, late-payment / NSF rate, and stable-employment percentage? A property-management company in the area should have these aggregated.
- How much new for-sale + rental construction is in the pipeline within 1–3 miles? Heavy new supply typically softens prices + rents 12–24 months out; constrained supply supports both.
Investment metrics
- 1% rule
- 1.83% ✓
- Cap rate
- 15.38%
- Cash-on-cash
- 32.46%
- DSCR
- 2.44
- GRM
- 4.5
CMA / ARV
No comps found within radius.
Projected returns pro-forma
-3.0% appreciation · 3.0% rent growth · sell at horizon
- IRR
- 27.5%
- Equity multiple
- 2.15×
- Total profit
- $20,845
- Equity at exit
- $9,692
- IRR
- 35.1%
- Equity multiple
- 4.22×
- Total profit
- $58,605
- Equity at exit
- $5,620
Cash invested: $18,200 (down + closing). Projections, not guarantees.
Landlord ↔ Tenant lean methodology
- Overall (STATE)
- 83 Strongly Landlord-Friendly
- State Kentucky
- 83 Strongly Landlord-Friendly · R+16
- County
- — inherits STATE
- City
- — inherits STATE
ZIP-level market 42066
- Home prices YoY
- -4.2%
- Active inventory
- 126
- Price-to-rent
- 4.5×
Monthly cashflow live
- Estimated rent
- $1,192 medium interval (Pro) →
- Mortgage (P&I)
- −$341
- Tax est. 1.5%
- −$81 /mo · $975/yr
- Insurance
- −$27
- HOA
- −$0
- Vacancy / Maint / Mgmt
- −$250
- Net cashflow
- $492
Break-even live
Sensitivity live
| Price | -10% $537 | -5% $515 | +0% $492 | +5% $470 | +10% $447 |
|---|---|---|---|---|---|
| Rent | -10% $398 | -5% $445 | +0% $492 | +5% $539 | +10% $587 |
| Rate | -1.0pp $525 | -0.5pp $509 | base $492 | +0.5pp $476 | +1.0pp $458 |
UW: 25.0% down · 7.5% · 30yr · 1.5% tax · 5.0% vac · 8.0% maint · 8.0% mgmt
Financing live
Cash to close
- Down payment
- $16,250
- Closing costs
- $1,950
- Reserves months
- —
- Total cash needed
- —
Loan-product check · same deal, 3 products live
Conventional
25% down · 7.5% · 30yr
- Down + closing
- —
- Monthly P&I
- —
- Monthly cashflow
- —
- DSCR
- —
- Eligible?
- —
Personal DTI + credit; lowest rate.
DSCR
20% down · 8.5% · 30yr
- Down + closing
- —
- Monthly P&I
- —
- Monthly cashflow
- —
- DSCR
- —
- Eligible?
- —
No personal income docs; deal must DSCR.
Hard money
10% down · 12.0% · 12mo
- Down + closing
- —
- Monthly P&I
- —
- Monthly cashflow
- —
- DSCR
- —
- Eligible?
- —
Short-term bridge; refi at stabilization.
Listing history 18 events
-
2026-06-21days on market $65,000 Active 45 DOM
-
2026-06-19days on market $65,000 Active 43 DOM
-
2026-06-18days on market $65,000 Active 42 DOM
-
2026-06-17days on market $65,000 Active 41 DOM
-
2026-06-17price $65,000 Active 40 DOM
-
2026-06-16days on market $70,000 Active 40 DOM
-
2026-06-15days on market $70,000 Active 39 DOM
-
2026-06-14days on market $70,000 Active 37 DOM
-
2026-06-12days on market $70,000 Active 36 DOM
-
2026-06-09days on market $70,000 Active 33 DOM
-
2026-06-08days on market $70,000 Active 32 DOM
-
2026-06-07days on market $70,000 Active 31 DOM
-
2026-06-05pricedays on market $70,000 Active 28 DOM
-
2026-06-02days on market $79,000 Active 26 DOM
-
2026-06-01days on market $79,000 Active 25 DOM
-
2026-05-31days on market $79,000 Active 24 DOM
-
2026-05-30days on market $79,000 Active 23 DOM
-
2026-05-07$79,000 Active 584-char remark
ⓘ Source: listings_history table (triggers on properties + properties_extension) + one-shot
backfill from property_details.listing_events for pre-trigger history.
Climate risk First Street
- Flood 1/10 Low FEMA zone X (unshaded) · 0% chance over 30 yrs
- Wildfire 4/10 Moderate
- Heat 5/10 Major 7 d/yr ≥107°F today · 20 d/yr by 30 yrs out
- Wind 4/10 Moderate 8% chance of damaging wind over 30 yrs
- Air quality 2/10 Low 0 unhealthy d/yr today · 1 by 30 yrs out
Nearby sold comps map
Loading sold comps map…
Walkable amenities ~0.75 mi
Loading nearby amenities…
Taxation est. · year 1
- Rental income
- $14,302
- − Mortgage interest
- −$3,641
- − Property taxes
- −$975
- − Insurance
- −$325
- − Repairs & maintenance
- −$1,144
- − Management
- −$1,144
- − Depreciation
- −$1,891
- Taxable income
- $5,182
- Est. tax owed @ 24.0%
- −$1,244
- After-tax cash flow
- $4,665/yr
For passive investors: Depreciation is non-cash, so a rental often shows a tax loss while cash-flowing — sheltering income. Rental losses are passive: they offset passive income freely, and up to $25,000/yr can offset ordinary (W-2) income if you actively participate and your MAGI is under $100k (phasing out to $0 by $150k); unused losses carry forward. On sale, claimed depreciation is recaptured at up to 25%, and gains may owe capital-gains tax (a 1031 exchange can defer both). Figures are a year-1 estimate at your 24.0% rate — not tax advice; consult a CPA.
Schools (NCES district)
- District
- Graves County
- NCES district ID
- 2102280
- Math proficiency
- 47% ▼ -9.00%
- Reading proficiency
- 52% ▼ -14.00%
- Median HH income
- $43,560
- Composite
- 41.74/100
- National rank
- #3400
- State rank
- #10 of 165 in KY
Livability — Farmington
- Score
- 56/100
- State rank
- #458
- US rank
- #22796
Category grades
Schools grade is shown separately in the Schools card above.
Census & demographics
- Population (ZIP)
- 23,635
Population outlook (Graves County) Hauer SSP2
- Today (2025)
- 36,916 people
- By 2030
- 36,587 · -0.9%
- By 2040
- 35,580 · -3.6%
- By 2050
- 33,906 · -8.2%
- By 2075
- 28,957 · -21.6%
- By 2100
- 21,552 · -41.6%
Race, ethnicity, and origin ACS 2023
- Neighborhood character
- Predominantly White (80%)
- Race & ethnicity
- White 80% Hispanic / Latino 11% Two or more races 7% Black 6%
- Hispanic origin (detail)
- Mexican 10%
- Common ancestry
- Slovak 2% Italian 2% Serbian 1%
- Foreign-born
- 4% · Canada
- Languages at home
- 92% English-only · Spanish 7%
Political lean MEDSL · Graves
- 2024 margin
- Solid R (+61.6) · D 18.6% · R 80.2% · Other 1.2%
- 2008→2024 swing
- -35.5pp toward R · 2008: -26.1pp · 2024: -61.6pp
- All cycles
- 2024: R+61.6 2020: R+56.7 2016: R+56.5 2012: R+39.7 2008: R+26.1
Not yet ingested
- Civics
- —
Market trends
- HPI YoY
- ▼ -11.24%
- Current HPI
- 258.3279
- Rent YoY
- —
- Metro
- —
- State GDP YoY
- ▲ 1.81%
- F500 in state
- 4
Industry mix (Fortune 500 HQ in KY)
| Industry | F500 HQs | Revenue |
|---|---|---|
| Healthcare | 1 | $118B |
|
||
| Food / Beverage | 1 | $7B |
|
||
Price history
-17.7% since first listed3 events — show timeline
- 2026-06-16 Price Changed $65,000 WKRMLS
- 2026-06-04 Price Changed $70,000 WKRMLS
- 2026-05-07 Listed $79,000 WKRMLS
Property tax history
+0.0%/yrLatest (2025): $40 · +0.0% YoY. Source: county tax records.
Cash-flow waterfall
monthlySold comps — $/sqft
last 12 mo · ≤1 miLoading sold comps…