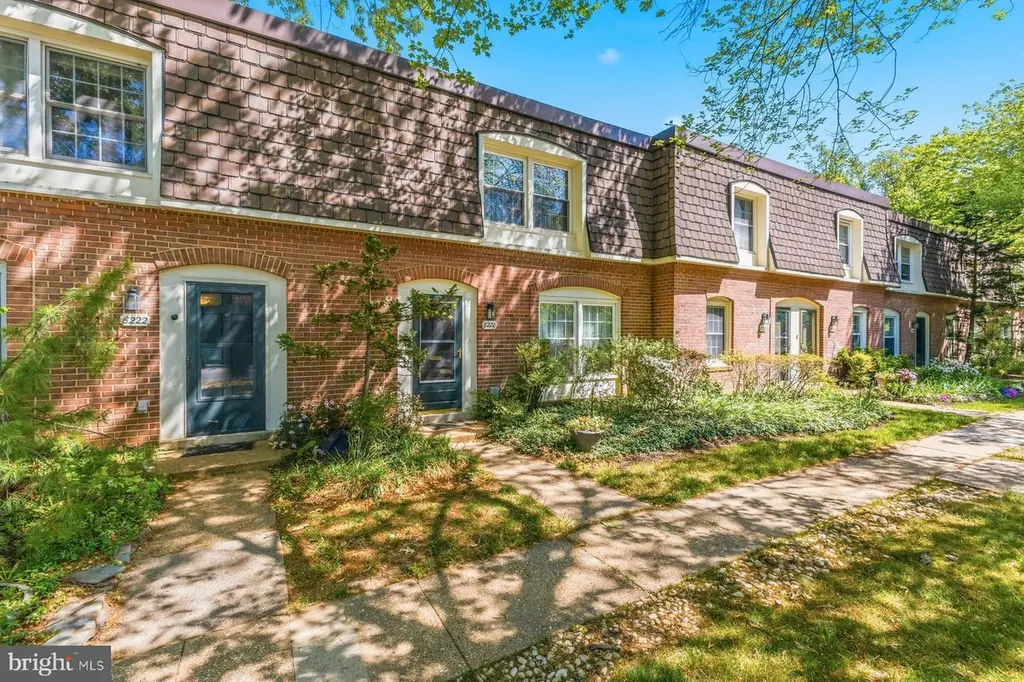
8220 Carrleigh Pkwy #11 · West Springfield, VA
Flood risk 1/10 · Minimal
- FEMA flood zone
- X (unshaded)
- Chance of flooding over 30 yrs
- 0.0%
- Est. flood insurance / yr
- $507 – $1,088
Fire risk 2/10 · Minimal
- Est. fire insurance / yr
- $666 – $1,236
Heat risk 7/10 · Major
- Hot days now (above 104°F)
- 7 days/yr
- Hot days in 30 yrs
- 15 days/yr
Wind risk 4/10 · Minor
- Chance of severe wind over 30 yrs
- 16.0%
Air-quality risk 3/10 · Minor
- Unhealthy air days now
- 2 days/yr
- Unhealthy air days in 30 yrs
- 3 days/yr
Risk factors via First Street. Map © Google.
Why this score? — see what drove the F grade
The composite is a weighted blend of 9 inputs, each scored 0–100. Each bar is that input's sub-score; the figure is the points it added to the 100-point composite (weight × sub-score).
- ARV discount +11.0/15.0
- Schools +6.3/10.0
- Cash flow +4.9/30.0
- Livability +3.8/5.0
- 1% rule +3.1/10.0
- Rent growth +3.0/5.0
- Condition / age +2.5/5.0
- DSCR +0.0/10.0
- Appreciation +0.0/10.0
$360,000
🖨 Deal sheet 📄 Offer letter ✓ Due diligence
Listing remarks
Welcome to 8220 Carrleigh Pkwy, a 3-bedroom townhome in the Cardinal Forest community, located in the highly sought-after West Springfield area. Hardwood floors run throughout the main and upper levels, and the location is a commuter’s dream, making this a home that is hard to pass up Step inside to a welcoming foyer that opens to a spacious living room filled with natural light from the front-facing windows. The kitchen features a brick backsplash, tile flooring, and a dedicated eat-in area, creating a space for everyday meals. A half bath and main-level washer and dryer add to the home's everyday convenience. Upstairs you will find three bedrooms, one full bath, and one half bath. T
Key facts
- Brick backsplash
- Concrete patio
- Storage shed
Tags
Property features AI
Finance
- Other: Property managed by a property manager; No pet restrictions (pets allowed)
- HOA & community: Monthly condo fee of $735; HOA covers common area maintenance, lawn maintenance, management, pool(s), recreation facility, road maintenance, snow removal, exterior building maintenance, gas, heat, parking fee, sewer, and water; Community amenities include swimming pools (indoor and outdoor), club house, community center, reserved/assigned parking, playgrounds, walking paths, picnic area, party room and tennis courts
Exterior
- Parking: One assigned parking space (space #11); On-street parking available; Assigned parking
- Utilities: Public water; Public sewer; Electric cooling fuel; Natural gas heating and hot water
- Home design: Condominium ownership; Interior townhouse/rowhouse; Brick construction; Slab foundation
- Construction: Brick exterior; Slab foundation; Above- and below-grade structures noted
- Exterior features: Community pool; Common grounds; Clubhouse; Community center; Tot lots/playground; Jog/walk path; Picnic area; Party room; Tennis courts; Reserved/assigned parking
Interior
- Kitchen: Stove; Refrigerator; Built-in microwave; Garbage disposal
- Bedrooms: Three bedrooms on the upper level
- Bathrooms: One full bathroom and one half bathroom on the upper level; An additional half bathroom on the main level; Total: 1 full bath, 2 half baths
- Heating & cooling: Central heating with natural gas; Programmable thermostat; Central air conditioning; Ceiling fans; Hot water heated by natural gas
- Interior features: Very good condition; Built-in microwave; Garbage disposal
- Laundry & utility: Washer and dryer in unit; Has laundry
Neighborhood map
What this means for you Summary
Snapshot
- This is a 3-bed/2.0-bath townhouse listed at $360k.
Deal economics
- At list price, monthly cash flow is $-872 ($-10k/yr) — negative.
- To cash-flow at today's rent, offer at most $206k (42.8% below list).
- To meet the 1% rule (rent ≥ 1% of price), the offer needs to be $290k (19.3% below list).
- Recommended offer: $206k (42.8% below list) — sets the bar for cash-flow.
Location & tenants
- Location reads 75/100 on livability (#125 in VA, #4,050 nationally) — a middle-class / working-renter tenant base. Strengths: crime A+, employment A+, housing A+; Watch: health & safety C-, amenities D-, commute F.
- Fairfax County Public School District (suburban): math 61% / reading 73% proficiency, ranked #13 of 131 in VA (top 10%) — acceptable for families but not a draw, mixed tenant base, ~2y average lease.
- Zoned schools: Cardinal Forest Elementary (math 59% / reading 76%, grade B+, #372 of 1,108 statewide, top 34%, 632 students, 30% FRL); Irving Middle (math 71% / reading 87%, grade A+, #29 of 342 statewide, top 9%, 1,163 students, 15% FRL); West Springfield High (math 76% / reading 77%, grade A-, #99 of 319 statewide, top 31%, 2,663 students, 17% FRL) — zoned schools at 21% FRL track the district average.
- Market conditions: Rents rising (+1.9%/yr); 92 active listings in the ZIP; 11 comparable units currently listed for rent nearby; rentals leasing fast (median 13d on market — plan ~1-2 weeks tenant-placement turnaround); high-income renter base; 2,861 units permitted in Fairfax County in 2024 (1,829 in 5+ unit buildings).
Forward outlook
- Local home prices are declining (-3.0%/yr); year-one equity from $2k of loan paydown is wiped out by about $11k of value loss. Plan a longer hold.
- Fairfax County population projected at +13% by 2050 — modest demand growth; plan on rents tracking national, not racing it.
Negotiation context
- Only 5 days on market — expect competitive offers; lowballing is unlikely to land.
Risks & watch-outs
- Watch-outs: HOA is 25% of rent.
- Climate carrying-cost: extreme-heat days projected 7→15/yr by 2055 (HVAC capex compounding) — expect insurance premiums to compound above CPI over the hold.
Questions for the listing agent
- What do current leases actually rent for vs. the listed asking? Can we see a recent rent roll and the last 12 months of T-12 income?
- Built in 1968 — when were the roof, HVAC, electrical panel, plumbing, and water heater last replaced?
- What does the HOA fee cover, when was the last increase, and are there any pending special assessments or reserve-fund shortfalls?
- Is there a deadline driving the sale (1031 exchange, divorce, estate, relocation)? That informs how much negotiation room exists.
- Schools are A-rated — typically a magnet for longer-tenancy family renters. What's the average tenant stay here, and is there a school-zone premium baked into asking?
- The area grade is low — what's the realistic commute time and amenity access for the typical tenant pool here? Any planned neighborhood developments (good or bad) we should know about?
- What's the average days-on-market for RENTAL listings here right now (not sales)? A rising rental-DOM trend means longer vacancies and softer asking-rent achievability than the comps imply.
- What's the recent tenant-quality profile in this submarket — average credit score on applications, eviction rate, late-payment / NSF rate, and stable-employment percentage? A property-management company in the area should have these aggregated.
- How much new for-sale + rental construction is in the pipeline within 1–3 miles? Heavy new supply typically softens prices + rents 12–24 months out; constrained supply supports both.
Investment metrics
- 1% rule
- 0.81% ✗
- Cap rate
- 3.39%
- Cash-on-cash
- -10.38%
- DSCR
- 0.54
- GRM
- 10.3
CMA / ARV
- ARV (median comp)
- $390,707
- List price
- $360,000
- Delta
- -7.86%
- Verdict
- FAIR
- Comps
- 20 within 1.0 mi
Show comp detail 12 sales within ~0.75 mi
| Address | Dist | Beds/Ba | Sqft | Sold | Price | $/sf | Match |
|---|---|---|---|---|---|---|---|
| 8220 Carrleigh Pkwy #11 | 0.00mi | 3/2.0 | 1,452 (0%) | 0mo | $380,000 | $262 | 100 |
| 8142 Carrleigh Pkwy #126 | 0.09mi | 3/2.5 | 1,452 (0%) | 2mo | $442,000 | $304 | 92 |
| 5921 Minutemen Rd | 0.22mi | 3/2.0 | 1,452 (0%) | 4mo | $390,000 | $269 | 86 |
| 8256 Carrleigh Pkwy | 0.17mi | 3/2.5 | 1,540 (+6%) | 2mo | $150,000 | $97 | 78 |
| 8356 Forrester Blvd #470 | 0.28mi | 3/2.5 | 1,452 (0%) | 9mo | $420,000 | $289 | 77 |
| 8422 Penshurst Dr #594 | 0.41mi | 3/2.0 | 1,442 (-1%) | 10mo | $425,000 | $295 | 71 |
| 8425 Penshurst Dr #595 | 0.44mi | 3/2.5 | 1,452 (0%) | 9mo | $425,000 | $293 | 70 |
| 8145 Carrleigh Pkwy | 0.08mi | 2/1.5 (-1) | 1,320 (-9%) | 7mo | $500,000 | $379 | 68 |
| 5818 Torington Dr #859 | 0.54mi | 2/1.5 (-1) | 1,442 (-1%) | 4mo | $420,000 | $291 | 64 |
| 8530 Barrington Ct #938 | 0.60mi | 3/2.0 | 1,410 (-3%) | 7mo | $300,000 | $213 | 61 |
| 8437 Forrester Blvd | 0.44mi | 3/3.0 | 1,540 (+6%) | 7mo | $680,000 | $442 | 60 |
| 5816 Torington Dr #860 | 0.54mi | 2/1.5 (-1) | 1,397 (-4%) | 6mo | $415,000 | $297 | 57 |
Match score weights: distance 35% · size 25% · config 20% · recency 20%. Top-matched comps best support the ARV.
Projected returns pro-forma
-3.0% appreciation · 1.87% rent growth · sell at horizon
- IRR
- -36.5%
- Equity multiple
- -0.16×
- Total profit
- $-116,653
- Equity at exit
- $53,677
- IRR
- -61.6%
- Equity multiple
- -0.83×
- Total profit
- $-184,289
- Equity at exit
- $31,126
Cash invested: $100,800 (down + closing). Projections, not guarantees.
Landlord ↔ Tenant lean methodology
- Overall (STATE)
- 55 Moderately Landlord-Leaning
- State Virginia
- 55 Moderately Landlord-Leaning · D+2
- County
- — inherits STATE
- City
- — inherits STATE
ZIP-level market 22152
- Rents YoY
- 1.9%
- Active inventory
- 92
- Price-to-rent
- 10.3×
Monthly cashflow live
- Estimated rent
- $2,905 high interval (Pro) →
- Mortgage (P&I)
- −$1,888
- Tax from tax record
- −$393 /mo · $4,719/yr
- Insurance
- −$150
- HOA
- −$735
- Vacancy / Maint / Mgmt
- −$610
- Net cashflow
- $-872
Break-even live
UW: 25.0% down · 7.5% · 30yr · 1.5% tax · 5.0% vac · 8.0% maint · 8.0% mgmt
Financing live
Cash to close
- Down payment
- $90,000
- Closing costs
- $10,800
- Reserves months
- —
- Total cash needed
- —
Loan-product check · same deal, 3 products live
Conventional
25% down · 7.5% · 30yr
- Down + closing
- —
- Monthly P&I
- —
- Monthly cashflow
- —
- DSCR
- —
- Eligible?
- —
Personal DTI + credit; lowest rate.
DSCR
20% down · 8.5% · 30yr
- Down + closing
- —
- Monthly P&I
- —
- Monthly cashflow
- —
- DSCR
- —
- Eligible?
- —
No personal income docs; deal must DSCR.
Hard money
10% down · 12.0% · 12mo
- Down + closing
- —
- Monthly P&I
- —
- Monthly cashflow
- —
- DSCR
- —
- Eligible?
- —
Short-term bridge; refi at stabilization.
Rent comps 11 comps
| Address | Beds | Baths | Sqft | Rent | $/sqft | DOM | Units | Dist |
|---|---|---|---|---|---|---|---|---|
| 5904 Bayshire Rd West Springfield, VA | 2.0 | 1.0 | 978 | $2,200 | $2.25 | 2d | 1 | 0.09mi |
| 5801 Rexford Dr #801 Springfield, VA | 3.0 | 1.0 | 1104 | $2,275 | $2.06 | 43d | 1 | 0.56mi |
| 5610 Kirkham Ct Springfield, VA | 4.0 | 3.5 | 1500 | $3,200 | $2.13 | 43d | 1 | 0.90mi |
| 5215 Lonsdale Dr Springfield, VA | 3.0 | 3.0 | 1408 | $3,350 | $2.38 | 4d | 1 | 0.94mi |
| 8525 Burling Wood Dr Springfield, VA | 1.0–3.0 | 1.0–2.0 | 967 | $3,225 | $3.33 | 1d | 16 | 1.07mi |
| 5626 Fort Corloran Dr Burke, VA | 3.0 | 2.5 | 1449 | $3,600 | $2.48 | 12d | 1 | 1.28mi |
| 8705 Sheridan Farms Ct Springfield, VA | 3.0 | 2.5 | 1700 | $3,100 | $1.82 | 43d | 1 | 1.31mi |
| 8729 Sheridan Farms Ct Springfield, VA | 4.0 | 3.5 | 1740 | $3,550 | $2.04 | 7d | 1 | 1.35mi |
| 8729 Sheridan Farms Ct Springfield, VA | 4.0 | 3.5 | 1740 | $3,650 | $2.10 | 18d | 1 | 1.35mi |
| 6212 Hillside Rd Springfield, VA | 3.0 | 2.5 | 1820 | $2,750 | $1.51 | 17d | 1 | 1.37mi |
| 7504 June St Springfield, VA | 3.0 | 1.0 | 1404 | $2,850 | $2.03 | 3d | 1 | 1.39mi |
HOA detail
- Monthly dues
- $735 · $8,820/yr
Listing history 3 events
-
2026-05-12status Pending 2100-char remark
-
2026-05-07$360,000 Active 2100-char remark
-
1983-09-13soldstatus $75,600
ⓘ Source: listings_history table (triggers on properties + properties_extension) + one-shot
backfill from property_details.listing_events for pre-trigger history.
Tax reassessment forecast VA · Resets to sale price
- Current annual tax
- $4,719 · $393/mo
- Projected year-2 tax
- $4,719 · $393/mo
- Expected delta
- $0/yr ($0/mo · 0.0%)
ⓘ Screening estimate from a state-policy table — verify with the county assessor before closing.
Climate risk First Street
- Flood 1/10 Low FEMA zone X (unshaded) · 0% chance over 30 yrs
- Wildfire 2/10 Low
- Heat 7/10 Severe 7 d/yr ≥104°F today · 15 d/yr by 30 yrs out
- Wind 4/10 Moderate 16% chance of damaging wind over 30 yrs
- Air quality 3/10 Moderate 2 unhealthy d/yr today · 3 by 30 yrs out
Nearby sold comps map
Loading sold comps map…
Walkable amenities ~0.75 mi
Loading nearby amenities…
Taxation est. · year 1
- Rental income
- $34,854
- − Mortgage interest
- −$20,166
- − Property taxes
- −$4,719
- − Insurance
- −$1,800
- − Repairs & maintenance
- −$2,788
- − Management
- −$2,788
- − HOA
- −$8,820
- − Depreciation
- −$10,473
- Taxable loss
- −$16,700
- Est. tax savings @ 24.0%
- +$4,008
- After-tax cash flow
- $-6,451/yr
For passive investors: Depreciation is non-cash, so a rental often shows a tax loss while cash-flowing — sheltering income. Rental losses are passive: they offset passive income freely, and up to $25,000/yr can offset ordinary (W-2) income if you actively participate and your MAGI is under $100k (phasing out to $0 by $150k); unused losses carry forward. On sale, claimed depreciation is recaptured at up to 25%, and gains may owe capital-gains tax (a 1031 exchange can defer both). Figures are a year-1 estimate at your 24.0% rate — not tax advice; consult a CPA.
Schools (NCES district)
- District
- Fairfax County Public School District
- NCES district ID
- 5101260
- Math proficiency
- 61% ▼ -24.00%
- Reading proficiency
- 73% ▼ -8.00%
- Median HH income
- $110,238
- Composite
- 62.59/100
- National rank
- #679
- State rank
- #13 of 131 in VA
Livability — West Springfield
- Score
- 75/100
- State rank
- #125
- US rank
- #4050
Category grades
Schools grade is shown separately in the Schools card above.
Census & demographics
- Census place
- West Springfield, VA
- County
- Fairfax County · 1,104,456 people
- City population
- 29,066
- Metro
- Washington-Arlington-Alexandria, DC-VA-MD-WV
- Population (ZIP)
- 28,814
- Household income
- $165,906
- Rent vs Own
- Severe rent burden
- 263.0
Population outlook (Fairfax County) Hauer SSP2
- Today (2025)
- 1,237,259 people
- By 2030
- 1,277,758 · +3.3%
- By 2040
- 1,346,508 · +8.8%
- By 2050
- 1,397,919 · +13.0%
- By 2075
- 1,493,100 · +20.7%
- By 2100
- 1,465,712 · +18.5%
Race, ethnicity, and origin ACS 2023
- Neighborhood character
- Diverse neighborhood (Simpson 0.70)
- Race & ethnicity
- White 48% Hispanic / Latino 19% Asian 16% Two or more races 13% Black 11%
- Hispanic origin (detail)
- Mexican 3% Puerto Rican 2%
- Common ancestry
- Romanian 3% Italian 2% Lithuanian 1%
- Foreign-born
- 27% · Canada, South Korea, Jamaica
- Languages at home
- 61% English-only · Spanish 16% Other Indo-European 7% Korean 3%
Political lean MEDSL · Fairfax
- 2024 margin
- Solid D (+35.0) · D 66.1% · R 31.1% · Other 2.8%
- 2008→2024 swing
- +13.8pp toward D · 2008: 21.2pp · 2024: 35.0pp
- All cycles
- 2024: D+35.0 2020: D+41.9 2016: D+36.2 2012: D+19.8 2008: D+21.2
Not yet ingested
- Civics
- —
Market trends
- HPI YoY
- ▼ -340.12%
- Current HPI
- 355.9566
- Rent YoY
- ▲ 1.87%
- Metro
- Washington-Arlington-Alexandria, DC-VA-MD-WV
- State GDP YoY
- ▲ 2.40%
- F500 in state
- 50
Industry mix (Fortune 500 HQ in VA)
| Industry | F500 HQs | Revenue |
|---|---|---|
| Aerospace / Defense | 4 | $236B |
|
||
| Technology / Defense | 3 | $32B |
|
||
| Financial Services | 2 | $176B |
|
||
| Utilities | 2 | $27B |
|
||
| Insurance | 2 | $25B |
|
||
| Technology | 2 | $15B |
|
||
Price history
+402.6% since first listed4 events — show timeline
- 2026-06-10 Sold (MLS) $380,000 BRIGHT MLS
- 2026-05-12 Pending — BRIGHT MLS
- 2026-05-07 Listed $360,000 BRIGHT MLS
- 1983-09-13 Sold (Public Records) $75,600 Public Records
Property tax history
+3.4%/yrLatest (2025): $4,719 · +11.8% YoY. Source: county tax records.
Cash-flow waterfall
monthlySold comps — $/sqft
last 12 mo · ≤1 miLoading sold comps…