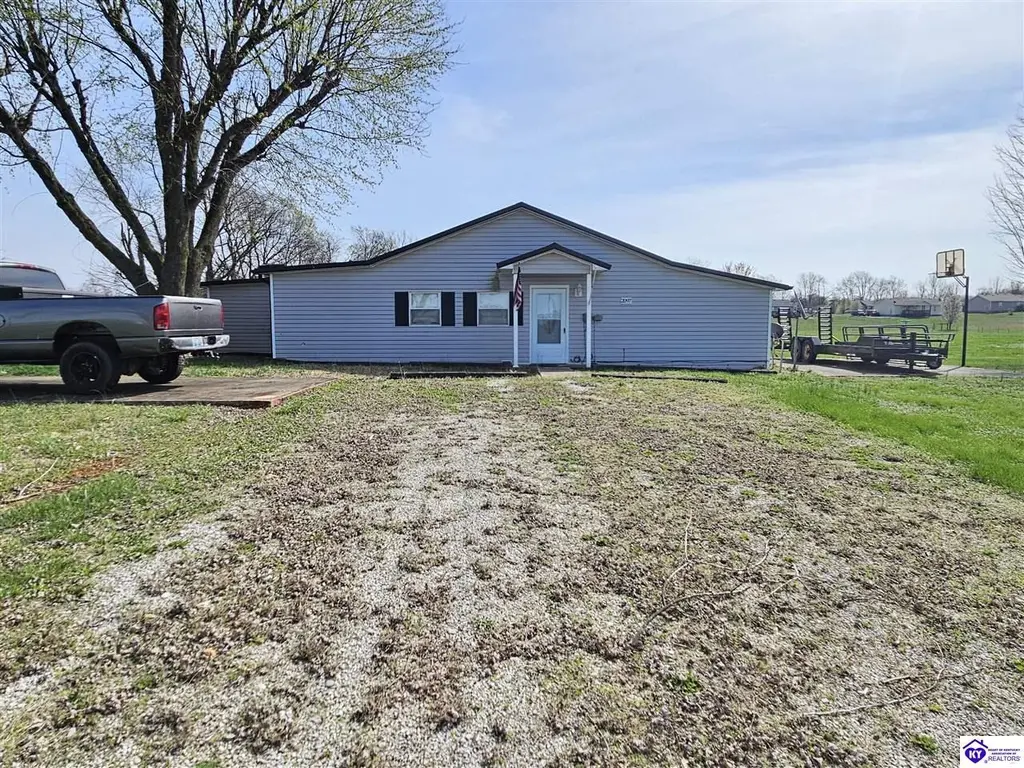
2097 Sonora Hardin Springs Rd · Sonora, KY
Flood risk 1/10 · Minimal
- FEMA flood zone
- X (unshaded)
- Chance of flooding over 30 yrs
- 0.0%
- Est. flood insurance / yr
- $507 – $1,088
Fire risk 4/10 · Minor
- Est. fire insurance / yr
- $839 – $1,559
Heat risk 5/10 · Moderate
- Hot days now (above 105°F)
- 7 days/yr
- Hot days in 30 yrs
- 20 days/yr
Wind risk 3/10 · Minor
- Chance of severe wind over 30 yrs
- 6.0%
Air-quality risk 1/10 · Minimal
- Unhealthy air days now
- 0 days/yr
- Unhealthy air days in 30 yrs
- 0 days/yr
Risk factors via First Street. Map © Google.
Why this score? — see what drove the C+ grade
The composite is a weighted blend of 9 inputs, each scored 0–100. Each bar is that input's sub-score; the figure is the points it added to the 100-point composite (weight × sub-score).
- Cash flow +25.7/30.0
- DSCR +8.6/10.0
- ARV discount +7.5/15.0
- 1% rule +5.6/10.0
- Appreciation +5.0/10.0
- Schools +3.2/10.0
- Livability +3.1/5.0
- Rent growth +2.5/5.0
- Condition / age +2.5/5.0
$190,500
🖨 Deal sheet (PDF) 📄 Offer letter ✓ Due diligence
Listing remarks
Come check this out!!! Investment opportunity ready to go, this beautiful 2 bedroom 1 bath home on . 68 acres. This home has an additional bonus room ready to be used as a home office, extra large pantry or whatever you are needing in this space. Also featuring 2 car garage with a 3rd garage space located on the other side of the home for extra storage, along with a concrete slab ready to park your trailer or a game of basketball. This home is currently being rented to a tenant at the rate of $1600 per month, this tenant is willing to discuss terms in staying as a tenant with the future buyers. If you are looking to purchase without having a tenant, current tenant agreement will have to be
Key facts
- 0.68 acre lot
- 3 garage spots
- Built 1987
Property features AI
Exterior
- Parking: Attached garage with 3 spaces; Gravel driveway
- Security: Smoke detectors
- Utilities: Septic tank
- Home design: Single-family residential; Single story
- Construction: Vinyl siding; Metal roof; Slab foundation
- Exterior features: Deck; Lot of approximately 0.68 acres
Interior
- Kitchen: Range; Oven; Refrigerator
- Flooring: Carpet; Tile
- Bathrooms: 1 full bathroom (main level)
- Heating & cooling: Heat pump heating (electric); Central air conditioning; Ceiling fans
- Interior features: Range, Oven, Refrigerator, Electric water heater; Carpet and Tile flooring
- Laundry & utility: Laundry room
Neighborhood map
What this means for you Summary
Snapshot
- This is a 2-bed/1.0-bath other listed at $190k.
Deal economics
- At list price, monthly cash flow is $455 ($5k/yr) — positive.
- The deal already cash-flows at list — no discount required.
- Meets the 1% rule at list price ($2k rent vs $190k).
- Recommended offer: $179k (6.0% below list) — sets the bar for market timing.
Location & tenants
- Location reads 62/100 on livability (#342 in KY) — a middle-class / working-renter tenant base. Strengths: cost of living A+, housing A+, crime B; Watch: employment D+, amenities F, commute F.
- Hardin County (suburban): math 30% / reading 43% proficiency, ranked #47 of 165 in KY (top 28%) — families likely to look elsewhere, expect single-tenant / working-renter base with shorter leases.
- Zoned schools: Creekside Elementary School (math 27% / reading 37%, grade F, #348 of 676 statewide, top 55%, 419 students, 51% FRL); East Hardin Middle School (math 33% / reading 56%, grade D, #36 of 217 statewide, top 18%, 780 students, 30% FRL); Central Hardin High School (math 36% / reading 51%, grade F, #28 of 254 statewide, top 11%, 1,914 students, 37% FRL) — zoned schools at 39% FRL track the district average.
- Market conditions: 18 active listings in the ZIP; 946 units permitted in Hardin County in 2024 (464 in 5+ unit buildings).
Forward outlook
- In year one you build about $1k of equity ($1k loan paydown + $-176 appreciation (-0.1% local appreciation)).
- Hardin County population projected at -16% by 2050 — secular population decline; favor cash flow + early exit over multi-decade hold.
- At projected returns (-0.1% appreciation + 3.0% rent growth), your $53k cash investment doubles in ~7 years — after that, you're playing with house money.
Negotiation context
- It's been on market 88 days — a 6% lower offer ($179k) is reasonable based on typical stale-listing flexibility.
Risks & watch-outs
- Climate carrying-cost: extreme-heat days projected 7→20/yr by 2055 (HVAC capex compounding) — expect insurance premiums to compound above CPI over the hold.
Questions for the listing agent
- It's been on market 88 days. Have you received any prior offers? Is the seller open to a 6% concession, seller financing, or rate buy-down credit?
- Why hasn't it sold? Are there any deal-killer items the seller is aware of (foundation, flood, title, zoning, code violations)?
- Is there a deadline driving the sale (1031 exchange, divorce, estate, relocation)? That informs how much negotiation room exists.
- Schools are D-rated, which usually means shorter tenancies and higher turnover. Who's the typical renter profile here, and what's been the actual vacancy rate?
- What's the average days-on-market for RENTAL listings here right now (not sales)? A rising rental-DOM trend means longer vacancies and softer asking-rent achievability than the comps imply.
- What's the recent tenant-quality profile in this submarket — average credit score on applications, eviction rate, late-payment / NSF rate, and stable-employment percentage? A property-management company in the area should have these aggregated.
- How much new for-sale + rental construction is in the pipeline within 1–3 miles? Heavy new supply typically softens prices + rents 12–24 months out; constrained supply supports both.
Investment metrics
- 1% rule
- 1.06% ✓
- Cap rate
- 9.16%
- Cash-on-cash
- 10.23%
- DSCR
- 1.46
- GRM
- 7.8
CMA / ARV
No comps found within radius.
Projected returns pro-forma
-0.09% appreciation · 3.0% rent growth · sell at horizon
- IRR
- 8.9%
- Equity multiple
- 1.42×
- Total profit
- $22,486
- Equity at exit
- $54,437
- IRR
- 13.9%
- Equity multiple
- 2.51×
- Total profit
- $80,633
- Equity at exit
- $64,739
Cash invested: $53,340 (down + closing). Projections, not guarantees.
Landlord ↔ Tenant lean methodology
- Overall (STATE)
- 83 Strongly Landlord-Friendly
- State Kentucky
- 83 Strongly Landlord-Friendly · R+16
- County
- — inherits STATE
- City
- — inherits STATE
ZIP-level market 42776
- Home prices YoY
- -0.0%
- Active inventory
- 18
- Price-to-rent
- 7.8×
Monthly cashflow live
- Estimated rent
- $2,028 medium interval (Pro) →
- Mortgage (P&I)
- −$999
- Tax from tax record
- −$69 /mo · $827/yr
- Insurance
- −$79
- HOA
- −$0
- Lot rent
- −$0
- Vacancy / Maint / Mgmt
- −$426
- Net cashflow
- $455
Break-even live
Sensitivity live
| Price | -10% $563 | -5% $509 | +0% $455 | +5% $401 | +10% $347 |
|---|---|---|---|---|---|
| Rent | -10% $294 | -5% $375 | +0% $455 | +5% $535 | +10% $615 |
| Rate | -1.0pp $551 | -0.5pp $503 | base $455 | +0.5pp $405 | +1.0pp $355 |
UW: 25.0% down · 7.5% · 30yr · 1.5% tax · 5.0% vac · 8.0% maint · 8.0% mgmt
Financing live
Cash to close
- Down payment
- $47,625
- Closing costs
- $5,715
- Reserves months
- —
- Total cash needed
- —
Loan-product check · same deal, 3 products live
Conventional
25% down · 7.5% · 30yr
- Down + closing
- —
- Monthly P&I
- —
- Monthly cashflow
- —
- DSCR
- —
- Eligible?
- —
Personal DTI + credit; lowest rate.
DSCR
20% down · 8.5% · 30yr
- Down + closing
- —
- Monthly P&I
- —
- Monthly cashflow
- —
- DSCR
- —
- Eligible?
- —
No personal income docs; deal must DSCR.
Hard money
10% down · 12.0% · 12mo
- Down + closing
- —
- Monthly P&I
- —
- Monthly cashflow
- —
- DSCR
- —
- Eligible?
- —
Short-term bridge; refi at stabilization.
Listing history 20 events
-
2026-06-23days on market $190,500 Active 88 DOM
-
2026-06-22days on market $190,500 Active 87 DOM
-
2026-06-19days on market $190,500 Active 85 DOM
-
2026-06-18days on market $190,500 Active 84 DOM
-
2026-06-17days on market $190,500 Active 83 DOM
-
2026-06-16days on market $190,500 Active 82 DOM
-
2026-06-15days on market $190,500 Active 81 DOM
-
2026-06-14days on market $190,500 Active 79 DOM
-
2026-06-13days on market $190,500 Active 78 DOM
-
2026-06-10days on market $190,500 Active 76 DOM
-
2026-06-09days on market $190,500 Active 75 DOM
-
2026-06-08days on market $190,500 Active 74 DOM
-
2026-06-07days on market $190,500 Active 73 DOM
-
2026-06-03days on market $190,500 Active 69 DOM
-
2026-06-02days on market $190,500 Active 68 DOM
-
2026-06-01days on market $190,500 Active 67 DOM
-
2026-05-31days on market $190,500 Active 66 DOM
-
2026-05-30days on market $190,500 Active 65 DOM
-
2026-05-04price $190,500
-
2026-03-26$192,500 Active
ⓘ Source: listings_history table (triggers on properties + properties_extension) + one-shot
backfill from property_details.listing_events for pre-trigger history.
Tax reassessment forecast KY · Resets to sale price
- Current annual tax
- $827 · $69/mo
- Projected year-2 tax
- $1,638 · $137/mo
- Expected delta
- +$812/yr (+$68/mo · 98.2%)
ⓘ Screening estimate from a state-policy table — verify with the county assessor before closing.
Climate risk First Street
- Flood 1/10 Low FEMA zone X (unshaded) · 0% chance over 30 yrs
- Wildfire 4/10 Moderate
- Heat 5/10 Major 7 d/yr ≥105°F today · 20 d/yr by 30 yrs out
- Wind 3/10 Moderate 6% chance of damaging wind over 30 yrs
- Air quality 1/10 Low 0 unhealthy d/yr today · 0 by 30 yrs out
Nearby sold comps map
Loading sold comps map…
Walkable amenities ~0.75 mi
Loading nearby amenities…
Taxation est. · year 1
- Rental income
- $24,333
- − Mortgage interest
- −$10,671
- − Property taxes
- −$827
- − Insurance
- −$952
- − Repairs & maintenance
- −$1,947
- − Management
- −$1,947
- − Depreciation
- −$5,542
- Taxable income
- $2,448
- Est. tax owed @ 24.0%
- −$587
- After-tax cash flow
- $4,868/yr
For passive investors: Depreciation is non-cash, so a rental often shows a tax loss while cash-flowing — sheltering income. Rental losses are passive: they offset passive income freely, and up to $25,000/yr can offset ordinary (W-2) income if you actively participate and your MAGI is under $100k (phasing out to $0 by $150k); unused losses carry forward. On sale, claimed depreciation is recaptured at up to 25%, and gains may owe capital-gains tax (a 1031 exchange can defer both). Figures are a year-1 estimate at your 24.0% rate — not tax advice; consult a CPA.
Schools (NCES district)
- District
- Hardin County
- NCES district ID
- 2102490
- Math proficiency
- 30% ▼ -13.00%
- Reading proficiency
- 43% ▼ -10.00%
- Median HH income
- $50,728
- Composite
- 31.61/100
- National rank
- #5945
- State rank
- #47 of 165 in KY
Livability — Sonora
- Score
- 62/100
- State rank
- #342
- US rank
- #16237
Category grades
Schools grade is shown separately in the Schools card above.
Census & demographics
- Census place
- Sonora, KY
- Population (ZIP)
- 2,071
Population outlook (Hardin County) Hauer SSP2
- Today (2025)
- 105,573 people
- By 2030
- 103,563 · -1.9%
- By 2040
- 97,077 · -8.0%
- By 2050
- 88,367 · -16.3%
- By 2075
- 65,405 · -38.0%
- By 2100
- 42,245 · -60.0%
Race, ethnicity, and origin ACS 2023
- Neighborhood character
- Predominantly White (96%)
- Race & ethnicity
- White 96% Two or more races 4%
- Common ancestry
- Serbian 1% Lithuanian 1% Portuguese 1%
- Foreign-born
- 0%
- Languages at home
- 96% English-only · German/W. Germanic 4% Spanish 1%
Political lean MEDSL · Hardin
- 2024 margin
- Strong R (+29.3) · D 34.5% · R 63.8% · Other 1.7%
- 2008→2024 swing
- -8.7pp toward R · 2008: -20.6pp · 2024: -29.3pp
- All cycles
- 2024: R+29.3 2020: R+24.0 2016: R+30.2 2012: R+20.8 2008: R+20.6
Not yet ingested
- Civics
- —
Market trends
- HPI YoY
- ▼ -0.09%
- Current HPI
- 334.9918
- Rent YoY
- —
- Metro
- —
- State GDP YoY
- ▲ 1.81%
- F500 in state
- 4
Industry mix (Fortune 500 HQ in KY)
| Industry | F500 HQs | Revenue |
|---|---|---|
| Healthcare | 1 | $118B |
|
||
| Food / Beverage | 1 | $7B |
|
||
Price history
-1.0% since first listed2 events — show timeline
- 2026-05-04 Price Changed $190,500 HKARMLS
- 2026-03-26 Listed $192,500 HKARMLS
Property tax history
+11.0%/yrLatest (2025): $827 · +1.4% YoY. Source: county tax records.
Cash-flow waterfall
monthlySold comps — $/sqft
last 12 mo · ≤1 miLoading sold comps…