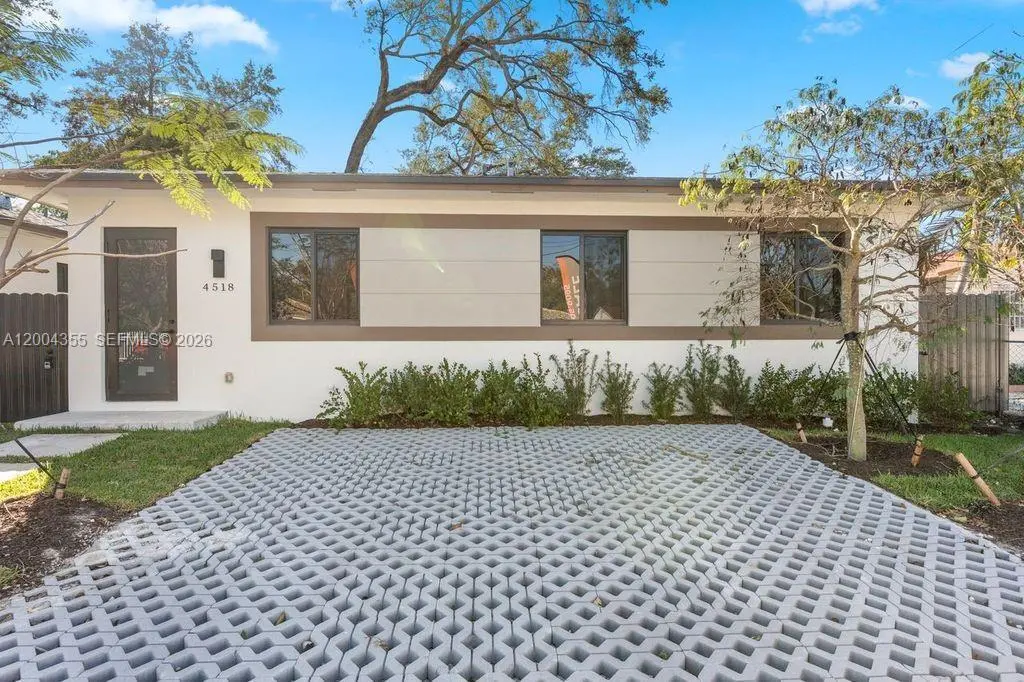
4518 NW 4 St · Miami, FL
Flood risk 1/10 · Minimal
- FEMA flood zone
- X (unshaded)
- Chance of flooding over 30 yrs
- 0.0%
- Est. flood insurance / yr
- $507 – $1,088
Fire risk 1/10 · Minimal
- Est. fire insurance / yr
- $947 – $1,759
Heat risk 10/10 · Severe
- Hot days now (above 105°F)
- 7 days/yr
- Hot days in 30 yrs
- 28 days/yr
Wind risk 10/10 · Severe
- Chance of severe wind over 30 yrs
- 99.0%
Air-quality risk 2/10 · Minimal
- Unhealthy air days now
- 1 days/yr
- Unhealthy air days in 30 yrs
- 1 days/yr
Risk factors via First Street. Map © Google.
Why this score? — see what drove the F grade
The composite is a weighted blend of 9 inputs, each scored 0–100. Each bar is that input's sub-score; the figure is the points it added to the 100-point composite (weight × sub-score).
- ARV discount +7.5/15.0
- Cash flow +4.9/30.0
- Schools +4.2/10.0
- Livability +3.9/5.0
- Condition / age +2.5/5.0
- Rent growth +1.4/5.0
- 1% rule +0.2/10.0
- DSCR +0.0/10.0
- Appreciation +0.0/10.0
$770,000
🖨 Deal sheet 📄 Offer letter ✓ Due diligence
Listing remarks
Discover this stunning new construction townhouse featuring 4 bedrooms and 3.5 bathrooms, designed with modern finishes and top-of-the-line appliances throughout. The open-concept layout is filled with natural light, creating a bright and inviting living space perfect for both relaxing and entertaining. Enjoy a private patio with a vibrant Miami feel, ideal for gatherings or unwinding after a long day. Conveniently located in the heart of Miami, just minutes from Miami International Airport, Brickell, Downtown, major highways, restaurants, and shopping. This property offers the perfect blend of style, comfort, and location—ideal for homeowners or investors looking for a prime opportun
Key facts
- 2 parking spots
- Built 2025
- Listed 58 days
Property features AI
Finance
- Financial info: Pets allowed with restrictions or possible restrictions
- HOA & community: Association fee covers common areas
Exterior
- Parking: Two or more parking spaces
- Security: Security/high-impact doors; Complex fenced
- Utilities: Has heating; Has cooling
- Home design: Attached property; Single-story; Under construction
- Construction: Block construction
- Exterior features: Fenced property; Patio; Security/high-impact doors; Complex is fenced
Interior
- Kitchen: Electric range; Dishwasher; Microwave; Garbage disposal; Refrigerator
- Bedrooms: Bedroom located on the main level
- Flooring: Laminate flooring
- Bathrooms: Three full bathrooms; One half bathroom
- Heating & cooling: Central heating; Central air conditioning
- Interior features: First-floor entry; Living/dining room; Tub with shower; Walk-in closets; Bedroom on main level
- Laundry & utility: Washer; Dryer
Neighborhood map
What this means for you Summary
Snapshot
- This is a 4-bed/3.5-bath land listed at $770k.
Deal economics
- At list price, monthly cash flow is $-2k ($-22k/yr) — negative.
- To cash-flow at today's rent, offer at most $441k (42.8% below list).
- To meet the 1% rule (rent ≥ 1% of price), the offer needs to be $404k (47.5% below list).
- Recommended offer: $404k (47.5% below list) — sets the bar for 1% rule.
- Cap rate 3.4% vs local median 1.9% in Miami — top-decile yield for the area; either an underpriced asset or a hidden risk that comps aren't pricing in. Stress-test before assuming the spread holds.
Location & tenants
- Location reads 78/100 on livability (#177 in FL, #2,724 nationally) — a middle-class / working-renter tenant base. Strengths: amenities A+, commute A+, health & safety A+; Watch: employment C-, crime F, cost of living F.
- Miami-Dade (suburban): math 45% / reading 54% proficiency, ranked #40 of 73 in FL (top 55%) — families likely to look elsewhere, expect single-tenant / working-renter base with shorter leases; 64% free/reduced lunch — lower-income household profile, screen leases tightly.
- Market conditions: Rents falling (-4.5%/yr); 196 active listings in the ZIP; 1 comparable units currently listed for rent nearby; 10,051 units permitted in Miami-Dade County in 2024 (7,758 in 5+ unit buildings).
- At $4,040/mo this rent would consume 83% of the median local household income ($58k/yr) (locally 3930% of renters already pay >50% of income on rent) — very limited rent-growth headroom before tenants either downsize or default.
Forward outlook
- Local home prices are declining (-3.0%/yr); year-one equity from $5k of loan paydown is wiped out by about $23k of value loss. Plan a longer hold.
- Miami-Dade County population projected at +28% by 2050 — long-run rental-demand tailwind backs the buy-and-hold thesis.
Negotiation context
- It's been on market 59 days — a 3% lower offer ($747k) is reasonable based on typical stale-listing flexibility.
- 8 sale attempts since 4y ago with the ask held roughly flat each time — persistent listings suggest the price (not the market) is what's stuck; bring a comps-based counter.
- Current owner paid $625k; 23% above their basis — modest negotiation headroom, anchor on the comps not their cost.
Risks & watch-outs
- Climate carrying-cost: severe wind risk, 99% chance of damaging wind over 30y; extreme-heat days projected 7→28/yr by 2055 (HVAC capex compounding) — expect insurance premiums to compound above CPI over the hold.
Questions for the listing agent
- What do current leases actually rent for vs. the listed asking? Can we see a recent rent roll and the last 12 months of T-12 income?
- It's been on market 59 days. Have you received any prior offers? Is the seller open to a 48% concession, seller financing, or rate buy-down credit?
- Is there a deadline driving the sale (1031 exchange, divorce, estate, relocation)? That informs how much negotiation room exists.
- Schools are B-rated — typically a magnet for longer-tenancy family renters. What's the average tenant stay here, and is there a school-zone premium baked into asking?
- Crime grade is F in this area — have there been break-ins, vandalism, or insurance claims at this property in the last 3 years? What carrier currently insures it and at what premium?
- The area grade is low — what's the realistic commute time and amenity access for the typical tenant pool here? Any planned neighborhood developments (good or bad) we should know about?
- What's the average days-on-market for RENTAL listings here right now (not sales)? A rising rental-DOM trend means longer vacancies and softer asking-rent achievability than the comps imply.
- What's the recent tenant-quality profile in this submarket — average credit score on applications, eviction rate, late-payment / NSF rate, and stable-employment percentage? A property-management company in the area should have these aggregated.
- How much new for-sale + rental construction is in the pipeline within 1–3 miles? Heavy new supply typically softens prices + rents 12–24 months out; constrained supply supports both.
Investment metrics
- 1% rule
- 0.52% ✗
- Cap rate
- 3.39%
- Cash-on-cash
- -10.38%
- DSCR
- 0.54
- GRM
- 15.9
CMA / ARV
No comps found within radius.
Projected returns pro-forma
-3.0% appreciation · 0.0% rent growth · sell at horizon
- IRR
- -38.1%
- Equity multiple
- -0.18×
- Total profit
- $-255,477
- Equity at exit
- $114,810
- IRR
- -77.9%
- Equity multiple
- -0.96×
- Total profit
- $-421,557
- Equity at exit
- $66,576
Cash invested: $215,600 (down + closing). Projections, not guarantees.
Landlord ↔ Tenant lean methodology
- Overall (STATE)
- 87 Strongly Landlord-Friendly
- State Florida
- 87 Strongly Landlord-Friendly · R+3
- County
- — inherits STATE
- City
- — inherits STATE
ZIP-level market 33126
- Rents YoY
- -4.5%
- Active inventory
- 196
- Price-to-rent
- 15.9×
Monthly cashflow live
- Estimated rent
- $4,040 medium interval (Pro) →
- Mortgage (P&I)
- −$4,038
- Tax from tax record
- −$697 /mo · $8,367/yr
- Insurance
- −$321
- HOA
- −$0
- Vacancy / Maint / Mgmt
- −$848
- Net cashflow
- $-1,865
Break-even live
UW: 25.0% down · 7.5% · 30yr · 1.5% tax · 5.0% vac · 8.0% maint · 8.0% mgmt
Financing live
Cash to close
- Down payment
- $192,500
- Closing costs
- $23,100
- Reserves months
- —
- Total cash needed
- —
Loan-product check · same deal, 3 products live
Conventional
25% down · 7.5% · 30yr
- Down + closing
- —
- Monthly P&I
- —
- Monthly cashflow
- —
- DSCR
- —
- Eligible?
- —
Personal DTI + credit; lowest rate.
DSCR
20% down · 8.5% · 30yr
- Down + closing
- —
- Monthly P&I
- —
- Monthly cashflow
- —
- DSCR
- —
- Eligible?
- —
No personal income docs; deal must DSCR.
Hard money
10% down · 12.0% · 12mo
- Down + closing
- —
- Monthly P&I
- —
- Monthly cashflow
- —
- DSCR
- —
- Eligible?
- —
Short-term bridge; refi at stabilization.
Rent comps 1 comps
| Address | Beds | Baths | Sqft | Rent | $/sqft | DOM | Units | Dist |
|---|---|---|---|---|---|---|---|---|
| 3905 SW 5th St Coral Gables, FL | 4.0 | 4.5 | 2998 | $20,000 | $6.67 | 24d | 1 | 0.79mi |
Listing history 34 events
-
2026-06-18days on market $770,000 Active 59 DOM
-
2026-06-17days on market $770,000 Active 58 DOM
-
2026-06-16days on market $770,000 Active 57 DOM
-
2026-06-15days on market $770,000 Active 56 DOM
-
2026-06-13days on market $770,000 Active 54 DOM
-
2026-06-09days on market $770,000 Active 50 DOM
-
2026-06-08days on market $770,000 Active 49 DOM
-
2026-06-07days on market $770,000 Active 48 DOM
-
2026-06-04days on market $770,000 Active 45 DOM
-
2026-06-03days on market $770,000 Active 44 DOM
-
2026-06-02days on market $770,000 Active 43 DOM
-
2026-06-01days on market $770,000 Active 42 DOM
-
2026-05-31days on market $770,000 Active 41 DOM
-
2026-04-21historical
-
2026-04-14$770,000 Active
-
2026-04-14$770,000 Active
-
2026-03-10historical
-
2025-09-09$764,000 Active
-
2025-09-08historical
-
2025-01-13$770,000 Active
-
2025-01-13historical
-
2024-11-19price $770,000
-
2024-03-16$750,000 Active
-
2024-03-12historical
-
2023-12-07soldstatus $625,000 Closed
-
2023-08-31status Pending
-
2023-06-30historical Active Under Contract
-
2023-05-04price $679,000
-
2023-03-21price $749,000
-
2023-02-15$799,900 Active
-
2022-12-06historical
-
2022-11-02historical
-
2022-10-19$410,000 Active
-
2022-10-17$410,000 Active
ⓘ Source: listings_history table (triggers on properties + properties_extension) + one-shot
backfill from property_details.listing_events for pre-trigger history.
Tax reassessment forecast FL · Resets to sale price
- Current annual tax
- $8,367 · $697/mo
- Projected year-2 tax
- $8,367 · $697/mo
- Expected delta
- $0/yr ($0/mo · 0.0%)
ⓘ Screening estimate from a state-policy table — verify with the county assessor before closing.
Climate risk First Street
- Flood 1/10 Low FEMA zone X (unshaded) · 0% chance over 30 yrs
- Wildfire 1/10 Low
- Heat 10/10 Extreme 7 d/yr ≥105°F today · 28 d/yr by 30 yrs out
- Wind 10/10 Extreme 99% chance of damaging wind over 30 yrs
- Air quality 2/10 Low 1 unhealthy d/yr today · 1 by 30 yrs out
Nearby sold comps map
Loading sold comps map…
Walkable amenities ~0.75 mi
Loading nearby amenities…
Taxation est. · year 1
- Rental income
- $48,476
- − Mortgage interest
- −$43,132
- − Property taxes
- −$8,367
- − Insurance
- −$3,850
- − Repairs & maintenance
- −$3,878
- − Management
- −$3,878
- − Depreciation
- −$22,400
- Taxable loss
- −$37,029
- Est. tax savings @ 24.0%
- +$8,887
- After-tax cash flow
- $-13,489/yr
For passive investors: Depreciation is non-cash, so a rental often shows a tax loss while cash-flowing — sheltering income. Rental losses are passive: they offset passive income freely, and up to $25,000/yr can offset ordinary (W-2) income if you actively participate and your MAGI is under $100k (phasing out to $0 by $150k); unused losses carry forward. On sale, claimed depreciation is recaptured at up to 25%, and gains may owe capital-gains tax (a 1031 exchange can defer both). Figures are a year-1 estimate at your 24.0% rate — not tax advice; consult a CPA.
Schools (NCES district)
- District
- Miami-Dade
- NCES district ID
- 1200390
- Math proficiency
- 45% ▼ -16.00%
- Reading proficiency
- 54% ▼ -5.00%
- Median HH income
- $43,928
- Composite
- 41.76/100
- National rank
- #3397
- State rank
- #40 of 73 in FL
Livability — Miami
- Score
- 78/100
- State rank
- #177
- US rank
- #2724
Category grades
Schools grade is shown separately in the Schools card above.
Census & demographics
- Census place
- Miami, FL
- County
- Miami-Dade County · 2,697,751 people
- City population
- 827,308
- Metro
- Miami-Fort Lauderdale-Pompano Beach, FL
- Population (ZIP)
- 47,307
- Household income
- $58,210
- Rent vs Own
- Severe rent burden
- 3930.0
Population outlook (Miami-Dade County) Hauer SSP2
- Today (2025)
- 3,126,439 people
- By 2030
- 3,325,765 · +6.4%
- By 2040
- 3,697,561 · +18.3%
- By 2050
- 4,012,134 · +28.3%
- By 2075
- 4,605,612 · +47.3%
- By 2100
- 4,866,598 · +55.7%
Race, ethnicity, and origin ACS 2023
- Neighborhood character
- Predominantly Hispanic (95%)
- Race & ethnicity
- Hispanic / Latino 95% Two or more races 50% White 3%
- Hispanic origin (detail)
- Mexican 1% Puerto Rican 2% Cuban 60% Dominican 2%
- Foreign-born
- 76% · Canada, Jamaica, Guatemala
- Languages at home
- 8% English-only · Spanish 91%
Political lean MEDSL · Miami-Dade
- 2024 margin
- R (+11.4) · D 43.9% · R 55.4%
- 2008→2024 swing
- -27.6pp toward R · 2008: 16.1pp · 2024: -11.4pp
- All cycles
- 2024: R+11.4 2020: D+7.3 2016: D+29.6 2012: D+23.7 2008: D+16.1
Not yet ingested
- Civics
- —
Market trends
- HPI YoY
- ▼ -343.54%
- Current HPI
- 318.6854
- Rent YoY
- ▼ -4.50%
- Metro
- Miami-Fort Lauderdale-Pompano Beach, FL
- State GDP YoY
- ▲ 3.28%
- F500 in state
- 36
Industry mix (Fortune 500 HQ in FL)
| Industry | F500 HQs | Revenue |
|---|---|---|
| Industrial Technology | 2 | $29B |
|
||
| Insurance | 2 | $17B |
|
||
| Retail | 1 | $60B |
|
||
| Technology Distribution | 1 | $58B |
|
||
| Homebuilding | 1 | $35B |
|
||
| Technology Manufacturing | 1 | $35B |
|
||
Price history
+87.8% since first listed21 events — show timeline
- 2026-04-21 Listing Removed — MARMLS
- 2026-04-14 Listed $770,000 MARMLS
- 2026-04-14 Listed $770,000 MARMLS
- 2026-03-10 Listing Removed — MARMLS
- 2025-09-09 Listed $764,000 MARMLS
- 2025-09-08 Listing Removed — MARMLS
- 2025-01-13 Listing Removed — MARMLS
- 2025-01-13 Listed $770,000 MARMLS
- 2024-11-19 Price Changed $770,000 MARMLS
- 2024-03-16 Listed $750,000 MARMLS
- 2024-03-12 Coming Soon — MARMLS
- 2023-12-07 Sold (MLS) $625,000 MARMLS
- 2023-08-31 Pending — MARMLS
- 2023-06-30 Contingent — MARMLS
- 2023-05-04 Price Changed $679,000 MARMLS
- 2023-03-21 Price Changed $749,000 MARMLS
- 2023-02-15 Listed $799,900 MARMLS
- 2022-12-06 Listing Removed — MARMLS
- 2022-11-02 Listing Removed — MARMLS
- 2022-10-19 Listed $410,000 MARMLS
- 2022-10-17 Listed $410,000 MARMLS
Property tax history
+12.9%/yrLatest (2025): $8,367 · +3.6% YoY. Source: county tax records.
Cash-flow waterfall
monthlySold comps — $/sqft
last 12 mo · ≤1 miLoading sold comps…