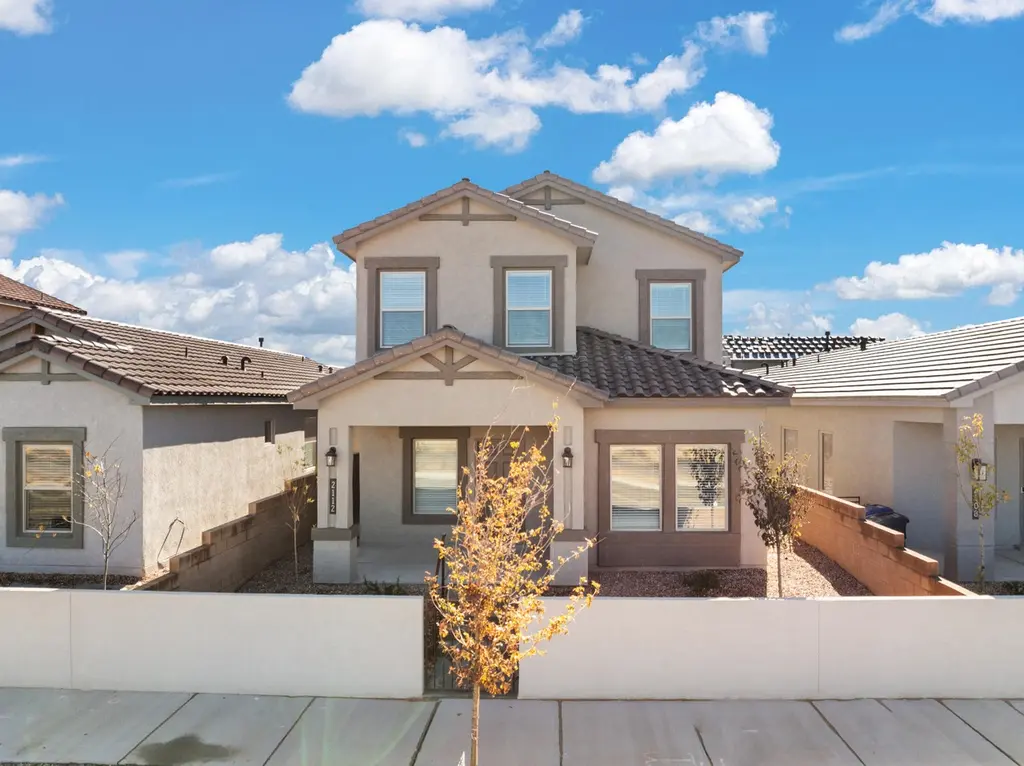
6118 Chicago Dr SE · Albuquerque, NM
Flood risk No data
- FEMA flood zone
- —
- Chance of flooding over 30 yrs
- —
- Est. flood insurance / yr
- —
Fire risk No data
- Est. fire insurance / yr
- —
Heat risk No data
- Hot days now (above threshold)
- —
- Hot days in 30 yrs
- —
Wind risk No data
- Chance of severe wind over 30 yrs
- —
Air-quality risk No data
- Unhealthy air days now
- —
- Unhealthy air days in 30 yrs
- —
Risk factors via First Street. Map © Google.
Why this score? — see what drove the D- grade
The composite is a weighted blend of 9 inputs, each scored 0–100. Each bar is that input's sub-score; the figure is the points it added to the 100-point composite (weight × sub-score).
- ARV discount +13.1/15.0
- Cash flow +7.4/30.0
- Schools +5.3/10.0
- Livability +3.6/5.0
- Rent growth +2.6/5.0
- Condition / age +2.5/5.0
- 1% rule +2.3/10.0
- DSCR +1.6/10.0
- Appreciation +0.0/10.0
$389,990
🖨 Deal sheet 📄 Offer letter ✓ Due diligence
Listing remarks MLS
The property is located at 6118 Chicago Dr SE ALBUQUERQUE NM 87106 priced at 399990, the square foot and stories are 1850, 2.The number of bath is 2, halfbath is 1 there are 3 bedrooms and 2 garages. For more details please, call or email.
Key facts
- 4,400 sq ft lot
- 2 garage spots
- Built 2026
Neighborhood map
What this means for you Summary
Snapshot
- This is a 3-bed/3.0-bath single-family listed at $390k.
Deal economics
- At list price, monthly cash flow is $-501 ($-6k/yr) — negative.
- To cash-flow at today's rent, offer at most $318k (18.6% below list).
- To meet the 1% rule (rent ≥ 1% of price), the offer needs to be $286k (26.7% below list).
- Recommended offer: $286k (26.7% below list) — sets the bar for 1% rule.
- Cap rate 4.8% vs local median 3.7% in Albuquerque — meaningfully above typical; check what's discounted (condition, days-on-market, listing class) to confirm the premium yield is real.
Location & tenants
- Location reads 72/100 on livability (#13 in NM) — a middle-class / working-renter tenant base. Strengths: amenities A+, commute A+, cost of living A+; Watch: schools D-, crime F.
- Albuquerque Public Schools (urban): math 51% / reading 75% proficiency, ranked #3 of 29 in NM (top 10%) — acceptable for families but not a draw, mixed tenant base, ~2y average lease; 60% free/reduced lunch — lower-income household profile, screen leases tightly.
- Market conditions: Rents flat; 183 active listings in the ZIP; 6 comparable units currently listed for rent nearby; rentals leasing fast (median 12d on market — plan ~1-2 weeks tenant-placement turnaround); 1,316 units permitted in Bernalillo County in 2024 (546 in 5+ unit buildings).
- At $2,857/mo this rent would consume 69% of the median local household income ($50k/yr) (locally 2859% of renters already pay >50% of income on rent) — very limited rent-growth headroom before tenants either downsize or default.
Forward outlook
- Local home prices are declining (-3.0%/yr); year-one equity from $3k of loan paydown is wiped out by about $12k of value loss. Plan a longer hold.
Negotiation context
- It's been on market 64 days — a 6% lower offer ($367k) is reasonable based on typical stale-listing flexibility.
- 2 sale attempts; this cycle's ask has dropped $30k (7%) from the opening price — seller is motivated, your offer sets the floor, not the list.
Questions for the listing agent
- What do current leases actually rent for vs. the listed asking? Can we see a recent rent roll and the last 12 months of T-12 income?
- It's been on market 64 days. Have you received any prior offers? Is the seller open to a 27% concession, seller financing, or rate buy-down credit?
- What does the HOA fee cover, when was the last increase, and are there any pending special assessments or reserve-fund shortfalls?
- Why hasn't it sold? Are there any deal-killer items the seller is aware of (foundation, flood, title, zoning, code violations)?
- Is there a deadline driving the sale (1031 exchange, divorce, estate, relocation)? That informs how much negotiation room exists.
- Schools are D-rated, which usually means shorter tenancies and higher turnover. Who's the typical renter profile here, and what's been the actual vacancy rate?
- Crime grade is F in this area — have there been break-ins, vandalism, or insurance claims at this property in the last 3 years? What carrier currently insures it and at what premium?
- The area grade is low — what's the realistic commute time and amenity access for the typical tenant pool here? Any planned neighborhood developments (good or bad) we should know about?
- What's the average days-on-market for RENTAL listings here right now (not sales)? A rising rental-DOM trend means longer vacancies and softer asking-rent achievability than the comps imply.
- What's the recent tenant-quality profile in this submarket — average credit score on applications, eviction rate, late-payment / NSF rate, and stable-employment percentage? A property-management company in the area should have these aggregated.
- How much new for-sale + rental construction is in the pipeline within 1–3 miles? Heavy new supply typically softens prices + rents 12–24 months out; constrained supply supports both.
Investment metrics
- 1% rule
- 0.73% ✗
- Cap rate
- 4.75%
- Cash-on-cash
- -5.50%
- DSCR
- 0.76
- GRM
- 11.4
CMA / ARV
- ARV (median comp)
- $445,618
- List price
- $389,990
- Delta
- -12.48%
- Verdict
- UNDERPRICED
- Comps
- 20 within 1.0 mi
Show comp detail 12 sales within ~0.75 mi
| Address | Dist | Beds/Ba | Sqft | Sold | Price | $/sf | Match |
|---|---|---|---|---|---|---|---|
| 1924 Gorman Ave SE | 0.03mi | 3/3.0 | 1,787 (-3%) | 2mo | $439,990 | $246 | 91 |
| 1914 Houser Ave SE | 0.07mi | 3/2.0 | 1,975 (+7%) | 1mo | $499,995 | $253 | 81 |
| 6024 Nauman Dr SE | 0.32mi | 3/2.0 | 1,870 (+1%) | 1mo | $419,000 | $224 | 78 |
| 6028 Hardin Dr SE | 0.25mi | 3/2.0 | 1,802 (-3%) | 4mo | $520,000 | $289 | 77 |
| 2128 Bobby Foster Rd SE | 0.55mi | 3/3.0 | 1,850 (0%) | 3mo | $379,990 | $205 | 72 |
| 1918 Gorman Ave SE | 0.03mi | 3/2.0 | 1,628 (-12%) | 4mo | $389,990 | $240 | 72 |
| 6026 Chicago Rd SE | 0.17mi | 4/2.0 (+1) | 1,950 (+5%) | 4mo | $469,995 | $241 | 71 |
| 6124 Chicago Dr SE | 0.02mi | 4/2.5 (+1) | 2,079 (+12%) | 1mo | $419,990 | $202 | 70 |
| 5763 University Blvd SE | 0.62mi | 3/2.0 | 1,841 (-0%) | 1mo | $417,500 | $227 | 65 |
| 5632 Sagan Loop SE | 0.49mi | 3/2.0 | 1,930 (+4%) | 1mo | $400,000 | $207 | 65 |
| 2404 De Kooning Ave SE | 0.33mi | 3/2.5 | 2,046 (+11%) | 2mo | $485,614 | $237 | 63 |
| 2119 Stieglitz Ave SE | 0.41mi | 4/2.5 (+1) | 2,079 (+12%) | 4mo | $409,990 | $197 | 50 |
Match score weights: distance 35% · size 25% · config 20% · recency 20%. Top-matched comps best support the ARV.
Projected returns pro-forma
-3.0% appreciation · 0.5% rent growth · sell at horizon
- IRR
- -28.6%
- Equity multiple
- 0.07×
- Total profit
- $-102,027
- Equity at exit
- $58,149
- IRR
- -42.0%
- Equity multiple
- -0.44×
- Total profit
- $-156,958
- Equity at exit
- $33,719
Cash invested: $109,197 (down + closing). Projections, not guarantees.
Landlord ↔ Tenant lean methodology
- Overall (STATE)
- 55 Moderately Landlord-Leaning
- State New Mexico
- 55 Moderately Landlord-Leaning · D+3
- County
- — inherits STATE
- City
- — inherits STATE
ZIP-level market 87106
- Rents YoY
- 0.5%
- Active inventory
- 183
- Price-to-rent
- 11.4×
Monthly cashflow live
- Estimated rent
- $2,857 high interval (Pro) →
- Mortgage (P&I)
- −$2,045
- Tax est. 1.5%
- −$487 /mo · $5,850/yr
- Insurance
- −$162
- HOA
- −$63
- Vacancy / Maint / Mgmt
- −$600
- Net cashflow
- $-501
Break-even live
UW: 25.0% down · 7.5% · 30yr · 1.5% tax · 5.0% vac · 8.0% maint · 8.0% mgmt
Financing live
Cash to close
- Down payment
- $97,498
- Closing costs
- $11,700
- Reserves months
- —
- Total cash needed
- —
Loan-product check · same deal, 3 products live
Conventional
25% down · 7.5% · 30yr
- Down + closing
- —
- Monthly P&I
- —
- Monthly cashflow
- —
- DSCR
- —
- Eligible?
- —
Personal DTI + credit; lowest rate.
DSCR
20% down · 8.5% · 30yr
- Down + closing
- —
- Monthly P&I
- —
- Monthly cashflow
- —
- DSCR
- —
- Eligible?
- —
No personal income docs; deal must DSCR.
Hard money
10% down · 12.0% · 12mo
- Down + closing
- —
- Monthly P&I
- —
- Monthly cashflow
- —
- DSCR
- —
- Eligible?
- —
Short-term bridge; refi at stabilization.
Rent comps 6 comps
| Address | Beds | Baths | Sqft | Rent | $/sqft | DOM | Units | Dist |
|---|---|---|---|---|---|---|---|---|
| 6057 Nauman Dr Albuquerque, NM | 4.0 | 2.0 | 2114 | $4,600 | $2.18 | 2d | 1 | 0.24mi |
| 1913 Pena Ave SE Albuquerque, NM | 4.0 | 2.0 | 1707 | $2,950 | $1.73 | 11d | 1 | 0.27mi |
| 1905 Pena Ave SE Albuquerque, NM | 3.0 | 2.0 | 1433 | $2,700 | $1.88 | 11d | 1 | 0.27mi |
| 6119 Motherwell Dr SE Albuquerque, NM | 3.0 | 2.5 | 2080 | $2,250 | $1.08 | 2d | 1 | 0.36mi |
| 2327 Stieglitz Ave SE Albuquerque, NM | 3.0 | 2.5 | 2411 | $5,000 | $2.07 | 2d | 1 | 0.44mi |
| 5608 Arbus Dr SE Albuquerque, NM | 3.0 | 2.0 | 1402 | $2,200 | $1.57 | 21d | 1 | 0.57mi |
HOA detail
- Monthly dues
- $63 · $756/yr
Listing history 19 events
-
2026-06-18days on market $389,990 Active 64 DOM
-
2026-06-17days on market $389,990 Active 63 DOM
-
2026-06-16days on market $389,990 Active 62 DOM
-
2026-06-15days on market $389,990 Active 61 DOM
-
2026-06-13days on market $389,990 Active 59 DOM
-
2026-06-10days on market $389,990 Active 56 DOM
-
2026-06-09days on market $389,990 Active 55 DOM
-
2026-06-08days on market $389,990 Active 54 DOM
-
2026-06-07days on market $389,990 Active 53 DOM
-
2026-06-05days on market $389,990 Active 50 DOM
-
2026-06-03days on market $389,990 Active 49 DOM
-
2026-06-02pricedays on market $389,990 Active 48 DOM
-
2026-06-01days on market $394,990 Active 47 DOM
-
2026-05-31days on market $394,990 Active 46 DOM
-
2026-05-01price $399,990 239-char remark
Show marketing remark (239 chars)
The property is located at 6118 Chicago Dr SE ALBUQUERQUE NM 87106 priced at 399990, the square foot and stories are 1850, 2.The number of bath is 2, halfbath is 1 there are 3 bedrooms and 2 garages. For more details please, call or email.
-
2026-04-29price $399,990 522-char remark
Show marketing remark (522 chars)
The Lemongrass at Mesa Del Sol offers a thoughtfully designed two-story, alley loaded home that blends modern style with everyday functionality. This floor plan features 3 spacious bedrooms, 2.5 bathrooms, and a versatile upstairs loft. The main level showcases an open concept living, dining, and kitchen space - designed for easy entertaining and comfortable daily living. Primary bedroom is located on the main level with primary bath and 1/2 bath. Second level will have the other 2 bedrooms and another full bathroom.
-
2026-04-17price $419,990 239-char remark
Show marketing remark (239 chars)
The property is located at 6118 Chicago Dr SE ALBUQUERQUE NM 87106 priced at 399990, the square foot and stories are 1850, 2.The number of bath is 2, halfbath is 1 there are 3 bedrooms and 2 garages. For more details please, call or email.
-
2026-04-14$419,990 Active 522-char remark
Show marketing remark (522 chars)
The Lemongrass at Mesa Del Sol offers a thoughtfully designed two-story, alley loaded home that blends modern style with everyday functionality. This floor plan features 3 spacious bedrooms, 2.5 bathrooms, and a versatile upstairs loft. The main level showcases an open concept living, dining, and kitchen space - designed for easy entertaining and comfortable daily living. Primary bedroom is located on the main level with primary bath and 1/2 bath. Second level will have the other 2 bedrooms and another full bathroom.
-
2026-01-07$428,990 Active 239-char remark
Show marketing remark (239 chars)
The property is located at 6118 Chicago Dr SE ALBUQUERQUE NM 87106 priced at 399990, the square foot and stories are 1850, 2.The number of bath is 2, halfbath is 1 there are 3 bedrooms and 2 garages. For more details please, call or email.
ⓘ Source: listings_history table (triggers on properties + properties_extension) + one-shot
backfill from property_details.listing_events for pre-trigger history.
Nearby sold comps map
Loading sold comps map…
Walkable amenities ~0.75 mi
Loading nearby amenities…
Taxation est. · year 1
- Rental income
- $34,287
- − Mortgage interest
- −$21,846
- − Property taxes
- −$5,850
- − Insurance
- −$1,950
- − Repairs & maintenance
- −$2,743
- − Management
- −$2,743
- − HOA
- −$756
- − Depreciation
- −$11,345
- Taxable loss
- −$12,945
- Est. tax savings @ 24.0%
- +$3,107
- After-tax cash flow
- $-2,904/yr
For passive investors: Depreciation is non-cash, so a rental often shows a tax loss while cash-flowing — sheltering income. Rental losses are passive: they offset passive income freely, and up to $25,000/yr can offset ordinary (W-2) income if you actively participate and your MAGI is under $100k (phasing out to $0 by $150k); unused losses carry forward. On sale, claimed depreciation is recaptured at up to 25%, and gains may owe capital-gains tax (a 1031 exchange can defer both). Figures are a year-1 estimate at your 24.0% rate — not tax advice; consult a CPA.
Schools (NCES district)
- District
- Albuquerque Public Schools
- NCES district ID
- 3500060
- Math proficiency
- 51% ▲ 30.00%
- Reading proficiency
- 75% ▲ 45.00%
- Median HH income
- $48,151
- Composite
- 53.29/100
- National rank
- #1487
- State rank
- #3 of 29 in NM
Livability — Albuquerque
- Score
- 72/100
- State rank
- #13
- US rank
- #6219
Category grades
Schools grade is shown separately in the Schools card above.
Census & demographics
- Census place
- Albuquerque, NM
- County
- Bernalillo County · 647,165 people
- City population
- 647,165
- Metro
- Albuquerque, NM
- Population (ZIP)
- 26,953
- Household income
- $49,781
- Rent vs Own
- Severe rent burden
- 2859.0
Population outlook (Bernalillo County) Hauer SSP2
- Today (2025)
- 704,528 people
- By 2030
- 711,723 · +1.0%
- By 2040
- 714,522 · +1.4%
- By 2050
- 709,274 · +0.7%
- By 2075
- 680,015 · -3.5%
- By 2100
- 619,879 · -12.0%
Race, ethnicity, and origin ACS 2023
- Neighborhood character
- Diverse neighborhood (Simpson 0.64)
- Race & ethnicity
- White 46% Hispanic / Latino 39% Two or more races 16% Native American 5% Asian 4% Black 3%
- Hispanic origin (detail)
- Mexican 24%
- Common ancestry
- Lithuanian 2% Slovak 2% Iranian 2%
- Foreign-born
- 12% · Canada, Vietnam, China
- Languages at home
- 77% English-only · Spanish 15% Other Indo-European 1% Vietnamese 1%
Political lean MEDSL · Bernalillo
- 2024 margin
- Strong D (+21.0) · D 59.2% · R 38.2% · Other 2.6%
- 2008→2024 swing
- -0.3pp no change · 2008: 21.4pp · 2024: 21.0pp
- All cycles
- 2024: D+21.0 2020: D+24.4 2016: D+17.8 2012: D+16.2 2008: D+21.4
Not yet ingested
- Civics
- —
Market trends
- HPI YoY
- ▼ -420.04%
- Current HPI
- 245.4275
- Rent YoY
- ▲ 0.50%
- Metro
- Albuquerque, NM
- State GDP YoY
- —
- F500 in state
- 0
Price history
-6.8% since first listed5 events — show timeline
- 2026-05-01 Price Changed $399,990 Zillow
- 2026-04-29 Price Changed $399,990 Southwest MLS
- 2026-04-17 Price Changed $419,990 Zillow
- 2026-04-14 Listed $419,990 Southwest MLS
- 2026-01-07 Listed $428,990 Zillow
Cash-flow waterfall
monthlySold comps — $/sqft
last 12 mo · ≤1 miLoading sold comps…