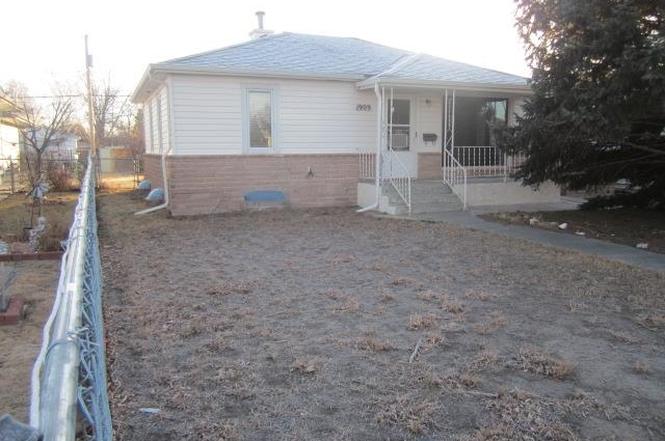
1909 E D St. St · Torrington, WY
Flood risk 1/10 · Minimal
- FEMA flood zone
- X (unshaded)
- Chance of flooding over 30 yrs
- 0.0%
- Est. flood insurance / yr
- $473 – $860
Fire risk 4/10 · Minor
- Est. fire insurance / yr
- $564 – $1,046
Heat risk 3/10 · Minor
- Hot days now (above 94°F)
- 7 days/yr
- Hot days in 30 yrs
- 20 days/yr
Wind risk 1/10 · Minimal
- Chance of severe wind over 30 yrs
- —
Air-quality risk 2/10 · Minimal
- Unhealthy air days now
- 1 days/yr
- Unhealthy air days in 30 yrs
- 2 days/yr
Risk factors via First Street. Map © Google.
Why this score? — see what drove the D+ grade
The composite is a weighted blend of 9 inputs, each scored 0–100. Each bar is that input's sub-score; the figure is the points it added to the 100-point composite (weight × sub-score).
- ARV discount +15.0/15.0
- Cash flow +12.5/30.0
- Schools +4.3/10.0
- DSCR +3.7/10.0
- Livability +3.4/5.0
- 1% rule +2.7/10.0
- Rent growth +2.5/5.0
- Condition / age +2.5/5.0
- Appreciation +0.0/10.0
$137,600
🖨 Deal sheet 📄 Offer letter ✓ Due diligence
Listing remarks MLS
Nice clean 4 bedroom, 2 bath house. Solid oak floors through out upstairs. Built in china hutch. Nice big picture window in living room. New plumbing. Updated bathroom downstairs. 18 x 24 attached garage with a 10 x 7 door with opener. Has manual underground sprinklers. 9 x 12 metal storage shed.
Key facts
- Heart of torrington
- Close to schools
- Ranch style home
Tags
Property features AI
Exterior
- Parking: Attached 2-car garage
- Utilities: Public water; Public sewer; Natural gas available
- Home design: Single family residence; Residential property
- Construction: Brick and vinyl siding; Composition roof
- Exterior features: Shed(s)
Interior
- Kitchen: Dishwasher; Range / Oven; Refrigerator
- Flooring: Hardwood
- Heating & cooling: Forced air heating
- Interior features: Full basement; Covered patio
- Laundry & utility: Washer; Dryer
Neighborhood map
What this means for you Summary
Snapshot
- This is a 2-bed/1.5-bath single-family listed at $138k.
Deal economics
- At list price, monthly cash flow is $-21 ($-250/yr) — negative.
- To cash-flow at today's rent, offer at most $134k (2.7% below list).
- To meet the 1% rule (rent ≥ 1% of price), the offer needs to be $106k (23.3% below list).
- Recommended offer: $106k (23.3% below list) — sets the bar for 1% rule.
- Cap rate 6.1% vs local median 3.7% in Torrington — top-decile yield for the area; either an underpriced asset or a hidden risk that comps aren't pricing in. Stress-test before assuming the spread holds.
Location & tenants
- Location reads 67/100 on livability (#66 in WY) — a middle-class / working-renter tenant base. Strengths: cost of living A+, housing A+; Watch: schools C-, health & safety C-, crime D+.
- Goshen County School District #1 (town): math 45% / reading 57% proficiency, ranked #28 of 41 in WY (top 68%) — acceptable for families but not a draw, mixed tenant base, ~2y average lease.
- Market conditions: 81 active listings in the ZIP; 3 units permitted in Goshen County in 2024 (0 in 5+ unit buildings).
Forward outlook
- Local home prices are declining (-3.0%/yr); year-one equity from $951 of loan paydown is wiped out by about $4k of value loss. Plan a longer hold.
- Goshen County population projected at +12% by 2050 — modest demand growth; plan on rents tracking national, not racing it.
Negotiation context
- It's been on market 80 days — a 6% lower offer ($129k) is reasonable based on typical stale-listing flexibility.
- 2 sale attempts since 3y ago; this cycle's ask has dropped $34k (20%) from the opening price — seller is motivated, your offer sets the floor, not the list.
Risks & watch-outs
- Watch-outs: built in 1951 — expect roof / HVAC / electrical / plumbing capex.
Questions for the listing agent
- What do current leases actually rent for vs. the listed asking? Can we see a recent rent roll and the last 12 months of T-12 income?
- It's been on market 80 days. Have you received any prior offers? Is the seller open to a 23% concession, seller financing, or rate buy-down credit?
- Built in 1951 — when were the roof, HVAC, electrical panel, plumbing, and water heater last replaced?
- Why hasn't it sold? Are there any deal-killer items the seller is aware of (foundation, flood, title, zoning, code violations)?
- Is there a deadline driving the sale (1031 exchange, divorce, estate, relocation)? That informs how much negotiation room exists.
- Crime grade is D in this area — have there been break-ins, vandalism, or insurance claims at this property in the last 3 years? What carrier currently insures it and at what premium?
- The area grade is low — what's the realistic commute time and amenity access for the typical tenant pool here? Any planned neighborhood developments (good or bad) we should know about?
- What's the average days-on-market for RENTAL listings here right now (not sales)? A rising rental-DOM trend means longer vacancies and softer asking-rent achievability than the comps imply.
- What's the recent tenant-quality profile in this submarket — average credit score on applications, eviction rate, late-payment / NSF rate, and stable-employment percentage? A property-management company in the area should have these aggregated.
- How much new for-sale + rental construction is in the pipeline within 1–3 miles? Heavy new supply typically softens prices + rents 12–24 months out; constrained supply supports both.
Investment metrics
- 1% rule
- 0.77% ✗
- Cap rate
- 6.11%
- Cash-on-cash
- -0.65%
- DSCR
- 0.97
- GRM
- 10.9
CMA / ARV
- ARV (on-the-fly)
- $177,408
- Comps found
- 12
Show comp detail 12 sales within ~0.75 mi
| Address | Dist | Beds/Ba | Sqft | Sold | Price | $/sf | Match |
|---|---|---|---|---|---|---|---|
| 2210 E E St | 0.21mi | 2/1.0 | 1,568 (-1%) | 1mo | $175,000 | $112 | 86 |
| 1941 E B St | 0.13mi | 3/2.0 (+1) | 1,632 (+3%) | 4mo | $159,999 | $98 | 79 |
| 2142 E F St | 0.21mi | 2/1.8 | 1,432 (-10%) | 7mo | $189,000 | $132 | 68 |
| 1818 East J St | 0.36mi | 3/2.0 (+1) | 1,550 (-2%) | 8mo | $300,000 | $194 | 66 |
| 1582 W A St | 0.39mi | 2/1.0 | 1,520 (-4%) | 10mo | $58,000 | $38 | 65 |
| 418 W 15th Ave | 0.60mi | 2/1.0 | 1,569 (-1%) | 9mo | $160,000 | $102 | 61 |
| 526 E 25th Ave | 0.40mi | 3/2.0 (+1) | 1,505 (-5%) | 12mo | $169,000 | $112 | 56 |
| 2542 E B St | 0.48mi | 3/2.0 (+1) | 1,728 (+9%) | 2mo | $240,000 | $139 | 54 |
| 2433 W B St | 0.56mi | 2/1.0 | 1,697 (+7%) | 8mo | $185,000 | $109 | 54 |
| 1710 West C Street St | 0.54mi | 2/1.0 | 1,448 (-9%) | 12mo | $129,000 | $89 | 49 |
| 2534 W A Street St | 0.58mi | 3/2.0 (+1) | 1,772 (+12%) | 3mo | $225,000 | $127 | 44 |
| 2225 W D St | 0.61mi | 3/1.8 (+1) | 1,368 (-14%) | 2mo | $144,000 | $105 | 42 |
Match score weights: distance 35% · size 25% · config 20% · recency 20%. Top-matched comps best support the ARV.
Projected returns pro-forma
-3.0% appreciation · 3.0% rent growth · sell at horizon
- IRR
- -17.4%
- Equity multiple
- 0.39×
- Total profit
- $-23,669
- Equity at exit
- $20,517
- IRR
- -9.5%
- Equity multiple
- 0.42×
- Total profit
- $-22,497
- Equity at exit
- $11,897
Cash invested: $38,528 (down + closing). Projections, not guarantees.
Landlord ↔ Tenant lean methodology
- Overall (STATE)
- 90 Strongly Landlord-Friendly
- State Wyoming
- 90 Strongly Landlord-Friendly · R+25
- County
- — inherits STATE
- City
- — inherits STATE
ZIP-level market 82201
- Active inventory
- 81
- Price-to-rent
- 10.9×
Monthly cashflow live
- Estimated rent
- $1,056 medium interval (Pro) →
- Mortgage (P&I)
- −$722
- Tax from tax record
- −$76 /mo · $911/yr
- Insurance
- −$57
- HOA
- −$0
- Vacancy / Maint / Mgmt
- −$222
- Net cashflow
- $-21
Break-even live
UW: 25.0% down · 7.5% · 30yr · 1.5% tax · 5.0% vac · 8.0% maint · 8.0% mgmt
Financing live
Cash to close
- Down payment
- $34,400
- Closing costs
- $4,128
- Reserves months
- —
- Total cash needed
- —
Loan-product check · same deal, 3 products live
Conventional
25% down · 7.5% · 30yr
- Down + closing
- —
- Monthly P&I
- —
- Monthly cashflow
- —
- DSCR
- —
- Eligible?
- —
Personal DTI + credit; lowest rate.
DSCR
20% down · 8.5% · 30yr
- Down + closing
- —
- Monthly P&I
- —
- Monthly cashflow
- —
- DSCR
- —
- Eligible?
- —
No personal income docs; deal must DSCR.
Hard money
10% down · 12.0% · 12mo
- Down + closing
- —
- Monthly P&I
- —
- Monthly cashflow
- —
- DSCR
- —
- Eligible?
- —
Short-term bridge; refi at stabilization.
Listing history 8 events
-
2026-05-02status Pending
-
2026-03-31price $137,600
-
2026-02-11$172,000 Active
-
2024-01-08soldstatus Closed 297-char remark
Show marketing remark (297 chars)
Nice clean 4 bedroom, 2 bath house. Solid oak floors through out upstairs. Built in china hutch. Nice big picture window in living room. New plumbing. Updated bathroom downstairs. 18 x 24 attached garage with a 10 x 7 door with opener. Has manual underground sprinklers. 9 x 12 metal storage shed.
-
2024-01-05soldstatus
-
2023-11-18status Pending 297-char remark
Show marketing remark (297 chars)
Nice clean 4 bedroom, 2 bath house. Solid oak floors through out upstairs. Built in china hutch. Nice big picture window in living room. New plumbing. Updated bathroom downstairs. 18 x 24 attached garage with a 10 x 7 door with opener. Has manual underground sprinklers. 9 x 12 metal storage shed.
-
2023-11-13$195,500 Active 297-char remark
Show marketing remark (297 chars)
Nice clean 4 bedroom, 2 bath house. Solid oak floors through out upstairs. Built in china hutch. Nice big picture window in living room. New plumbing. Updated bathroom downstairs. 18 x 24 attached garage with a 10 x 7 door with opener. Has manual underground sprinklers. 9 x 12 metal storage shed.
-
2022-12-05soldstatus
ⓘ Source: listings_history table (triggers on properties + properties_extension) + one-shot
backfill from property_details.listing_events for pre-trigger history.
Tax reassessment forecast WY · Resets to sale price
- Current annual tax
- $911 · $76/mo
- Projected year-2 tax
- $911 · $76/mo
- Expected delta
- $0/yr ($0/mo · 0.0%)
ⓘ Screening estimate from a state-policy table — verify with the county assessor before closing.
Climate risk First Street
- Flood 1/10 Low FEMA zone X (unshaded) · 0% chance over 30 yrs
- Wildfire 4/10 Moderate
- Heat 3/10 Moderate 7 d/yr ≥94°F today · 20 d/yr by 30 yrs out
- Wind 1/10 Low
- Air quality 2/10 Low 1 unhealthy d/yr today · 2 by 30 yrs out
Nearby sold comps map
Loading sold comps map…
Walkable amenities ~0.75 mi
Loading nearby amenities…
Taxation est. · year 1
- Rental income
- $12,668
- − Mortgage interest
- −$7,708
- − Property taxes
- −$911
- − Insurance
- −$688
- − Repairs & maintenance
- −$1,013
- − Management
- −$1,013
- − Depreciation
- −$4,003
- Taxable loss
- −$2,669
- Est. tax savings @ 24.0%
- +$640
- After-tax cash flow
- $390/yr
For passive investors: Depreciation is non-cash, so a rental often shows a tax loss while cash-flowing — sheltering income. Rental losses are passive: they offset passive income freely, and up to $25,000/yr can offset ordinary (W-2) income if you actively participate and your MAGI is under $100k (phasing out to $0 by $150k); unused losses carry forward. On sale, claimed depreciation is recaptured at up to 25%, and gains may owe capital-gains tax (a 1031 exchange can defer both). Figures are a year-1 estimate at your 24.0% rate — not tax advice; consult a CPA.
Schools (NCES district)
- District
- Goshen County School District #1
- NCES district ID
- 5602990
- Math proficiency
- 45% ▼ -5.00%
- Reading proficiency
- 57% ▲ 2.00%
- Median HH income
- $44,003
- Composite
- 43.0/100
- National rank
- #3106
- State rank
- #28 of 41 in WY
Livability — Torrington
- Score
- 67/100
- State rank
- #66
- US rank
- #11066
Category grades
Schools grade is shown separately in the Schools card above.
Census & demographics
- Census place
- Torrington, WY
- City population
- 9,667
- Population (ZIP)
- 6,615
Population outlook (Goshen County) Hauer SSP2
- Today (2025)
- 14,178 people
- By 2030
- 14,461 · +2.0%
- By 2040
- 15,052 · +6.2%
- By 2050
- 15,857 · +11.8%
- By 2075
- 18,921 · +33.5%
- By 2100
- 21,342 · +50.5%
Race, ethnicity, and origin ACS 2023
- Neighborhood character
- Predominantly White (85%)
- Race & ethnicity
- White 85% Two or more races 11% Hispanic / Latino 10%
- Hispanic origin (detail)
- Mexican 2%
- Common ancestry
- Portuguese 7% Iranian 2% German 2%
- Foreign-born
- 0%
- Languages at home
- 92% English-only · Spanish 7% Other Indo-European 1%
Political lean MEDSL · Goshen
- 2024 margin
- Solid R (+60.9) · D 18.9% · R 79.8% · Other 1.4%
- 2008→2024 swing
- -25.2pp toward R · 2008: -35.7pp · 2024: -60.9pp
- All cycles
- 2024: R+60.9 2020: R+58.9 2016: R+61.2 2012: R+47.2 2008: R+35.7
Not yet ingested
- Civics
- —
Market trends
- HPI YoY
- ▼ -138.60%
- Current HPI
- 179.2911
- Rent YoY
- —
- Metro
- —
- State GDP YoY
- —
- F500 in state
- 0
Price history
-29.6% since first listed8 events — show timeline
- 2026-05-02 Pending — WMLS
- 2026-03-31 Price Changed $137,600 WMLS
- 2026-02-11 Listed $172,000 WMLS
- 2024-01-08 Sold (MLS) — WMLS
- 2024-01-05 Sold (Public Records) — Public Records
- 2023-11-18 Pending — WMLS
- 2023-11-13 Listed $195,500 WMLS
- 2022-12-05 Sold (Public Records) — Public Records
Property tax history
+3.3%/yrLatest (2025): $911 · -16.6% YoY. Source: county tax records.
Cash-flow waterfall
monthlySold comps — $/sqft
last 12 mo · ≤1 miLoading sold comps…