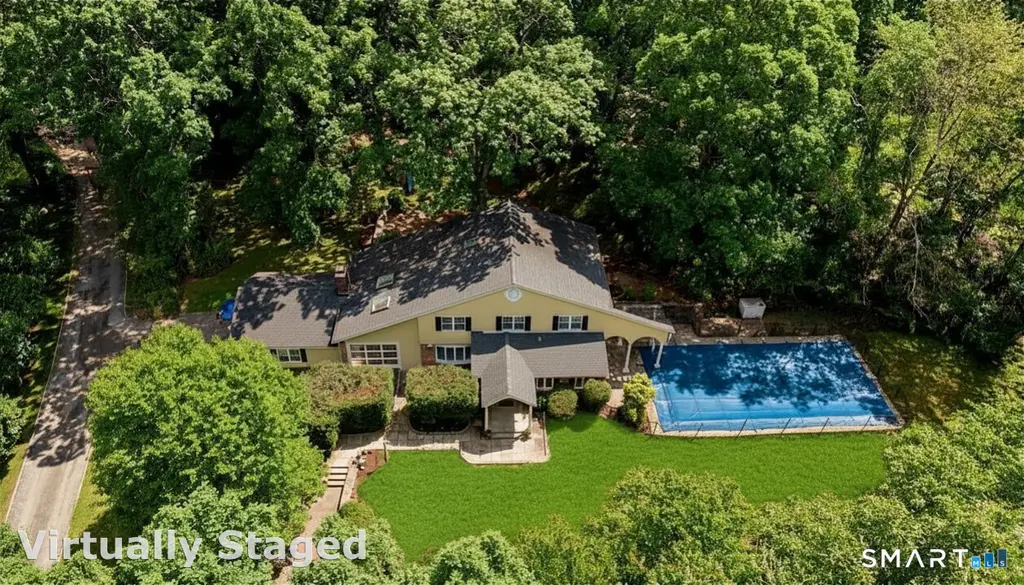
441 Cognewaugh Rd · Cos Cob, CT
Flood risk 1/10 · Minimal
- FEMA flood zone
- X (unshaded)
- Chance of flooding over 30 yrs
- 0.0%
- Est. flood insurance / yr
- $473 – $860
Fire risk 3/10 · Minor
- Est. fire insurance / yr
- $829 – $1,539
Heat risk 5/10 · Moderate
- Hot days now (above 99°F)
- 7 days/yr
- Hot days in 30 yrs
- 16 days/yr
Wind risk 6/10 · Moderate
- Chance of severe wind over 30 yrs
- 54.0%
Air-quality risk 4/10 · Minor
- Unhealthy air days now
- 5 days/yr
- Unhealthy air days in 30 yrs
- 7 days/yr
Risk factors via First Street. Map © Google.
Why this score? — see what drove the D+ grade
The composite is a weighted blend of 9 inputs, each scored 0–100. Each bar is that input's sub-score; the figure is the points it added to the 100-point composite (weight × sub-score).
- ARV discount +15.0/15.0
- Appreciation +9.0/10.0
- Cash flow +7.3/30.0
- Schools +6.6/10.0
- Livability +3.7/5.0
- Rent growth +2.5/5.0
- Condition / age +2.5/5.0
- DSCR +1.5/10.0
- 1% rule +1.0/10.0
$1,795,000
🖨 Deal sheet 📄 Offer letter ✓ Due diligence
Listing remarks MLS
Sun-drenched and privately set on 1.45 level acres, this spacious 4-bedroom, 3 full bath mid-country home offers tranquility just minutes from town and steps from Mianus River Park. Sliding doors connect the indoor living spaces to the outdoor deck, creating seamless indoor-outdoor living ideal for entertaining. A finished lower level provides flexible space for a playroom or home office. Recent improvements include a newer roof, boiler, and well pump, offering a solid foundation for future updates and personal touches. Surrounded by peaceful grounds and nature, this special property presents a wonderful opportunity to create lasting memories. Existing in-ground pool is not operational and will convey as-is.
Key facts
- 1.45 acre lot
- 2 garage spots
- Pool
Property features AI
Exterior
- Parking: 2-car garage with garage door opener
- Security: Smoke detectors
- Utilities: Septic tank; Well water
- Home design: Single family residence; Built in 1957; Architectural shingle roof; Shingle siding; Zoning: RA-2
- Construction: Shingle siding construction; Architectural shingle roof; Built in 1957; Shed(s) on property
- Exterior features: Terrace; Deck; Private pool; Level lot
Interior
- Bathrooms: 3 full bathrooms
- Heating & cooling: Central air conditioning; Forced air heating; Oil heating
- Interior features: Eat-in kitchen; Separate shower; Finished basement; One fireplace
Neighborhood map
What this means for you Summary
Snapshot
- This is a 4-bed/3.0-bath single-family listed at $1.79M.
Deal economics
- At list price, monthly cash flow is $-2k ($-29k/yr) — negative.
- To cash-flow at today's rent, offer at most $1.37M (23.6% below list).
- To meet the 1% rule (rent ≥ 1% of price), the offer needs to be $1.07M (40.2% below list).
- Recommended offer: $1.07M (40.2% below list) — sets the bar for 1% rule.
Location & tenants
- Location reads 73/100 on livability (#72 in CT) — a middle-class / working-renter tenant base. Strengths: crime A+, employment A+, health & safety B; Watch: housing D+, amenities F, commute F.
- Greenwich School District (suburban): math 64% / reading 73% proficiency, ranked #12 of 153 in CT (top 8%) — acceptable for families but not a draw, mixed tenant base, ~2y average lease; only 11% free/reduced lunch — higher-income household profile.
- Zoned schools: North Street School (math 72% / reading 82%, grade A, #28 of 553 statewide, top 7%, 387 students, 4% FRL); Central Middle School (math 60% / reading 71%, grade A-, #26 of 175 statewide, top 16%, 506 students, 18% FRL) — zoned schools at 11% FRL track the district average.
- Market conditions: 31 active listings in the ZIP; 6 comparable units currently listed for rent nearby; rentals at typical pace (median 19d on market — plan ~3-4 weeks tenant-placement turnaround); 1,151 units permitted in Western Connecticut Planning Region in 2024 (714 in 5+ unit buildings).
Forward outlook
- In year one you build about $154k of equity ($12k loan paydown + $142k appreciation (7.9% local appreciation)).
- By year 2, paydown + projected appreciation supports a ~$247k cash-out refi (75% LTV) — recoverable capital for the next deal without selling this one.
Negotiation context
- Only 12 days on market — expect competitive offers; lowballing is unlikely to land.
- 5 sale attempts since 32y ago; this cycle's ask is 35% above the opening price — seller raised mid-cycle; expect resistance to lowballs.
- Current owner paid $1.09M; list at $1.79M implies a 64% gain — meaningful room to come down on a strong offer.
Risks & watch-outs
- Watch-outs: built in 1957 — expect roof / HVAC / electrical / plumbing capex.
- Climate carrying-cost: major wind risk, 54% chance of damaging wind over 30y; extreme-heat days projected 7→16/yr by 2055 (HVAC capex compounding) — expect insurance premiums to compound above CPI over the hold.
Questions for the listing agent
- What do current leases actually rent for vs. the listed asking? Can we see a recent rent roll and the last 12 months of T-12 income?
- Built in 1957 — when were the roof, HVAC, electrical panel, plumbing, and water heater last replaced?
- Is there a deadline driving the sale (1031 exchange, divorce, estate, relocation)? That informs how much negotiation room exists.
- Schools are A-rated — typically a magnet for longer-tenancy family renters. What's the average tenant stay here, and is there a school-zone premium baked into asking?
- The area grade is low — what's the realistic commute time and amenity access for the typical tenant pool here? Any planned neighborhood developments (good or bad) we should know about?
- What's the average days-on-market for RENTAL listings here right now (not sales)? A rising rental-DOM trend means longer vacancies and softer asking-rent achievability than the comps imply.
- What's the recent tenant-quality profile in this submarket — average credit score on applications, eviction rate, late-payment / NSF rate, and stable-employment percentage? A property-management company in the area should have these aggregated.
- How much new for-sale + rental construction is in the pipeline within 1–3 miles? Heavy new supply typically softens prices + rents 12–24 months out; constrained supply supports both.
Investment metrics
- 1% rule
- 0.60% ✗
- Cap rate
- 4.69%
- Cash-on-cash
- -5.72%
- DSCR
- 0.75
- GRM
- 13.9
CMA / ARV
- ARV (on-the-fly)
- $2,194,543
- Comps found
- 4
Show comp detail 4 sales within ~0.75 mi
| Address | Dist | Beds/Ba | Sqft | Sold | Price | $/sf | Match |
|---|---|---|---|---|---|---|---|
| 484 Cognewaugh Rd | 0.19mi | 3/2.5 (-1) | 2,832 (-2%) | 2mo | $1,900,000 | $671 | 79 |
| 144 Highline Trl | 0.71mi | 4/2.5 | 2,800 (-3%) | 24mo | $1,050,000 | $375 | 39 |
| 174 Cat Rock Rd | 0.71mi | 4/3.0 | 2,575 (-11%) | 24mo | $1,950,000 | $757 | 28 |
| 306 Stanwich Rd | 0.47mi | 5/3.5 (+1) | 3,330 (+15%) | 22mo | $2,800,000 | $841 | 28 |
Match score weights: distance 35% · size 25% · config 20% · recency 20%. Top-matched comps best support the ARV.
Projected returns pro-forma
7.9% appreciation · 3.0% rent growth · sell at horizon
- IRR
- 15.4%
- Equity multiple
- 2.14×
- Total profit
- $575,211
- Equity at exit
- $1,352,029
- IRR
- 15.1%
- Equity multiple
- 4.54×
- Total profit
- $1,780,240
- Equity at exit
- $2,672,697
Cash invested: $502,600 (down + closing). Projections, not guarantees.
Landlord ↔ Tenant lean methodology
- Overall (STATE)
- 27 Tenant-Leaning
- State Connecticut
- 27 Tenant-Leaning · D+7
- County
- — inherits STATE
- City
- — inherits STATE
ZIP-level market 06807
- Home prices YoY
- 4.3%
- Active inventory
- 31
- Price-to-rent
- 13.9×
Monthly cashflow live
- Estimated rent
- $10,740 high interval (Pro) →
- Mortgage (P&I)
- −$9,413
- Tax from tax record
- −$718 /mo · $8,614/yr
- Insurance
- −$748
- HOA
- −$0
- Vacancy / Maint / Mgmt
- −$2,256
- Net cashflow
- $-2,394
Break-even live
UW: 25.0% down · 7.5% · 30yr · 1.5% tax · 5.0% vac · 8.0% maint · 8.0% mgmt
Financing live
Cash to close
- Down payment
- $448,750
- Closing costs
- $53,850
- Reserves months
- —
- Total cash needed
- —
Loan-product check · same deal, 3 products live
Conventional
25% down · 7.5% · 30yr
- Down + closing
- —
- Monthly P&I
- —
- Monthly cashflow
- —
- DSCR
- —
- Eligible?
- —
Personal DTI + credit; lowest rate.
DSCR
20% down · 8.5% · 30yr
- Down + closing
- —
- Monthly P&I
- —
- Monthly cashflow
- —
- DSCR
- —
- Eligible?
- —
No personal income docs; deal must DSCR.
Hard money
10% down · 12.0% · 12mo
- Down + closing
- —
- Monthly P&I
- —
- Monthly cashflow
- —
- DSCR
- —
- Eligible?
- —
Short-term bridge; refi at stabilization.
Rent comps 6 comps
| Address | Beds | Baths | Sqft | Rent | $/sqft | DOM | Units | Dist |
|---|---|---|---|---|---|---|---|---|
| 424 Cognewaugh Rd Cos Cob, CT | 5.0 | 4.0 | 3580 | $11,500 | $3.21 | 10d | 1 | 0.15mi |
| 488 Cognewaugh Rd Cos Cob, CT | 3.0 | 2.5 | 3116 | $12,000 | $3.85 | 2d | 1 | 0.19mi |
| 163 Macgregor Dr Stamford, CT | 4.0 | 2.5 | 3070 | $7,500 | $2.44 | 23d | 1 | 1.20mi |
| 267 Thunder Hill Dr Stamford, CT | 3.0 | 2.0 | 2310 | $4,300 | $1.86 | 44d | 1 | 1.33mi |
| 511 Roxbury Rd Stamford, CT | 4.0 | 2.5 | 2463 | $6,000 | $2.44 | 2d | 1 | 1.46mi |
| 57 Drum Hill Ln Stamford, CT | 4.0 | 3.5 | 2995 | $8,750 | $2.92 | 19d | 1 | 1.46mi |
Listing history 9 events
-
2026-06-15status $1,795,000 Under Contract 12 DOM
-
2026-06-15days on market $1,795,000 Active 12 DOM
-
2026-06-13days on market $1,795,000 Active 10 DOM
-
2026-06-10days on market $1,795,000 Active 7 DOM
-
2026-06-09days on market $1,795,000 Active 6 DOM
-
2026-06-08days on market $1,795,000 Active 5 DOM
-
2026-06-07statusdays on market $1,795,000 Active 4 DOM
-
2026-06-03remarks 699-char remark
Show marketing remark (717 chars)
Sun-drenched and privately set on 1.45 level acres, this spacious 4-bedroom, 3 full bath mid-country home offers tranquility just minutes from town and steps from Mianus River Park. Sliding doors connect the indoor living spaces to the outdoor deck, creating seamless indoor-outdoor living ideal for entertaining. A finished lower level provides flexible space for a playroom or home office. Recent improvements include a newer roof, boiler, and well pump, offering a solid foundation for future updates and personal touches. Surrounded by peaceful grounds and nature, this special property presents a wonderful opportunity to create lasting memories. Existing in-ground pool is not operational and will convey as-is.
-
2026-06-03$1,795,000 Coming Soon 1 DOM
Show marketing remark (717 chars)
Sun-drenched and privately set on 1.45 level acres, this spacious 4-bedroom, 3 full bath mid-country home offers tranquility just minutes from town and steps from Mianus River Park. Sliding doors connect the indoor living spaces to the outdoor deck, creating seamless indoor-outdoor living ideal for entertaining. A finished lower level provides flexible space for a playroom or home office. Recent improvements include a newer roof, boiler, and well pump, offering a solid foundation for future updates and personal touches. Surrounded by peaceful grounds and nature, this special property presents a wonderful opportunity to create lasting memories. Existing in-ground pool is not operational and will convey as-is.
ⓘ Source: listings_history table (triggers on properties + properties_extension) + one-shot
backfill from property_details.listing_events for pre-trigger history.
Tax reassessment forecast CT · Partial reset (capped growth)
- Current annual tax
- $8,614 · $718/mo
- Projected year-2 tax
- $23,514 · $1,959/mo
- Expected delta
- +$14,900/yr (+$1,242/mo · 173.0%)
ⓘ Screening estimate from a state-policy table — verify with the county assessor before closing.
Climate risk First Street
- Flood 1/10 Low FEMA zone X (unshaded) · 0% chance over 30 yrs
- Wildfire 3/10 Moderate
- Heat 5/10 Major 7 d/yr ≥99°F today · 16 d/yr by 30 yrs out
- Wind 6/10 Major 54% chance of damaging wind over 30 yrs
- Air quality 4/10 Moderate 5 unhealthy d/yr today · 7 by 30 yrs out
Nearby sold comps map
Loading sold comps map…
Walkable amenities ~0.75 mi
Loading nearby amenities…
Taxation est. · year 1
- Rental income
- $128,886
- − Mortgage interest
- −$100,548
- − Property taxes
- −$8,614
- − Insurance
- −$8,975
- − Repairs & maintenance
- −$10,311
- − Management
- −$10,311
- − Depreciation
- −$52,218
- Taxable loss
- −$62,091
- Est. tax savings @ 24.0%
- +$14,902
- After-tax cash flow
- $-13,825/yr
For passive investors: Depreciation is non-cash, so a rental often shows a tax loss while cash-flowing — sheltering income. Rental losses are passive: they offset passive income freely, and up to $25,000/yr can offset ordinary (W-2) income if you actively participate and your MAGI is under $100k (phasing out to $0 by $150k); unused losses carry forward. On sale, claimed depreciation is recaptured at up to 25%, and gains may owe capital-gains tax (a 1031 exchange can defer both). Figures are a year-1 estimate at your 24.0% rate — not tax advice; consult a CPA.
Schools (NCES district)
- District
- Greenwich School District
- NCES district ID
- 0901710
- Math proficiency
- 64% ▼ -7.00%
- Reading proficiency
- 73% ▼ -5.00%
- Median HH income
- $129,257
- Composite
- 65.67/100
- National rank
- #461
- State rank
- #12 of 153 in CT
Livability — Cos Cob
- Score
- 73/100
- State rank
- #72
- US rank
- #5178
Category grades
Schools grade is shown separately in the Schools card above.
Census & demographics
- City population
- 7,667
- Population (ZIP)
- 7,667
Population outlook (Western Connecticut County) Hauer SSP2
- By 2040
- 685,031
Race, ethnicity, and origin ACS 2023
- Neighborhood character
- Diverse neighborhood (Simpson 0.58)
- Race & ethnicity
- White 63% Two or more races 15% Hispanic / Latino 13% Asian 7% Black 4%
- Hispanic origin (detail)
- Puerto Rican 6% Dominican 1%
- Common ancestry
- Romanian 4% Estonian 4% Italian 3%
- Foreign-born
- 24% · Canada, China, Jamaica
- Languages at home
- 76% English-only · Other Indo-European 9% Spanish 6% Other Asian/Pacific 5%
Political lean MEDSL · Western Connecticut
- 2024 margin
- D (+19.1) · D 58.8% · R 39.7% · Other 1.6%
- All cycles
- 2024: D+19.1
Not yet ingested
- Civics
- —
Market trends
- HPI YoY
- ▲ 7.90%
- Current HPI
- 191.0957
- Rent YoY
- —
- Metro
- —
- State GDP YoY
- ▲ 1.06%
- F500 in state
- 38
Industry mix (Fortune 500 HQ in CT)
| Industry | F500 HQs | Revenue |
|---|---|---|
| Industrial Machinery | 4 | $38B |
|
||
| Insurance | 3 | $71B |
|
||
| Financial Services | 2 | $25B |
|
||
| Transportation / Logistics | 2 | $18B |
|
||
| Healthcare | 1 | $247B |
|
||
| Telecommunications | 1 | $55B |
|
||
Price history
+130.4% since first listed15 events — show timeline
- 2026-06-03 Price Changed $1,795,000 Smart MLS
- 2026-06-03 Coming Soon $1,750,000 Smart MLS
- 2026-06-03 Coming Soon $1,795,000 GMLS
- 2004-03-09 Sold (Public Records) $1,092,000 Public Records
- 2004-03-08 Sold (MLS) $1,092,000 GMLS
- 2003-11-05 Listed $1,325,000 GMLS
- 2001-02-23 Sold (MLS) — GMLS
- 2000-07-12 Listed $1,290,000 GMLS
- 1998-02-23 Sold (Public Records) $632,500 Public Records
- 1998-02-20 Sold (MLS) $632,500 GMLS
- 1997-09-15 Listed $690,000 GMLS
- 1995-11-12 Sold (MLS) — GMLS
- 1995-04-12 Listed $655,000 GMLS
- 1994-12-02 Listed $779,000 GMLS
- 1994-12-02 Sold (MLS) — GMLS
Property tax history
+1.2%/yrLatest (2023): $8,614 · +1.0% YoY. Source: county tax records.
Cash-flow waterfall
monthlySold comps — $/sqft
last 12 mo · ≤1 miLoading sold comps…