 🏷️ Likely Rental
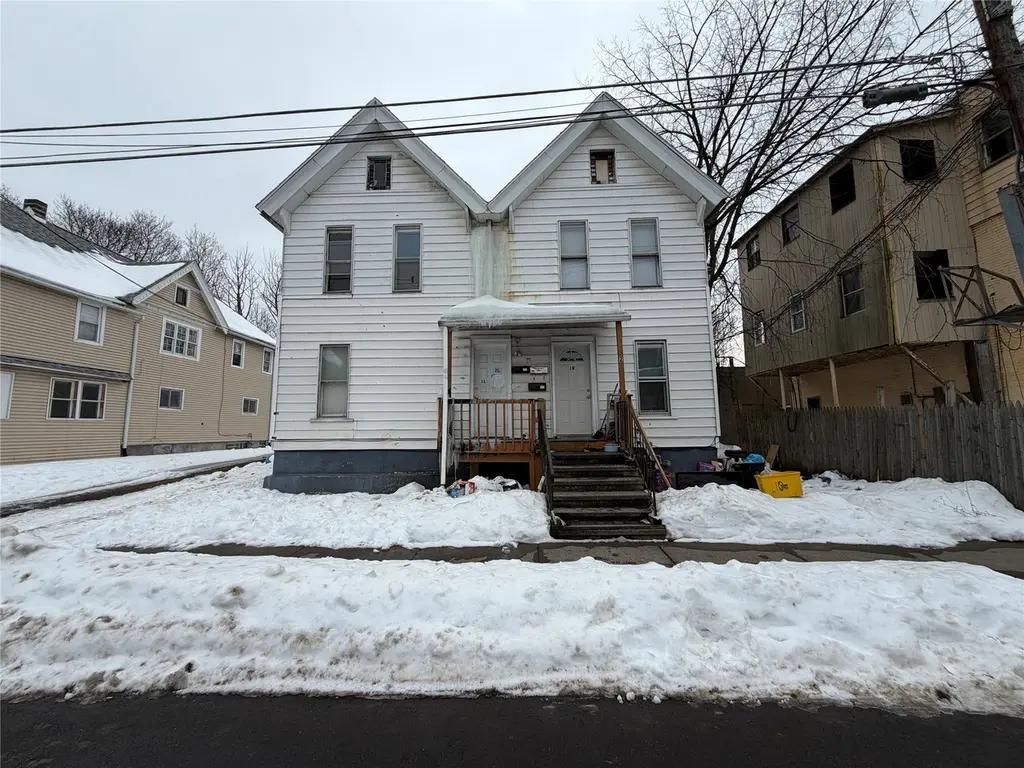
2.5 Cary St St · Binghamton, NY
Flood risk 5/10 · Moderate
- FEMA flood zone
- X
- Chance of flooding over 30 yrs
- 0.24%
- Est. flood insurance / yr
- $473 – $860
Fire risk 1/10 · Minimal
- Est. fire insurance / yr
- $691 – $1,283
Heat risk 3/10 · Minor
- Hot days now (above 94°F)
- 7 days/yr
- Hot days in 30 yrs
- 16 days/yr
Wind risk 2/10 · Minimal
- Chance of severe wind over 30 yrs
- 2.0%
Air-quality risk 2/10 · Minimal
- Unhealthy air days now
- 0 days/yr
- Unhealthy air days in 30 yrs
- 1 days/yr
Risk factors via First Street. Map © Google.
Why this score? — see what drove the D grade
The composite is a weighted blend of 9 inputs, each scored 0–100. Each bar is that input's sub-score; the figure is the points it added to the 100-point composite (weight × sub-score).
- Cash flow +15.0/30.0
- ARV discount +7.5/15.0
- 1% rule +5.0/10.0
- DSCR +5.0/10.0
- Livability +3.9/5.0
- Schools +3.0/10.0
- Rent growth +2.5/5.0
- Condition / age +2.5/5.0
- Appreciation +0.0/10.0
$67,000
🖨 Deal sheet 📄 Offer letter ✓ Due diligence
Multi-family units
County records classify this as Multi-Family (2-4 Unit). Listing-text estimate: 3 units. confirmed
Listing remarks MLS
BACK ON THE MARKET! Triplex with low annual taxes of $2,345. Property consists of two 1-bedroom, 1-bath units and one 3-bedroom, 1.5-bath unit, along with a small driveway on the left side. One unit is currently vacant, one unit is rented at $900/month, and the right-side tenant is not currently paying rent. Being sold as-is. Photos include one 1-bedroom unit and the 3-bedroom unit (taken prior to tenant occupancy) to reflect overall condition. Showings require notice—48 hours needed to post per tenant requirements, with additional time required due to current occupancy situation. Cash only.
Key facts
- 2,613 sq ft lot
- Built 1930
- Listed 86 days
Neighborhood map
What this means for you Summary
Snapshot
- This is a 2×1bd/1ba + 1×3bd/1.5ba units multifamily listed at $67k.
Deal economics
- At list price, monthly cash flow is $2k ($28k/yr) — positive. Per door: $778/mo.
- The deal already cash-flows at list — no discount required.
- Meets the 1% rule at list price ($4k rent vs $67k).
- Recommended offer: $63k (6.0% below list) — sets the bar for market timing.
- Cap rate 48.1% vs local median 6.4% in Binghamton — top-decile yield for the area; either an underpriced asset or a hidden risk that comps aren't pricing in. Stress-test before assuming the spread holds.
Location & tenants
- Location reads 78/100 on livability (#174 in NY, #2,710 nationally) — a middle-class / working-renter tenant base. Strengths: amenities A+, commute A+, cost of living A+; Watch: schools D, crime F, employment F.
- Binghamton City School District (urban): math 30% / reading 44% proficiency, ranked #557 of 590 in NY (top 94%) — families likely to look elsewhere, expect single-tenant / working-renter base with shorter leases; 61% free/reduced lunch — lower-income household profile, screen leases tightly.
- Market conditions: 92 active listings in the ZIP; 340 units permitted in Broome County in 2024 (269 in 5+ unit buildings).
- At $3,541/mo this rent would consume 77% of the median local household income ($56k/yr) (locally 1230% of renters already pay >50% of income on rent) — very limited rent-growth headroom before tenants either downsize or default.
Forward outlook
- Local home prices are declining (-3.0%/yr); year-one equity from $463 of loan paydown is wiped out by about $2k of value loss. Plan a longer hold.
- Broome County population projected at -13% by 2050 — secular population decline; favor cash flow + early exit over multi-decade hold.
- At projected returns (-3.0% appreciation + 3.0% rent growth), your $19k cash investment doubles in ~1 year — after that, you're playing with house money.
Negotiation context
- It's been on market 86 days — a 6% lower offer ($63k) is reasonable based on typical stale-listing flexibility.
- 4 sale attempts since 21y ago; this cycle's ask has dropped $32k (32%) from the opening price — seller is motivated, your offer sets the floor, not the list.
- Current owner paid $20k; list at $67k implies a 235% gain — meaningful room to come down on a strong offer.
Risks & watch-outs
- Watch-outs: built in 1930 — expect roof / HVAC / electrical / plumbing capex.
- Climate carrying-cost: moderate flood risk — expect insurance premiums to compound above CPI over the hold.
Questions for the listing agent
- It's been on market 86 days. Have you received any prior offers? Is the seller open to a 6% concession, seller financing, or rate buy-down credit?
- Can we see the unit-by-unit rent roll, current vacancy, and any below-market leases? What's the average tenancy length?
- What capital expenditures (roof, boiler, parking lot, exteriors) have been made in the last 5 years, and what's planned in the next 2?
- Built in 1930 — when were the roof, HVAC, electrical panel, plumbing, and water heater last replaced?
- Why hasn't it sold? Are there any deal-killer items the seller is aware of (foundation, flood, title, zoning, code violations)?
- Is there a deadline driving the sale (1031 exchange, divorce, estate, relocation)? That informs how much negotiation room exists.
- Schools are D-rated, which usually means shorter tenancies and higher turnover. Who's the typical renter profile here, and what's been the actual vacancy rate?
- Crime grade is F in this area — have there been break-ins, vandalism, or insurance claims at this property in the last 3 years? What carrier currently insures it and at what premium?
- The area grade is low — what's the realistic commute time and amenity access for the typical tenant pool here? Any planned neighborhood developments (good or bad) we should know about?
- What's the average days-on-market for RENTAL listings here right now (not sales)? A rising rental-DOM trend means longer vacancies and softer asking-rent achievability than the comps imply.
- What's the recent tenant-quality profile in this submarket — average credit score on applications, eviction rate, late-payment / NSF rate, and stable-employment percentage? A property-management company in the area should have these aggregated.
- How much new apartment / multifamily construction is in the pipeline within 1–3 miles? Heavy new supply (>2% of stock underway) typically softens rents 12–24 months out; light construction supports rent growth.
Investment metrics
- 1% rule
- 5.29% ✓
- Cap rate
- 48.10%
- Cash-on-cash
- 149.32%
- DSCR
- 7.64
- GRM
- 1.6
CMA / ARV
- ARV (median comp)
- $208,010
- List price
- $67,000
- Delta
- -67.79%
- Verdict
- UNDERPRICED
- Comps
- 20 within 1.0 mi
Projected returns pro-forma
-3.0% appreciation · 3.0% rent growth · sell at horizon
- IRR
- —
- Equity multiple
- 8.35×
- Total profit
- $137,874
- Equity at exit
- $9,990
- IRR
- —
- Equity multiple
- 17.62×
- Total profit
- $311,721
- Equity at exit
- $5,793
Cash invested: $18,760 (down + closing). Projections, not guarantees.
Landlord ↔ Tenant lean methodology
- Overall (STATE)
- 15 Strongly Tenant-Friendly
- State New York
- 15 Strongly Tenant-Friendly · D+10
- County
- — inherits STATE
- City
- — inherits STATE
ZIP-level market 13901
- Home prices YoY
- -5.1%
- Active inventory
- 92
- Price-to-rent
- 5.2×
Monthly cashflow live
- Estimated rent
- $3,541 high interval (Pro) →
- Mortgage (P&I)
- −$351
- Tax est. 1.5%
- −$84 /mo · $1,005/yr
- Insurance
- −$28
- HOA
- −$0
- Vacancy / Maint / Mgmt
- −$744
- Net cashflow
- $2,334
Break-even live
3-unit breakdown (identical units grouped — click to expand)
| Units | Beds | Baths | Est. rent |
|---|---|---|---|
| 2× units | 1 | 1 | $2,142 |
| #1 | 1 | 1 | $1,071 |
| #2 | 1 | 1 | $1,071 |
| 1× unit | 3 | 1.5 | $1,400 |
| Total (3 units) | $3,541 | ||
UW: 25.0% down · 7.5% · 30yr · 1.5% tax · 5.0% vac · 8.0% maint · 8.0% mgmt
Financing live
Cash to close
- Down payment
- $16,750
- Closing costs
- $2,010
- Reserves months
- —
- Total cash needed
- —
Loan-product check · same deal, 3 products live
Conventional
25% down · 7.5% · 30yr
- Down + closing
- —
- Monthly P&I
- —
- Monthly cashflow
- —
- DSCR
- —
- Eligible?
- —
Personal DTI + credit; lowest rate.
DSCR
20% down · 8.5% · 30yr
- Down + closing
- —
- Monthly P&I
- —
- Monthly cashflow
- —
- DSCR
- —
- Eligible?
- —
No personal income docs; deal must DSCR.
Hard money
10% down · 12.0% · 12mo
- Down + closing
- —
- Monthly P&I
- —
- Monthly cashflow
- —
- DSCR
- —
- Eligible?
- —
Short-term bridge; refi at stabilization.
Listing history 23 events
-
2026-06-17status $67,000 Pending 86 DOM
-
2026-06-16days on market $67,000 Active 86 DOM
-
2026-06-15days on market $67,000 Active 85 DOM
-
2026-06-14days on market $67,000 Active 83 DOM
-
2026-06-13days on market $67,000 Active 82 DOM
-
2026-06-10days on market $67,000 Active 80 DOM
-
2026-06-09days on market $67,000 Active 79 DOM
-
2026-06-08days on market $67,000 Active 78 DOM
-
2026-06-07days on market $67,000 Active 77 DOM
-
2026-06-03pricedays on market $67,000 Active 73 DOM
-
2026-06-02days on market $77,000 Active 72 DOM
-
2026-06-01days on market $77,000 Active 71 DOM
-
2026-05-31days on market $77,000 Active 70 DOM
-
2026-05-30days on market $77,000 Active 69 DOM
-
2026-05-02price $77,000 604-char remark
Show marketing remark (604 chars)
BACK ON THE MARKET! Triplex with low annual taxes of $2,345. Property consists of two 1-bedroom, 1-bath units and one 3-bedroom, 1.5-bath unit, along with a small driveway on the left side. One unit is currently vacant, one unit is rented at $900/month, and the right-side tenant is not currently paying rent. Being sold as-is. Photos include one 1-bedroom unit and the 3-bedroom unit (taken prior to tenant occupancy) to reflect overall condition. Showings require notice—48 hours needed to post per tenant requirements, with additional time required due to current occupancy situation. Cash only.
-
2026-04-23price $87,000 604-char remark
Show marketing remark (604 chars)
BACK ON THE MARKET! Triplex with low annual taxes of $2,345. Property consists of two 1-bedroom, 1-bath units and one 3-bedroom, 1.5-bath unit, along with a small driveway on the left side. One unit is currently vacant, one unit is rented at $900/month, and the right-side tenant is not currently paying rent. Being sold as-is. Photos include one 1-bedroom unit and the 3-bedroom unit (taken prior to tenant occupancy) to reflect overall condition. Showings require notice—48 hours needed to post per tenant requirements, with additional time required due to current occupancy situation. Cash only.
-
2026-04-07status Active 604-char remark
Show marketing remark (604 chars)
BACK ON THE MARKET! Triplex with low annual taxes of $2,345. Property consists of two 1-bedroom, 1-bath units and one 3-bedroom, 1.5-bath unit, along with a small driveway on the left side. One unit is currently vacant, one unit is rented at $900/month, and the right-side tenant is not currently paying rent. Being sold as-is. Photos include one 1-bedroom unit and the 3-bedroom unit (taken prior to tenant occupancy) to reflect overall condition. Showings require notice—48 hours needed to post per tenant requirements, with additional time required due to current occupancy situation. Cash only.
-
2026-04-07price $95,000 604-char remark
Show marketing remark (604 chars)
BACK ON THE MARKET! Triplex with low annual taxes of $2,345. Property consists of two 1-bedroom, 1-bath units and one 3-bedroom, 1.5-bath unit, along with a small driveway on the left side. One unit is currently vacant, one unit is rented at $900/month, and the right-side tenant is not currently paying rent. Being sold as-is. Photos include one 1-bedroom unit and the 3-bedroom unit (taken prior to tenant occupancy) to reflect overall condition. Showings require notice—48 hours needed to post per tenant requirements, with additional time required due to current occupancy situation. Cash only.
-
2026-03-16status Pending 604-char remark
Show marketing remark (604 chars)
BACK ON THE MARKET! Triplex with low annual taxes of $2,345. Property consists of two 1-bedroom, 1-bath units and one 3-bedroom, 1.5-bath unit, along with a small driveway on the left side. One unit is currently vacant, one unit is rented at $900/month, and the right-side tenant is not currently paying rent. Being sold as-is. Photos include one 1-bedroom unit and the 3-bedroom unit (taken prior to tenant occupancy) to reflect overall condition. Showings require notice—48 hours needed to post per tenant requirements, with additional time required due to current occupancy situation. Cash only.
-
2026-02-28$99,000 Active 604-char remark
Show marketing remark (604 chars)
BACK ON THE MARKET! Triplex with low annual taxes of $2,345. Property consists of two 1-bedroom, 1-bath units and one 3-bedroom, 1.5-bath unit, along with a small driveway on the left side. One unit is currently vacant, one unit is rented at $900/month, and the right-side tenant is not currently paying rent. Being sold as-is. Photos include one 1-bedroom unit and the 3-bedroom unit (taken prior to tenant occupancy) to reflect overall condition. Showings require notice—48 hours needed to post per tenant requirements, with additional time required due to current occupancy situation. Cash only.
-
2013-09-09soldstatus $20,000
-
2012-07-18$29,000
-
2005-06-21$57,000
ⓘ Source: listings_history table (triggers on properties + properties_extension) + one-shot
backfill from property_details.listing_events for pre-trigger history.
Climate risk First Street
- Flood 5/10 Major FEMA zone X · 24% chance over 30 yrs
- Wildfire 1/10 Low
- Heat 3/10 Moderate 7 d/yr ≥94°F today · 16 d/yr by 30 yrs out
- Wind 2/10 Low 2% chance of damaging wind over 30 yrs
- Air quality 2/10 Low 0 unhealthy d/yr today · 1 by 30 yrs out
Nearby sold comps map
Loading sold comps map…
Walkable amenities ~0.75 mi
Loading nearby amenities…
Taxation est. · year 1
- Rental income
- $42,492
- − Mortgage interest
- −$3,753
- − Property taxes
- −$1,005
- − Insurance
- −$335
- − Repairs & maintenance
- −$3,399
- − Management
- −$3,399
- − Depreciation
- −$1,949
- Taxable income
- $28,651
- Est. tax owed @ 24.0%
- −$6,876
- After-tax cash flow
- $21,136/yr
For passive investors: Depreciation is non-cash, so a rental often shows a tax loss while cash-flowing — sheltering income. Rental losses are passive: they offset passive income freely, and up to $25,000/yr can offset ordinary (W-2) income if you actively participate and your MAGI is under $100k (phasing out to $0 by $150k); unused losses carry forward. On sale, claimed depreciation is recaptured at up to 25%, and gains may owe capital-gains tax (a 1031 exchange can defer both). Figures are a year-1 estimate at your 24.0% rate — not tax advice; consult a CPA.
Schools (NCES district)
- District
- Binghamton City School District
- NCES district ID
- 3604870
- Math proficiency
- 30% ▬ 0.00%
- Reading proficiency
- 44% ▲ 15.00%
- Median HH income
- $30,475
- Composite
- 30.09/100
- National rank
- #6342
- State rank
- #557 of 590 in NY
Livability — Binghamton
- Score
- 78/100
- State rank
- #174
- US rank
- #2710
Category grades
Schools grade is shown separately in the Schools card above.
Census & demographics
- Census place
- Binghamton, NY
- County
- Broome County · 126,805 people
- City population
- 65,170
- Metro
- Binghamton, NY
- Population (ZIP)
- 19,613
- Household income
- $55,523
- Rent vs Own
- Severe rent burden
- 1230.0
Population outlook (Broome County) Hauer SSP2
- Today (2025)
- 187,989 people
- By 2030
- 183,066 · -2.6%
- By 2040
- 172,228 · -8.4%
- By 2050
- 163,161 · -13.2%
- By 2075
- 153,641 · -18.3%
- By 2100
- 140,851 · -25.1%
Race, ethnicity, and origin ACS 2023
- Neighborhood character
- Predominantly White (80%)
- Race & ethnicity
- White 80% Two or more races 7% Hispanic / Latino 7% Black 5% Asian 2%
- Hispanic origin (detail)
- Puerto Rican 3%
- Common ancestry
- Romanian 6% Lithuanian 1% Italian 1%
- Foreign-born
- 5% · Canada, Jamaica
- Languages at home
- 93% English-only · Spanish 3% Russian/Polish/Slavic 1% Other Indo-European 1%
Political lean MEDSL · Broome
- 2024 margin
- Toss-up / Even · D 50.2% · R 49.8%
- 2008→2024 swing
- -7.6pp toward R · 2008: 8.0pp · 2024: 0.4pp
- All cycles
- 2024: D+0.4 2020: D+3.5 2016: R+3.7 2012: D+4.6 2008: D+8.0
Not yet ingested
- Civics
- —
Market trends
- HPI YoY
- ▼ -16.13%
- Current HPI
- 300.7692
- Rent YoY
- —
- Metro
- Binghamton, NY
- State GDP YoY
- ▲ 2.60%
- F500 in state
- 92
Industry mix (Fortune 500 HQ in NY)
| Industry | F500 HQs | Revenue |
|---|---|---|
| Financial Services | 10 | $950B |
|
||
| Consumer Goods | 9 | $162B |
|
||
| Insurance | 4 | $225B |
|
||
| Telecommunications | 2 | $144B |
|
||
| Pharmaceuticals | 2 | $112B |
|
||
| Media / Entertainment | 2 | $69B |
|
||
Price history
+35.1% since first listed9 events — show timeline
- 2026-05-02 Price Changed $77,000 GBAOR
- 2026-04-23 Price Changed $87,000 GBAOR
- 2026-04-07 Relisted — GBAOR
- 2026-04-07 Price Changed $95,000 GBAOR
- 2026-03-16 Pending — GBAOR
- 2026-02-28 Listed $99,000 GBAOR
- 2013-09-09 Sold (MLS) $20,000 GBAOR
- 2012-07-18 Listed $29,000 GBAOR
- 2005-06-21 Listed $57,000 GBAOR
Cash-flow waterfall
monthlySold comps — $/sqft
last 12 mo · ≤1 miLoading sold comps…