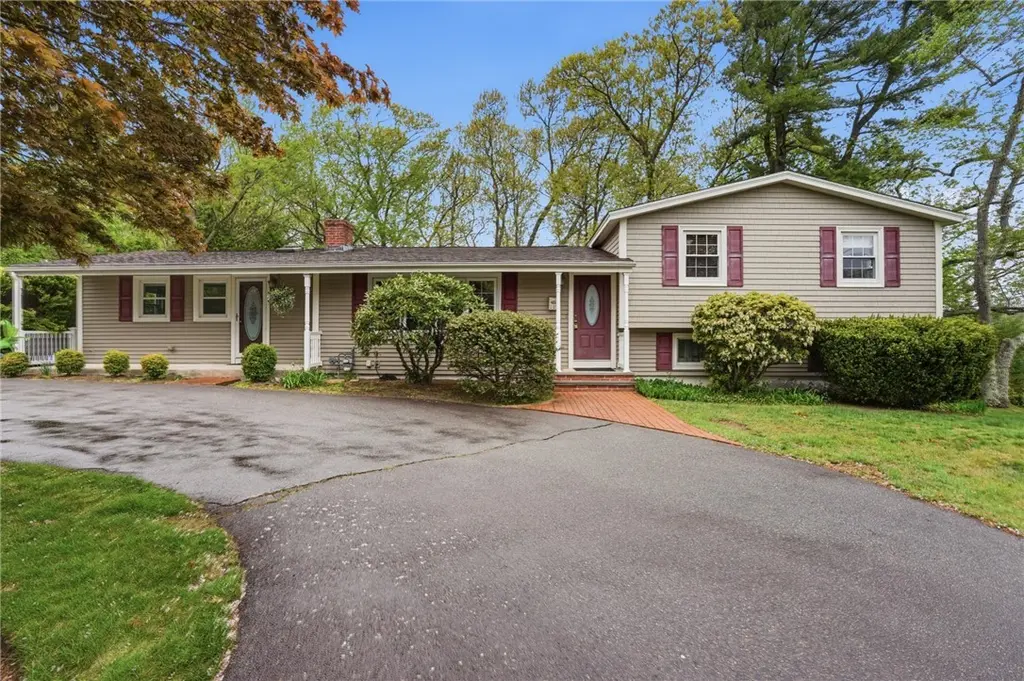
135 Red Chimney Dr · Warwick, RI
Flood risk 1/10 · Minimal
- FEMA flood zone
- X (unshaded)
- Chance of flooding over 30 yrs
- 0.0%
- Est. flood insurance / yr
- $473 – $860
Fire risk 1/10 · Minimal
- Est. fire insurance / yr
- $835 – $1,551
Heat risk 5/10 · Moderate
- Hot days now (above 96°F)
- 7 days/yr
- Hot days in 30 yrs
- 16 days/yr
Wind risk 7/10 · Major
- Chance of severe wind over 30 yrs
- 78.0%
Air-quality risk 2/10 · Minimal
- Unhealthy air days now
- 2 days/yr
- Unhealthy air days in 30 yrs
- 2 days/yr
Risk factors via First Street. Map © Google.
Why this score? — see what drove the C- grade
The composite is a weighted blend of 9 inputs, each scored 0–100. Each bar is that input's sub-score; the figure is the points it added to the 100-point composite (weight × sub-score).
- Cash flow +23.1/30.0
- DSCR +7.4/10.0
- 1% rule +5.6/10.0
- ARV discount +5.4/15.0
- Livability +3.9/5.0
- Rent growth +2.5/5.0
- Condition / age +2.5/5.0
- Schools +2.2/10.0
- Appreciation +0.0/10.0
$650,000
🖨 Deal sheet 📄 Offer letter ✓ Due diligence
Listing remarks
Welcome to 135 Red Chimney Drive, nestled in the highly desirable Cowesett neighborhood. This well maintained split-level home offers 4 bedrooms and 3 full bathrooms, providing a flexible layout ideal for a variety of living needs. The main level features a bright, light-filled kitchen, a formal dining room, and a spacious living room with a cozy fire place - perfect for relaxing or entertaining. A first-floor bedroom or den, along with a full bathroom and convenient laundry area, adds versatility and ease of living. Upstairs, you will find a second bedroom, a generous size primary bedroom, and a full bathroom. The lower level offers even more living space with a family room, an additional
Key facts
- Newly built deck
- Hardwood floors
- 0.36 acre lot
Tags
Property features AI
Finance
- HOA & community: Community amenities include golf, marina, public transportation access, recreation areas, restaurants, shopping, nearby hospital and schools, and highway access
Exterior
- Parking: No garage; Space for 6 vehicles (total parking)
- Utilities: Electric service: 100 amp; Septic tank; Connected water
- Home design: 3-story building; Above-grade finished living area present
- Construction: Vinyl siding with drywall interior; Concrete perimeter foundation; Built components arranged across 3 stories
- Exterior features: Deck; Paved driveway; Fenced yard; Corner lot
Interior
- Kitchen: Oven; Range; Refrigerator; Dishwasher
- Bedrooms: Total of 9 rooms (bedroom count not specified); Basement provides additional interior space (full, unfinished, interior entry)
- Flooring: Hardwood flooring; Ceramic tile flooring
- Bathrooms: 3 full bathrooms
- Heating & cooling: Forced air heating (gas); Central air conditioning
- Interior features: Skylights and skylight windows; Thermal windows; Tub with shower
- Laundry & utility: Washer; Dryer; Gas water heater; Water heater
Neighborhood map
What this means for you Summary
Snapshot
- This is a 4-bed/3.0-bath single-family listed at $650k.
Deal economics
- At list price, monthly cash flow is $1k ($14k/yr) — positive.
- The deal already cash-flows at list — no discount required.
- Meets the 1% rule at list price ($7k rent vs $650k).
- Recommended offer: $630k (3.0% below list) — sets the bar for market timing.
- Cap rate 8.4% vs local median 3.7% in Warwick — top-decile yield for the area; either an underpriced asset or a hidden risk that comps aren't pricing in. Stress-test before assuming the spread holds.
Location & tenants
- Location reads 78/100 on livability (#6 in RI, #2,425 nationally) — a middle-class / working-renter tenant base. Strengths: crime A+, commute A+, housing A+; Watch: schools D+, amenities F.
- Warwick (urban): math 15% / reading 32% proficiency, ranked #25 of 39 in RI (top 64%) — low school quality limits family demand, transient renter base, plan for 1-2y turnover.
- Market conditions: 118 active listings in the ZIP; 2 comparable units currently listed for rent nearby; 471 units permitted in Kent County in 2024 (240 in 5+ unit buildings).
Forward outlook
- Local home prices are declining (-3.0%/yr); year-one equity from $4k of loan paydown is wiped out by about $20k of value loss. Plan a longer hold.
- Kent County population projected at -14% by 2050 — secular population decline; favor cash flow + early exit over multi-decade hold.
Negotiation context
- It's been on market 33 days — a 3% lower offer ($630k) is reasonable based on typical stale-listing flexibility.
- 5 sale attempts since 20y ago with the ask held roughly flat each time — persistent listings suggest the price (not the market) is what's stuck; bring a comps-based counter.
- Current owner paid $335k; list at $650k implies a 94% gain — meaningful room to come down on a strong offer.
Risks & watch-outs
- Climate carrying-cost: major wind risk, 78% chance of damaging wind over 30y; extreme-heat days projected 7→16/yr by 2055 (HVAC capex compounding) — expect insurance premiums to compound above CPI over the hold.
Questions for the listing agent
- It's been on market 33 days. Have you received any prior offers? Is the seller open to a 3% concession, seller financing, or rate buy-down credit?
- Built in 1963 — when were the roof, HVAC, electrical panel, plumbing, and water heater last replaced?
- Is there a deadline driving the sale (1031 exchange, divorce, estate, relocation)? That informs how much negotiation room exists.
- Schools are D-rated, which usually means shorter tenancies and higher turnover. Who's the typical renter profile here, and what's been the actual vacancy rate?
- What's the average days-on-market for RENTAL listings here right now (not sales)? A rising rental-DOM trend means longer vacancies and softer asking-rent achievability than the comps imply.
- What's the recent tenant-quality profile in this submarket — average credit score on applications, eviction rate, late-payment / NSF rate, and stable-employment percentage? A property-management company in the area should have these aggregated.
- How much new for-sale + rental construction is in the pipeline within 1–3 miles? Heavy new supply typically softens prices + rents 12–24 months out; constrained supply supports both.
Investment metrics
- 1% rule
- 1.06% ✓
- Cap rate
- 8.44%
- Cash-on-cash
- 7.66%
- DSCR
- 1.34
- GRM
- 7.9
CMA / ARV
- ARV (on-the-fly)
- $621,264
- Comps found
- 12
Show comp detail 12 sales within ~0.75 mi
| Address | Dist | Beds/Ba | Sqft | Sold | Price | $/sf | Match |
|---|---|---|---|---|---|---|---|
| 189 Cowesett Rd | 0.35mi | 3/2.5 (-1) | 1,790 (-1%) | 6mo | $700,000 | $391 | 70 |
| 97 Cowesett Rd | 0.44mi | 3/2.0 (-1) | 1,815 (+0%) | 8mo | $615,000 | $339 | 63 |
| 170 Cowesett Rd | 0.33mi | 3/2.0 (-1) | 1,690 (-6%) | 3mo | $650,000 | $385 | 62 |
| 57 Ladderlook Rd | 0.38mi | 3/1.5 (-1) | 1,734 (-4%) | 8mo | $508,000 | $293 | 58 |
| 44 Oldham St | 0.50mi | 3/2.5 (-1) | 1,713 (-5%) | 4mo | $699,900 | $409 | 58 |
| 247 Love Ln | 0.18mi | 3/2.0 (-1) | 1,585 (-12%) | 12mo | $615,000 | $388 | 52 |
| 61 Bruce Ln | 0.22mi | 3/2.5 (-1) | 2,040 (+13%) | 13mo | $700,000 | $343 | 50 |
| 11 Highland Ave | 0.58mi | 3/2.5 (-1) | 1,722 (-5%) | 13mo | $592,500 | $344 | 48 |
| 23 Bokar St | 0.61mi | 3/2.0 (-1) | 1,874 (+4%) | 11mo | $625,000 | $334 | 47 |
| 3 Tivoli Ct | 0.45mi | 3/2.5 (-1) | 1,960 (+8%) | 18mo | $550,000 | $281 | 42 |
| 407 Red Chimney Dr | 0.44mi | 3/2.0 (-1) | 1,564 (-13%) | 10mo | $635,000 | $406 | 40 |
| 204 Shenandoah Rd | 0.51mi | 3/2.0 (-1) | 1,585 (-12%) | 21mo | $457,000 | $288 | 29 |
Match score weights: distance 35% · size 25% · config 20% · recency 20%. Top-matched comps best support the ARV.
Projected returns pro-forma
-3.0% appreciation · 3.0% rent growth · sell at horizon
- IRR
- -4.6%
- Equity multiple
- 0.83×
- Total profit
- $-31,410
- Equity at exit
- $96,917
- IRR
- 5.1%
- Equity multiple
- 1.37×
- Total profit
- $67,731
- Equity at exit
- $56,200
Cash invested: $182,000 (down + closing). Projections, not guarantees.
Landlord ↔ Tenant lean methodology
- Overall (STATE)
- 31 Tenant-Leaning
- State Rhode Island
- 31 Tenant-Leaning · D+8
- County
- — inherits STATE
- City
- — inherits STATE
ZIP-level market 02886
- Active inventory
- 118
- Price-to-rent
- 7.9×
Monthly cashflow live
- Estimated rent
- $6,869 medium interval (Pro) →
- Mortgage (P&I)
- −$3,409
- Tax from tax record
- −$586 /mo · $7,035/yr
- Insurance
- −$271
- HOA
- −$0
- Vacancy / Maint / Mgmt
- −$1,443
- Net cashflow
- $1,161
Break-even live
UW: 25.0% down · 7.5% · 30yr · 1.5% tax · 5.0% vac · 8.0% maint · 8.0% mgmt
Financing live
Cash to close
- Down payment
- $162,500
- Closing costs
- $19,500
- Reserves months
- —
- Total cash needed
- —
Loan-product check · same deal, 3 products live
Conventional
25% down · 7.5% · 30yr
- Down + closing
- —
- Monthly P&I
- —
- Monthly cashflow
- —
- DSCR
- —
- Eligible?
- —
Personal DTI + credit; lowest rate.
DSCR
20% down · 8.5% · 30yr
- Down + closing
- —
- Monthly P&I
- —
- Monthly cashflow
- —
- DSCR
- —
- Eligible?
- —
No personal income docs; deal must DSCR.
Hard money
10% down · 12.0% · 12mo
- Down + closing
- —
- Monthly P&I
- —
- Monthly cashflow
- —
- DSCR
- —
- Eligible?
- —
Short-term bridge; refi at stabilization.
Rent comps 2 comps
| Address | Beds | Baths | Sqft | Rent | $/sqft | DOM | Units | Dist |
|---|---|---|---|---|---|---|---|---|
| 47 Arnolds Neck Dr Warwick, RI | 3.0 | 3.5 | 2400 | $7,500 | $3.12 | 43d | 1 | 0.96mi |
| 40 Duane St East Greenwich, RI | 5.0 | 2.0 | 2500 | $6,000 | $2.40 | 2d | 1 | 1.27mi |
Listing history 28 events
-
2026-06-18days on market $650,000 Active 33 DOM
-
2026-06-17days on market $650,000 Active 32 DOM
-
2026-06-16days on market $650,000 Active 31 DOM
-
2026-06-15days on market $650,000 Active 30 DOM
-
2026-06-13days on market $650,000 Active 28 DOM
-
2026-06-09days on market $650,000 Active 24 DOM
-
2026-06-08days on market $650,000 Active 23 DOM
-
2026-06-07days on market $650,000 Active 22 DOM
-
2026-06-03pricedays on market $650,000 Active 18 DOM
-
2026-06-02days on market $675,000 Active 17 DOM
-
2026-06-01days on market $675,000 Active 16 DOM
-
2026-05-31days on market $675,000 Active 15 DOM
-
2026-05-11$675,000 Active
-
2016-11-08price $379,900
-
2016-11-08price $369,900
-
2010-12-30soldstatus $335,000
-
2010-10-26historical
-
2010-08-23$349,900
-
2007-09-17soldstatus $365,000
-
2007-09-17soldstatus $365,000
-
2007-09-17soldstatus $365,000
-
2007-04-01$369,900
-
2007-04-01historical
-
2007-03-31historical
-
2007-01-05$374,900
-
2007-01-05historical
-
2006-01-05$399,900
-
1990-12-13soldstatus $159,000
ⓘ Source: listings_history table (triggers on properties + properties_extension) + one-shot
backfill from property_details.listing_events for pre-trigger history.
Tax reassessment forecast RI · Partial reset (capped growth)
- Current annual tax
- $7,035 · $586/mo
- Projected year-2 tax
- $8,815 · $735/mo
- Expected delta
- +$1,780/yr (+$148/mo · 25.3%)
ⓘ Screening estimate from a state-policy table — verify with the county assessor before closing.
Climate risk First Street
- Flood 1/10 Low FEMA zone X (unshaded) · 0% chance over 30 yrs
- Wildfire 1/10 Low
- Heat 5/10 Major 7 d/yr ≥96°F today · 16 d/yr by 30 yrs out
- Wind 7/10 Severe 78% chance of damaging wind over 30 yrs
- Air quality 2/10 Low 2 unhealthy d/yr today · 2 by 30 yrs out
Nearby sold comps map
Loading sold comps map…
Walkable amenities ~0.75 mi
Loading nearby amenities…
Taxation est. · year 1
- Rental income
- $82,434
- − Mortgage interest
- −$36,410
- − Property taxes
- −$7,035
- − Insurance
- −$3,250
- − Repairs & maintenance
- −$6,595
- − Management
- −$6,595
- − Depreciation
- −$18,909
- Taxable income
- $3,640
- Est. tax owed @ 24.0%
- −$874
- After-tax cash flow
- $13,060/yr
For passive investors: Depreciation is non-cash, so a rental often shows a tax loss while cash-flowing — sheltering income. Rental losses are passive: they offset passive income freely, and up to $25,000/yr can offset ordinary (W-2) income if you actively participate and your MAGI is under $100k (phasing out to $0 by $150k); unused losses carry forward. On sale, claimed depreciation is recaptured at up to 25%, and gains may owe capital-gains tax (a 1031 exchange can defer both). Figures are a year-1 estimate at your 24.0% rate — not tax advice; consult a CPA.
Schools (NCES district)
- District
- Warwick
- NCES district ID
- 4401110
- Math proficiency
- 15% ▼ -11.00%
- Reading proficiency
- 32% ▼ -7.00%
- Median HH income
- $63,420
- Composite
- 22.03/100
- National rank
- #8203
- State rank
- #25 of 39 in RI
Livability — Warwick
- Score
- 78/100
- State rank
- #6
- US rank
- #2425
Category grades
Schools grade is shown separately in the Schools card above.
Census & demographics
- Census place
- Warwick, RI
- City population
- 108,434
- Population (ZIP)
- 30,925
Population outlook (Kent County) Hauer SSP2
- Today (2025)
- 160,994 people
- By 2030
- 157,428 · -2.2%
- By 2040
- 148,389 · -7.8%
- By 2050
- 137,995 · -14.3%
- By 2075
- 118,536 · -26.4%
- By 2100
- 102,266 · -36.5%
Race, ethnicity, and origin ACS 2023
- Neighborhood character
- Predominantly White (85%)
- Race & ethnicity
- White 85% Two or more races 6% Hispanic / Latino 5% Asian 4% Black 2%
- Common ancestry
- Lithuanian 8% Russian 7% Romanian 3%
- Foreign-born
- 7% · Canada
- Languages at home
- 91% English-only · Spanish 2% Other Asian/Pacific 2% Other Indo-European 2%
Political lean MEDSL · Kent
- 2024 margin
- Toss-up / Even · D 49.9% · R 48.1% · Other 2.0%
- 2008→2024 swing
- -15.6pp toward R · 2008: 17.5pp · 2024: 1.9pp
- All cycles
- 2024: D+1.9 2020: D+7.6 2016: R+0.7 2012: D+18.4 2008: D+17.5
Not yet ingested
- Civics
- —
Market trends
- HPI YoY
- ▼ -425.54%
- Current HPI
- 350.8111
- Rent YoY
- —
- Metro
- —
- State GDP YoY
- ▲ 2.25%
- F500 in state
- 10
Industry mix (Fortune 500 HQ in RI)
| Industry | F500 HQs | Revenue |
|---|---|---|
| Healthcare | 1 | $373B |
|
||
| Food Distribution | 1 | $31B |
|
||
| Aerospace / Defense | 1 | $14B |
|
||
| Financial Services | 1 | $8B |
|
||
| Consumer Goods | 1 | $4B |
|
||
Price history
+324.5% since first listed16 events — show timeline
- 2026-05-11 Listed $675,000 RIS
- 2016-11-08 Price Changed $369,900 RIS
- 2016-11-08 Price Changed $379,900 RIS
- 2010-12-30 Sold (MLS) $335,000 RIS
- 2010-10-26 Listing Removed — RIS
- 2010-08-23 Listed $349,900 RIS
- 2007-09-17 Sold (Public Records) $365,000 Public Records
- 2007-09-17 Sold (Public Records) $365,000 Public Records
- 2007-09-17 Sold (MLS) $365,000 RIS
- 2007-04-01 Listed $369,900 RIS
- 2007-04-01 Listing Removed — RIS
- 2007-03-31 Listing Removed — RIS
- 2007-01-05 Listed $374,900 RIS
- 2007-01-05 Listing Removed — RIS
- 2006-01-05 Listed $399,900 RIS
- 1990-12-13 Sold (Public Records) $159,000 Public Records
Property tax history
+1.6%/yrLatest (2025): $7,035 · -6.1% YoY. Source: county tax records.
Cash-flow waterfall
monthlySold comps — $/sqft
last 12 mo · ≤1 miLoading sold comps…