 Multi-family
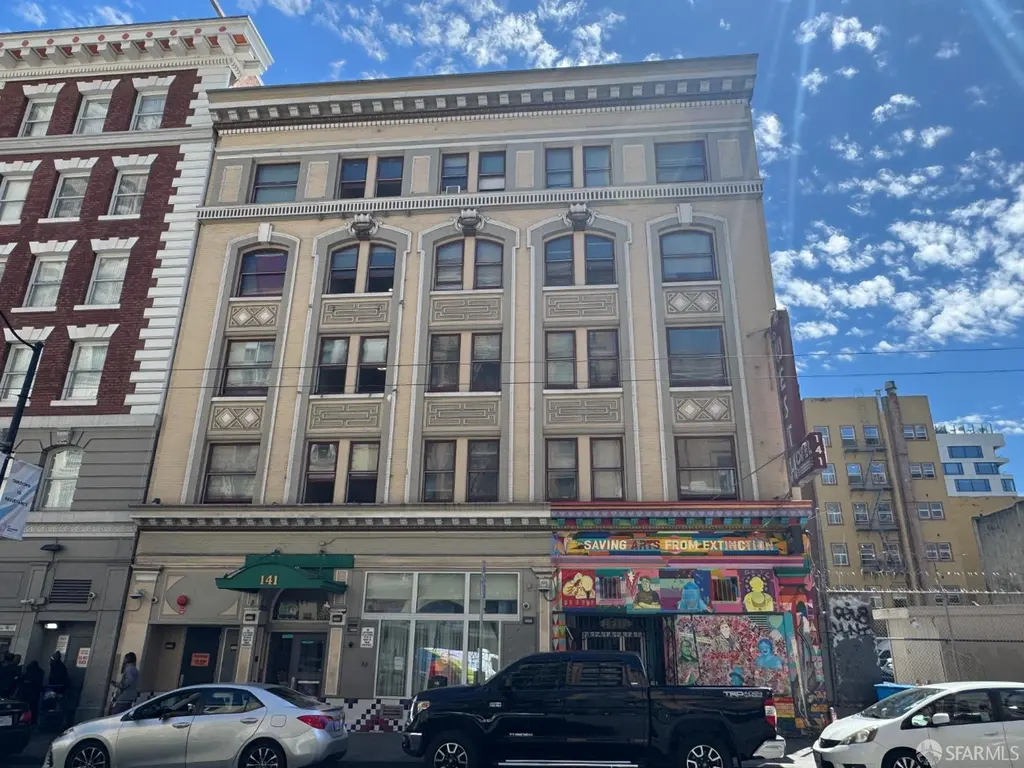
141 Eddy St · San Francisco, CA
Flood risk No data
- FEMA flood zone
- —
- Chance of flooding over 30 yrs
- —
- Est. flood insurance / yr
- —
Fire risk No data
- Est. fire insurance / yr
- —
Heat risk No data
- Hot days now (above threshold)
- —
- Hot days in 30 yrs
- —
Wind risk No data
- Chance of severe wind over 30 yrs
- —
Air-quality risk No data
- Unhealthy air days now
- —
- Unhealthy air days in 30 yrs
- —
Risk factors via First Street. Map © Google.
Why this score? — see what drove the B+ grade
The composite is a weighted blend of 9 inputs, each scored 0–100. Each bar is that input's sub-score; the figure is the points it added to the 100-point composite (weight × sub-score).
- Cash flow +30.0/30.0
- 1% rule +10.0/10.0
- DSCR +10.0/10.0
- ARV discount +7.5/15.0
- Appreciation +7.4/10.0
- Rent growth +5.0/5.0
- Schools +5.0/10.0
- Livability +3.8/5.0
- Condition / age +1.0/5.0
$6,500,000
🖨 Deal sheet 📄 Offer letter ✓ Due diligence
Multi-family units
County records classify this as Multi-Family (5+ Unit). Listing-text estimate: 1 unit. estimate disagrees with records
5+ unit building — per-unit beds/baths from public records are typically unavailable; the breakdown below (if shown) is an estimate from the listing text.
Listing remarks MLS
141 Eddy Street presents a rare opportunity to acquire a large-scale mixed-use residential asset in the heart of San Francisco's Tenderloin neighborhood. The property consists of one hundred seven (107) units, primarily configured as SRO housing with a mix of supportive housing programs, along with one (1) ground-floor commercial space, offering a diversified and stable income stream. Originally constructed in 1907, the building features classic San Francisco architecture paired with efficient unit layouts designed to maximize functionality. Many units benefit from consistent natural light and straightforward floor plans, while the property's scale and configuration support ongoing operations as a service-oriented residential community. The asset has historically operated as supportive housing, similar to the West Hotel model, providing residents with access to essential services while generating reliable income through subsidies and program-based revenue streams. The property is centrally located near Civic Center, Union Square, and major transportation corridors including Market Street and Van Ness Avenue, placing tenants within immediate proximity to public transit, employment centers, and neighborhood amenities. This highly accessible location continues to benefit from both public and private investment, reinforcing long-term demand for centrally located, service-enriched housing options. 141 Eddy Street offers investors a compelling value-add opportunity through operational optimization and rent growth potential. With in-place rents significantly below market levels and expenses that can be streamlined relative to historical operations, a new owner can unlock substantial upside while maintaining the property's role within San Francisco's critical housing ecosystem.
Key facts
- Employment centers
- Centrally located
- 7,562 sq ft lot
Tags
Neighborhood map
What this means for you Summary
Snapshot
- This is a multifamily listed at $6.50M. Condition is rated poor.
Deal economics
- At list price, monthly cash flow is $169k ($2.03M/yr) — positive.
- The deal already cash-flows at list — no discount required.
- Meets the 1% rule at list price ($271k rent vs $6.50M).
- Recommended offer: $6.30M (3.0% below list) — sets the bar for market timing.
- Cap rate 37.5% vs local median 2.1% in San Francisco — top-decile yield for the area; either an underpriced asset or a hidden risk that comps aren't pricing in. Stress-test before assuming the spread holds.
Location & tenants
- Location reads 76/100 on livability (#90 in CA, #3,143 nationally) — a middle-class / working-renter tenant base. Strengths: amenities A+, commute A+, employment A+; Watch: crime F, cost of living F.
- San Francisco Unified (urban): math 50% / reading 56% proficiency, ranked #322 of 1,400 in CA (top 23%) — acceptable for families but not a draw, mixed tenant base, ~2y average lease.
- Market conditions: Rents rising fast (+10.1%/yr); 63 active listings in the ZIP; 750 units permitted in San Francisco County in 2024 (688 in 5+ unit buildings).
- At $270,554/mo this rent would consume 5372% of the median local household income ($60k/yr) (locally 3769% of renters already pay >50% of income on rent) — very limited rent-growth headroom before tenants either downsize or default.
Forward outlook
- In year one you build about $357k of equity ($45k loan paydown + $312k appreciation (4.8% local appreciation)).
- San Francisco County population projected at +39% by 2050 — long-run rental-demand tailwind backs the buy-and-hold thesis.
- At projected returns (4.8% appreciation + 8.0% rent growth), your $1.82M cash investment doubles in ~1 year — after that, you're playing with house money.
- By year 2, paydown + projected appreciation supports a ~$572k cash-out refi (75% LTV) — recoverable capital for the next deal without selling this one.
Negotiation context
- It's been on market 56 days — a 3% lower offer ($6.30M) is reasonable based on typical stale-listing flexibility.
Risks & watch-outs
- Watch-outs: built in 1907 — expect roof / HVAC / electrical / plumbing capex.
Questions for the listing agent
- It's been on market 56 days. Have you received any prior offers? Is the seller open to a 3% concession, seller financing, or rate buy-down credit?
- Have any recent inspections been done? Can we get a copy of the seller's disclosures and any deferred-maintenance estimates?
- Built in 1907 — when were the roof, HVAC, electrical panel, plumbing, and water heater last replaced?
- Is there a deadline driving the sale (1031 exchange, divorce, estate, relocation)? That informs how much negotiation room exists.
- Schools are B-rated — typically a magnet for longer-tenancy family renters. What's the average tenant stay here, and is there a school-zone premium baked into asking?
- Crime grade is F in this area — have there been break-ins, vandalism, or insurance claims at this property in the last 3 years? What carrier currently insures it and at what premium?
- What's the average days-on-market for RENTAL listings here right now (not sales)? A rising rental-DOM trend means longer vacancies and softer asking-rent achievability than the comps imply.
- What's the recent tenant-quality profile in this submarket — average credit score on applications, eviction rate, late-payment / NSF rate, and stable-employment percentage? A property-management company in the area should have these aggregated.
- How much new apartment / multifamily construction is in the pipeline within 1–3 miles? Heavy new supply (>2% of stock underway) typically softens rents 12–24 months out; light construction supports rent growth.
Investment metrics
- 1% rule
- 4.16% ✓
- Cap rate
- 37.46%
- Cash-on-cash
- 111.31%
- DSCR
- 5.95
- GRM
- 2.0
CMA / ARV
- ARV (median comp)
- $13,683,218
- List price
- $6,500,000
- Delta
- -52.50%
- Verdict
- UNDERPRICED
- Comps
- 7 within 1.0 mi
Show comp detail 3 sales within ~0.75 mi
| Address | Dist | Beds/Ba | Sqft | Sold | Price | $/sf | Match |
|---|---|---|---|---|---|---|---|
| 565 Geary St | 0.23mi | 19/— | 37,796 (-4%) | 1mo | $9,225,000 | $244 | 81 |
| 610 Polk St | 0.50mi | —/— | 35,400 (-10%) | 16mo | $7,700,000 | $218 | 45 |
| 935 Geary St | 0.49mi | 1/— | 44,440 (+12%) | 21mo | $9,050,000 | $204 | 39 |
Match score weights: distance 35% · size 25% · config 20% · recency 20%. Top-matched comps best support the ARV.
Projected returns pro-forma
4.8% appreciation · 8.0% rent growth · sell at horizon
- IRR
- —
- Equity multiple
- 8.48×
- Total profit
- $13,609,085
- Equity at exit
- $3,603,621
- IRR
- —
- Equity multiple
- 20.41×
- Total profit
- $35,320,235
- Equity at exit
- $6,154,327
Cash invested: $1,820,000 (down + closing). Projections, not guarantees.
Landlord ↔ Tenant lean methodology
- Overall (CITY)
- 0 Strongly Tenant-Friendly
- State California
- 18 Strongly Tenant-Friendly · D+13
- County
- — inherits STATE
- City San Francisco
- 0 Strongly Tenant-Friendly · D+57
ZIP-level market 94102
- Home prices YoY
- 2.7%
- Rents YoY
- 10.1%
- Active inventory
- 63
- Price-to-rent
- 214.2×
Monthly cashflow live
- Estimated rent
- $270,554 high interval (Pro) →
- Mortgage (P&I)
- −$34,087
- Tax est. 1.5%
- −$8,125 /mo · $97,500/yr
- Insurance
- −$2,708
- HOA
- −$0
- Vacancy / Maint / Mgmt
- −$56,816
- Net cashflow
- $168,818
Break-even live
107-unit breakdown (identical units grouped — click to expand)
| Units | Beds | Baths | Est. rent |
|---|---|---|---|
| 107× units | 1 | 1 | $270,603 |
| #1 | 1 | 1 | $2,529 |
| #2 | 1 | 1 | $2,529 |
| #3 | 1 | 1 | $2,529 |
| #4 | 1 | 1 | $2,529 |
| #5 | 1 | 1 | $2,529 |
| #6 | 1 | 1 | $2,529 |
| #7 | 1 | 1 | $2,529 |
| #8 | 1 | 1 | $2,529 |
| #9 | 1 | 1 | $2,529 |
| #10 | 1 | 1 | $2,529 |
| #11 | 1 | 1 | $2,529 |
| #12 | 1 | 1 | $2,529 |
| #13 | 1 | 1 | $2,529 |
| #14 | 1 | 1 | $2,529 |
| #15 | 1 | 1 | $2,529 |
| #16 | 1 | 1 | $2,529 |
| #17 | 1 | 1 | $2,529 |
| #18 | 1 | 1 | $2,529 |
| #19 | 1 | 1 | $2,529 |
| #20 | 1 | 1 | $2,529 |
| #21 | 1 | 1 | $2,529 |
| #22 | 1 | 1 | $2,529 |
| #23 | 1 | 1 | $2,529 |
| #24 | 1 | 1 | $2,529 |
| #25 | 1 | 1 | $2,529 |
| #26 | 1 | 1 | $2,529 |
| #27 | 1 | 1 | $2,529 |
| #28 | 1 | 1 | $2,529 |
| #29 | 1 | 1 | $2,529 |
| #30 | 1 | 1 | $2,529 |
| #31 | 1 | 1 | $2,529 |
| #32 | 1 | 1 | $2,529 |
| #33 | 1 | 1 | $2,529 |
| #34 | 1 | 1 | $2,529 |
| #35 | 1 | 1 | $2,529 |
| #36 | 1 | 1 | $2,529 |
| #37 | 1 | 1 | $2,529 |
| #38 | 1 | 1 | $2,529 |
| #39 | 1 | 1 | $2,529 |
| #40 | 1 | 1 | $2,529 |
| #41 | 1 | 1 | $2,529 |
| #42 | 1 | 1 | $2,529 |
| #43 | 1 | 1 | $2,529 |
| #44 | 1 | 1 | $2,529 |
| #45 | 1 | 1 | $2,529 |
| #46 | 1 | 1 | $2,529 |
| #47 | 1 | 1 | $2,529 |
| #48 | 1 | 1 | $2,529 |
| #49 | 1 | 1 | $2,529 |
| #50 | 1 | 1 | $2,529 |
| #51 | 1 | 1 | $2,529 |
| #52 | 1 | 1 | $2,529 |
| #53 | 1 | 1 | $2,529 |
| #54 | 1 | 1 | $2,529 |
| #55 | 1 | 1 | $2,529 |
| #56 | 1 | 1 | $2,529 |
| #57 | 1 | 1 | $2,529 |
| #58 | 1 | 1 | $2,529 |
| #59 | 1 | 1 | $2,529 |
| #60 | 1 | 1 | $2,529 |
| #61 | 1 | 1 | $2,529 |
| #62 | 1 | 1 | $2,529 |
| #63 | 1 | 1 | $2,529 |
| #64 | 1 | 1 | $2,529 |
| #65 | 1 | 1 | $2,529 |
| #66 | 1 | 1 | $2,529 |
| #67 | 1 | 1 | $2,529 |
| #68 | 1 | 1 | $2,529 |
| #69 | 1 | 1 | $2,529 |
| #70 | 1 | 1 | $2,529 |
| #71 | 1 | 1 | $2,529 |
| #72 | 1 | 1 | $2,529 |
| #73 | 1 | 1 | $2,529 |
| #74 | 1 | 1 | $2,529 |
| #75 | 1 | 1 | $2,529 |
| #76 | 1 | 1 | $2,529 |
| #77 | 1 | 1 | $2,529 |
| #78 | 1 | 1 | $2,529 |
| #79 | 1 | 1 | $2,529 |
| #80 | 1 | 1 | $2,529 |
| #81 | 1 | 1 | $2,529 |
| #82 | 1 | 1 | $2,529 |
| #83 | 1 | 1 | $2,529 |
| #84 | 1 | 1 | $2,529 |
| #85 | 1 | 1 | $2,529 |
| #86 | 1 | 1 | $2,529 |
| #87 | 1 | 1 | $2,529 |
| #88 | 1 | 1 | $2,529 |
| #89 | 1 | 1 | $2,529 |
| #90 | 1 | 1 | $2,529 |
| #91 | 1 | 1 | $2,529 |
| #92 | 1 | 1 | $2,529 |
| #93 | 1 | 1 | $2,529 |
| #94 | 1 | 1 | $2,529 |
| #95 | 1 | 1 | $2,529 |
| #96 | 1 | 1 | $2,529 |
| #97 | 1 | 1 | $2,529 |
| #98 | 1 | 1 | $2,529 |
| #99 | 1 | 1 | $2,529 |
| #100 | 1 | 1 | $2,529 |
| #101 | 1 | 1 | $2,529 |
| #102 | 1 | 1 | $2,529 |
| #103 | 1 | 1 | $2,529 |
| #104 | 1 | 1 | $2,529 |
| #105 | 1 | 1 | $2,529 |
| #106 | 1 | 1 | $2,529 |
| #107 | 1 | 1 | $2,529 |
| Total (107 units) | $270,554 | ||
UW: 25.0% down · 7.5% · 30yr · 1.5% tax · 5.0% vac · 8.0% maint · 8.0% mgmt
Financing live
Cash to close
- Down payment
- $1,625,000
- Closing costs
- $195,000
- Reserves months
- —
- Total cash needed
- —
Loan-product check · same deal, 3 products live
Conventional
25% down · 7.5% · 30yr
- Down + closing
- —
- Monthly P&I
- —
- Monthly cashflow
- —
- DSCR
- —
- Eligible?
- —
Personal DTI + credit; lowest rate.
DSCR
20% down · 8.5% · 30yr
- Down + closing
- —
- Monthly P&I
- —
- Monthly cashflow
- —
- DSCR
- —
- Eligible?
- —
No personal income docs; deal must DSCR.
Hard money
10% down · 12.0% · 12mo
- Down + closing
- —
- Monthly P&I
- —
- Monthly cashflow
- —
- DSCR
- —
- Eligible?
- —
Short-term bridge; refi at stabilization.
Listing history 15 events
-
2026-06-18days on market $6,500,000 Active 56 DOM
-
2026-06-17days on market $6,500,000 Active 55 DOM
-
2026-06-16days on market $6,500,000 Active 54 DOM
-
2026-06-15days on market $6,500,000 Active 53 DOM
-
2026-06-13days on market $6,500,000 Active 51 DOM
-
2026-06-13days on market $6,500,000 Active 50 DOM
-
2026-06-09days on market $6,500,000 Active 47 DOM
-
2026-06-08days on market $6,500,000 Active 46 DOM
-
2026-06-07days on market $6,500,000 Active 45 DOM
-
2026-06-04days on market $6,500,000 Active 42 DOM
-
2026-06-03days on market $6,500,000 Active 41 DOM
-
2026-06-02days on market $6,500,000 Active 40 DOM
-
2026-06-01days on market $6,500,000 Active 39 DOM
-
2026-05-31days on market $6,500,000 Active 38 DOM
-
2026-04-23$6,500,000 Active 1800-char remark
Show marketing remark (1800 chars)
141 Eddy Street presents a rare opportunity to acquire a large-scale mixed-use residential asset in the heart of San Francisco's Tenderloin neighborhood. The property consists of one hundred seven (107) units, primarily configured as SRO housing with a mix of supportive housing programs, along with one (1) ground-floor commercial space, offering a diversified and stable income stream. Originally constructed in 1907, the building features classic San Francisco architecture paired with efficient unit layouts designed to maximize functionality. Many units benefit from consistent natural light and straightforward floor plans, while the property's scale and configuration support ongoing operations as a service-oriented residential community. The asset has historically operated as supportive housing, similar to the West Hotel model, providing residents with access to essential services while generating reliable income through subsidies and program-based revenue streams. The property is centrally located near Civic Center, Union Square, and major transportation corridors including Market Street and Van Ness Avenue, placing tenants within immediate proximity to public transit, employment centers, and neighborhood amenities. This highly accessible location continues to benefit from both public and private investment, reinforcing long-term demand for centrally located, service-enriched housing options. 141 Eddy Street offers investors a compelling value-add opportunity through operational optimization and rent growth potential. With in-place rents significantly below market levels and expenses that can be streamlined relative to historical operations, a new owner can unlock substantial upside while maintaining the property's role within San Francisco's critical housing ecosystem.
ⓘ Source: listings_history table (triggers on properties + properties_extension) + one-shot
backfill from property_details.listing_events for pre-trigger history.
Nearby sold comps map
Loading sold comps map…
Walkable amenities ~0.75 mi
Loading nearby amenities…
Taxation est. · year 1
- Rental income
- $3,246,648
- − Mortgage interest
- −$364,101
- − Property taxes
- −$97,500
- − Insurance
- −$32,500
- − Repairs & maintenance
- −$259,732
- − Management
- −$259,732
- − Depreciation
- −$189,091
- Taxable income
- $2,043,992
- Est. tax owed @ 24.0%
- −$490,558
- After-tax cash flow
- $1,535,253/yr
For passive investors: Depreciation is non-cash, so a rental often shows a tax loss while cash-flowing — sheltering income. Rental losses are passive: they offset passive income freely, and up to $25,000/yr can offset ordinary (W-2) income if you actively participate and your MAGI is under $100k (phasing out to $0 by $150k); unused losses carry forward. On sale, claimed depreciation is recaptured at up to 25%, and gains may owe capital-gains tax (a 1031 exchange can defer both). Figures are a year-1 estimate at your 24.0% rate — not tax advice; consult a CPA.
Condition & rehab AI · 2 photos
This multi-family property requires extensive exterior repairs and a complete renovation to improve its condition and value.
Repairs flagged
- Major exterior paint — Significant peeling and wear
- Major roof — No visible roof, but the exterior suggests a need for extensive repair
- Major exterior structure — Significant wear and tear
Value-add opportunities
- Both exterior paint — Fresh paint would improve curb appeal and property value
- Both roof repair — A new roof would significantly increase the property's value and functionality
- Both exterior renovation — A complete exterior renovation would improve the property's appearance and value
Renovation cost estimate screening
| Repair item | Severity | Est. cost |
|---|---|---|
| exterior paint · Significant peeling and wear | Major | $15,000–50,000 |
| roof · No visible roof, but the exterior suggests a need for extensive repair | Major | $15,000–50,000 |
| exterior structure · Significant wear and tear | Major | $15,000–50,000 |
| Total estimated repair cost · 3 items | $45,000–150,000 |
Value-add ROI direction
- Both exterior paint — Fresh paint would improve curb appeal and property value ↑
- Both roof repair — A new roof would significantly increase the property's value and functionality ↑
- Both exterior renovation — A complete exterior renovation would improve the property's appearance and value ↑
ⓘ Cost ranges are severity-bucket heuristics (US national rule-of-thumb). Get contractor quotes + a written scope before underwriting a rehab budget.
Schools (NCES district)
- District
- San Francisco Unified
- NCES district ID
- 0634410
- Math proficiency
- 50% ▬ 0.00%
- Reading proficiency
- 56% ▲ 1.00%
- Median HH income
- $81,249
- Composite
- 50.14/100
- National rank
- #4088
- State rank
- #322 of 1400 in CA
Livability — San Francisco
- Score
- 76/100
- State rank
- #90
- US rank
- #3143
Category grades
Schools grade is shown separately in the Schools card above.
Census & demographics
- Census place
- San Francisco, CA
- County
- San Francisco County · 827,552 people
- City population
- 827,552
- Metro
- San Francisco-Oakland-Berkeley, CA
- Population (ZIP)
- 35,976
- Household income
- $60,431
- Rent vs Own
- Severe rent burden
- 3769.0
Population outlook (San Francisco County) Hauer SSP2
- Today (2025)
- 1,030,936 people
- By 2030
- 1,110,409 · +7.7%
- By 2040
- 1,270,010 · +23.2%
- By 2050
- 1,435,001 · +39.2%
- By 2075
- 1,779,074 · +72.6%
- By 2100
- 1,966,767 · +90.8%
Race, ethnicity, and origin ACS 2023
- Neighborhood character
- Highly diverse neighborhood (Simpson 0.77)
- Race & ethnicity
- White 31% Asian 28% Hispanic / Latino 22% Two or more races 13% Black 9% Native American 2%
- Hispanic origin (detail)
- Mexican 15% Puerto Rican 1%
- Common ancestry
- Scotch-Irish 2% Romanian 2% Lithuanian 2%
- Foreign-born
- 41% · Canada, China, Vietnam
- Languages at home
- 52% English-only · Spanish 16% Chinese 10% Vietnamese 5%
Political lean MEDSL · San Francisco
- 2024 margin
- Solid D (+64.8) · D 80.3% · R 15.5% · Other 4.1%
- 2008→2024 swing
- -5.7pp toward R · 2008: 70.5pp · 2024: 64.8pp
- All cycles
- 2024: D+64.8 2020: D+72.5 2016: D+76.1 2012: D+70.2 2008: D+70.5
Not yet ingested
- Civics
- —
Market trends
- HPI YoY
- ▲ 4.80%
- Current HPI
- 184.4403
- Rent YoY
- ▲ 10.11%
- Metro
- San Francisco-Oakland-Berkeley, CA
- State GDP YoY
- ▲ 3.21%
- F500 in state
- 116
Industry mix (Fortune 500 HQ in CA)
| Industry | F500 HQs | Revenue |
|---|---|---|
| Technology | 27 | $1,492B |
|
||
| Financial Services | 3 | $174B |
|
||
| Retail | 3 | $44B |
|
||
| Insurance | 3 | $26B |
|
||
| Media / Entertainment | 2 | $115B |
|
||
| Pharmaceuticals / Biotech | 2 | $62B |
|
||
Price history
1 event — show timeline
- 2026-04-23 Listed $6,500,000 San Francisco MLS
Cash-flow waterfall
monthlySold comps — $/sqft
last 12 mo · ≤1 miLoading sold comps…