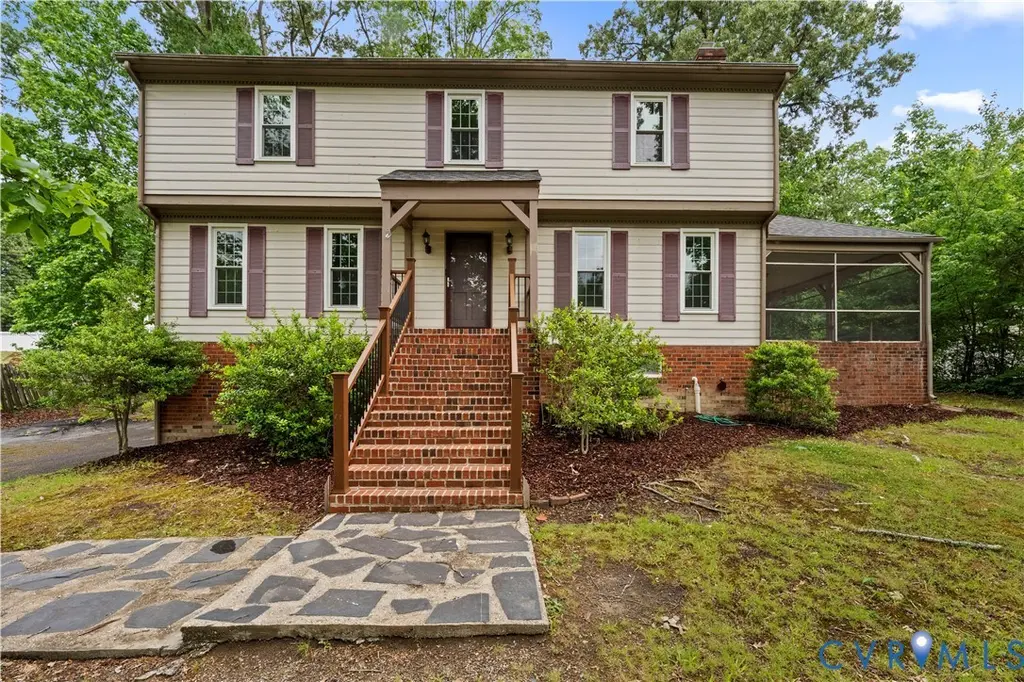
9200 Redbridge Rd · Manchester, VA
Flood risk 1/10 · Minimal
- FEMA flood zone
- X (unshaded)
- Chance of flooding over 30 yrs
- 0.0%
- Est. flood insurance / yr
- $473 – $860
Fire risk 1/10 · Minimal
- Est. fire insurance / yr
- $666 – $1,236
Heat risk 7/10 · Major
- Hot days now (above 104°F)
- 7 days/yr
- Hot days in 30 yrs
- 16 days/yr
Wind risk 5/10 · Moderate
- Chance of severe wind over 30 yrs
- 26.0%
Air-quality risk 2/10 · Minimal
- Unhealthy air days now
- 0 days/yr
- Unhealthy air days in 30 yrs
- 2 days/yr
Risk factors via First Street. Map © Google.
Why this score? — see what drove the D grade
The composite is a weighted blend of 9 inputs, each scored 0–100. Each bar is that input's sub-score; the figure is the points it added to the 100-point composite (weight × sub-score).
- Cash flow +13.4/30.0
- ARV discount +6.3/15.0
- Schools +5.2/10.0
- DSCR +4.1/10.0
- Livability +3.9/5.0
- Rent growth +3.4/5.0
- 1% rule +3.1/10.0
- Condition / age +2.5/5.0
- Appreciation +0.0/10.0
$399,900
🖨 Deal sheet (PDF) 📄 Offer letter ✓ Due diligence
Listing remarks
Full of charm, character & endless potential, this classic Colonial offers warm, inviting spaces that truly feel like home. Featuring 4 bedrooms, 3.5 baths & situated on over a third of an acre in convenient North Chesterfield just off the Arboretum, this home is brimming with opportunity for its next owner. The inviting family room centers around a beautiful brick hearth perfect for cozy nights by the fire, movie nights & holiday memories. Just off the family room, the massive screened porch & expansive deck create an ideal setup for barbecues, birthday parties, graduation celebrations & gatherings of all sizes. The formal dining room is generously sized &
Key facts
- 0.37 acre lot
- Garage
- Built 1973
Property features AI
Exterior
- Parking: Attached garage (1 car); Driveway parking; Off-street paved parking; Basement access to parking
- Utilities: Public water; Public sewer; Electric service
- Home design: Two-story home; Resale property; Composition roof; Brick, drywall, and wood siding construction; Below-grade finished area and unfinished area exist
- Construction: Built with brick, drywall, and wood siding; Composition roof
- Exterior features: Deck; Screened porch; Porch; Stoop; Paved driveway; Back yard fencing (fenced)
Interior
- Kitchen: Eat-in kitchen
- Bedrooms: Multiple bedrooms on second floor (including Bedroom 2, Bedroom 3, Bedroom 4)
- Flooring: Wood
- Bathrooms: Three full bathrooms; One half bathroom; Second-floor full bath with tub and shower; Basement full bath with shower
- Heating & cooling: Central air conditioning; Electric forced-air heating
- Interior features: Wood flooring; Dining area; Separate/formal dining room; Eat-in kitchen; Fireplace; Pantry; Walk-in closets
- Laundry & utility: Laundry room in basement; Electric water heater
Neighborhood map
What this means for you Summary
Snapshot
- This is a 4-bed/3.0-bath single-family listed at $400k.
Deal economics
- At list price, monthly cash flow is $11 ($128/yr) — positive.
- The deal already cash-flows at list — no discount required.
- To meet the 1% rule (rent ≥ 1% of price), the offer needs to be $325k (18.7% below list).
- Recommended offer: $325k (18.7% below list) — sets the bar for 1% rule.
- Cap rate 6.3% vs local median 4.8% in Manchester — top-decile yield for the area; either an underpriced asset or a hidden risk that comps aren't pricing in. Stress-test before assuming the spread holds.
Location & tenants
- Location reads 77/100 on livability (#101 in VA, #3,202 nationally) — a middle-class / working-renter tenant base. Strengths: housing A+, health & safety A+, cost of living B+; Watch: amenities D-, commute F.
- Chesterfield County Public School District (suburban): math 52% / reading 64% proficiency, ranked #57 of 131 in VA (top 44%) — acceptable for families but not a draw, mixed tenant base, ~2y average lease.
- Zoned schools: Reams Road Elementary (math 32% / reading 47%, grade F, #900 of 1,108 statewide, top 83%, 564 students, 82% FRL); Providence Middle (math 44% / reading 46%, grade D, #274 of 342 statewide, top 81%, 1,068 students, 79% FRL); Monacan High (math 49% / reading 86%, grade B, #183 of 319 statewide, top 58%, 1,631 students, 35% FRL) — zoned schools average 65% FRL vs 26% district-wide (39 pts higher); higher-poverty schools than district average — tighter screening recommended.
- Market conditions: Rents rising (+3.8%/yr); 152 active listings in the ZIP; 3 comparable units currently listed for rent nearby; rentals at typical pace (median 26d on market — plan ~3-4 weeks tenant-placement turnaround); high-income renter base; 2,307 units permitted in Chesterfield County in 2024 (462 in 5+ unit buildings).
- This rent runs 35% of the median local income ($110k/yr) — at the standard rent-burdened threshold; future hikes will face affordability resistance.
Forward outlook
- Local home prices are declining (-3.0%/yr); year-one equity from $3k of loan paydown is wiped out by about $12k of value loss. Plan a longer hold.
- Chesterfield County population projected at +20% by 2050 — long-run rental-demand tailwind backs the buy-and-hold thesis.
Negotiation context
- Only 14 days on market — expect competitive offers; lowballing is unlikely to land.
- Current owner paid $84k; list at $400k implies a 378% gain — meaningful room to come down on a strong offer.
Risks & watch-outs
- Climate carrying-cost: moderate wind risk, 26% chance of damaging wind over 30y; extreme-heat days projected 7→16/yr by 2055 (HVAC capex compounding) — expect insurance premiums to compound above CPI over the hold.
Questions for the listing agent
- Built in 1973 — when were the roof, HVAC, electrical panel, plumbing, and water heater last replaced?
- Is there a deadline driving the sale (1031 exchange, divorce, estate, relocation)? That informs how much negotiation room exists.
- Schools are A-rated — typically a magnet for longer-tenancy family renters. What's the average tenant stay here, and is there a school-zone premium baked into asking?
- The area grade is low — what's the realistic commute time and amenity access for the typical tenant pool here? Any planned neighborhood developments (good or bad) we should know about?
- What's the average days-on-market for RENTAL listings here right now (not sales)? A rising rental-DOM trend means longer vacancies and softer asking-rent achievability than the comps imply.
- What's the recent tenant-quality profile in this submarket — average credit score on applications, eviction rate, late-payment / NSF rate, and stable-employment percentage? A property-management company in the area should have these aggregated.
- How much new for-sale + rental construction is in the pipeline within 1–3 miles? Heavy new supply typically softens prices + rents 12–24 months out; constrained supply supports both.
Investment metrics
- 1% rule
- 0.81% ✗
- Cap rate
- 6.32%
- Cash-on-cash
- 0.11%
- DSCR
- 1.01
- GRM
- 10.3
CMA / ARV
- ARV (median comp)
- $389,907
- List price
- $399,900
- Delta
- 2.56%
- Verdict
- FAIR
- Comps
- 20 within 1.0 mi
Show comp detail 12 sales within ~0.75 mi
| Address | Dist | Beds/Ba | Sqft | Sold | Price | $/sf | Match |
|---|---|---|---|---|---|---|---|
| 9051 Redbridge Rd | 0.12mi | 4/2.5 | 2,305 (-11%) | 6mo | $411,950 | $179 | 69 |
| 9209 Groomfield Rd | 0.05mi | 4/2.5 | 2,208 (-15%) | 10mo | $415,000 | $188 | 63 |
| 142 Heppel Rd | 0.51mi | 5/3.0 (+1) | 2,676 (+3%) | 4mo | $449,000 | $168 | 62 |
| 440 Trickling Creek Rd | 0.47mi | 5/3.5 (+1) | 2,456 (-5%) | 6mo | $480,000 | $195 | 57 |
| 208 Chasnell Rd | 0.30mi | 5/3.0 (+1) | 2,238 (-14%) | 2mo | $380,000 | $170 | 57 |
| 110 Carbe Ct | 0.21mi | 5/3.0 (+1) | 2,238 (-14%) | 10mo | $370,000 | $165 | 54 |
| 8802 E Wadsworth Pl | 0.47mi | 4/3.5 | 2,381 (-8%) | 13mo | $415,000 | $174 | 52 |
| 121 Swanage Rd | 0.47mi | 4/2.5 | 2,314 (-11%) | 13mo | $410,000 | $177 | 47 |
| 9332 Becar Rd | 0.31mi | 5/3.0 (+1) | 2,238 (-14%) | 14mo | $350,000 | $156 | 46 |
| 101 Aldersmead Rd | 0.72mi | 4/2.5 | 2,450 (-5%) | 14mo | $408,500 | $167 | 43 |
| 225 Redmead Ln | 0.70mi | 5/3.5 (+1) | 2,765 (+7%) | 15mo | $475,000 | $172 | 37 |
| 8601 Claypool Rd | 0.69mi | 3/2.5 (-1) | 2,287 (-12%) | 7mo | $340,000 | $149 | 36 |
Match score weights: distance 35% · size 25% · config 20% · recency 20%. Top-matched comps best support the ARV.
Projected returns pro-forma
-3.0% appreciation · 3.78% rent growth · sell at horizon
- IRR
- -15.3%
- Equity multiple
- 0.45×
- Total profit
- $-61,630
- Equity at exit
- $59,626
- IRR
- -5.7%
- Equity multiple
- 0.62×
- Total profit
- $-42,395
- Equity at exit
- $34,576
Cash invested: $111,972 (down + closing). Projections, not guarantees.
Landlord ↔ Tenant lean methodology
- Overall (STATE)
- 55 Moderately Landlord-Leaning
- State Virginia
- 55 Moderately Landlord-Leaning · D+2
- County
- — inherits STATE
- City
- — inherits STATE
ZIP-level market 23236
- Rents YoY
- 3.8%
- Active inventory
- 152
- Price-to-rent
- 10.3×
Monthly cashflow live
- Estimated rent
- $3,250 medium interval (Pro) →
- Mortgage (P&I)
- −$2,097
- Tax from tax record
- −$293 /mo · $3,514/yr
- Insurance
- −$167
- HOA
- −$0
- Vacancy / Maint / Mgmt
- −$682
- Net cashflow
- $11
Break-even live
Sensitivity live
| Price | -10% $237 | -5% $124 | +0% $11 | +5% $-103 | +10% $-216 |
|---|---|---|---|---|---|
| Rent | -10% $-246 | -5% $-118 | +0% $11 | +5% $139 | +10% $267 |
| Rate | -1.0pp $212 | -0.5pp $112 | base $11 | +0.5pp $-93 | +1.0pp $-198 |
UW: 25.0% down · 7.5% · 30yr · 1.5% tax · 5.0% vac · 8.0% maint · 8.0% mgmt
Financing live
Cash to close
- Down payment
- $99,975
- Closing costs
- $11,997
- Reserves months
- —
- Total cash needed
- —
Loan-product check · same deal, 3 products live
Conventional
25% down · 7.5% · 30yr
- Down + closing
- —
- Monthly P&I
- —
- Monthly cashflow
- —
- DSCR
- —
- Eligible?
- —
Personal DTI + credit; lowest rate.
DSCR
20% down · 8.5% · 30yr
- Down + closing
- —
- Monthly P&I
- —
- Monthly cashflow
- —
- DSCR
- —
- Eligible?
- —
No personal income docs; deal must DSCR.
Hard money
10% down · 12.0% · 12mo
- Down + closing
- —
- Monthly P&I
- —
- Monthly cashflow
- —
- DSCR
- —
- Eligible?
- —
Short-term bridge; refi at stabilization.
Rent comps 3 comps
| Address | Beds | Baths | Sqft | Rent | $/sqft | DOM | Units | Dist |
|---|---|---|---|---|---|---|---|---|
| 8501 Woodward Dr North Chesterfield, VA | 4.0 | 2.0 | 1826 | $2,200 | $1.20 | 25d | 1 | 1.07mi |
| 8749 Bethany Creek Ave Unit 1546152P Richmond, VA | 5.0 | 2.0 | 2098 | $5,433 | $2.59 | 21d | 1 | 1.12mi |
| 610 Lemoine Ln North Chesterfield, VA | 4.0 | 2.0 | 1800 | $2,550 | $1.42 | 45d | 1 | 1.27mi |
Listing history 3 events
-
2026-05-14$399,900 Active 2098-char remark
-
2026-05-13historical $399,900 2098-char remark
-
1981-01-29soldstatus $83,600
ⓘ Source: listings_history table (triggers on properties + properties_extension) + one-shot
backfill from property_details.listing_events for pre-trigger history.
Tax reassessment forecast VA · Resets to sale price
- Current annual tax
- $3,514 · $293/mo
- Projected year-2 tax
- $3,514 · $293/mo
- Expected delta
- $0/yr ($0/mo · 0.0%)
ⓘ Screening estimate from a state-policy table — verify with the county assessor before closing.
Climate risk First Street
- Flood 1/10 Low FEMA zone X (unshaded) · 0% chance over 30 yrs
- Wildfire 1/10 Low
- Heat 7/10 Severe 7 d/yr ≥104°F today · 16 d/yr by 30 yrs out
- Wind 5/10 Major 26% chance of damaging wind over 30 yrs
- Air quality 2/10 Low 0 unhealthy d/yr today · 2 by 30 yrs out
Nearby sold comps map
Loading sold comps map…
Walkable amenities ~0.75 mi
Loading nearby amenities…
Taxation est. · year 1
- Rental income
- $38,996
- − Mortgage interest
- −$22,401
- − Property taxes
- −$3,514
- − Insurance
- −$2,000
- − Repairs & maintenance
- −$3,120
- − Management
- −$3,120
- − Depreciation
- −$11,633
- Taxable loss
- −$6,791
- Est. tax savings @ 24.0%
- +$1,630
- After-tax cash flow
- $1,758/yr
For passive investors: Depreciation is non-cash, so a rental often shows a tax loss while cash-flowing — sheltering income. Rental losses are passive: they offset passive income freely, and up to $25,000/yr can offset ordinary (W-2) income if you actively participate and your MAGI is under $100k (phasing out to $0 by $150k); unused losses carry forward. On sale, claimed depreciation is recaptured at up to 25%, and gains may owe capital-gains tax (a 1031 exchange can defer both). Figures are a year-1 estimate at your 24.0% rate — not tax advice; consult a CPA.
Schools (NCES district)
- District
- Chesterfield County Public School District
- NCES district ID
- 5100840
- Math proficiency
- 52% ▼ -30.00%
- Reading proficiency
- 64% ▼ -15.00%
- Median HH income
- $72,821
- Composite
- 51.56/100
- National rank
- #1712
- State rank
- #57 of 131 in VA
Livability — Manchester
- Score
- 77/100
- State rank
- #101
- US rank
- #3202
Category grades
Schools grade is shown separately in the Schools card above.
Census & demographics
- County
- Chesterfield County · 406,988 people
- Metro
- Richmond, VA
- Population (ZIP)
- 27,903
- Household income
- $110,499
- Rent vs Own
- Severe rent burden
- 419.0
Population outlook (Chesterfield County) Hauer SSP2
- Today (2025)
- 377,190 people
- By 2030
- 395,710 · +4.9%
- By 2040
- 427,694 · +13.4%
- By 2050
- 452,706 · +20.0%
- By 2075
- 505,533 · +34.0%
- By 2100
- 521,282 · +38.2%
Race, ethnicity, and origin ACS 2023
- Neighborhood character
- Majority White (64%)
- Race & ethnicity
- White 64% Black 19% Hispanic / Latino 9% Two or more races 6% Asian 2%
- Hispanic origin (detail)
- Mexican 2% Puerto Rican 2%
- Common ancestry
- Italian 3% Iranian 2% Romanian 2%
- Foreign-born
- 8% · Canada, South Korea
- Languages at home
- 86% English-only · Spanish 9% Other Indo-European 2% German/W. Germanic 1%
Political lean MEDSL · Chesterfield
- 2024 margin
- Lean D (+9.0) · D 53.8% · R 44.8% · Other 1.4%
- 2008→2024 swing
- +16.4pp toward D · 2008: -7.5pp · 2024: 9.0pp
- All cycles
- 2024: D+9.0 2020: D+6.7 2016: R+2.2 2012: R+7.1 2008: R+7.5
Not yet ingested
- Civics
- —
Market trends
- HPI YoY
- ▼ -192.45%
- Current HPI
- 284.4448
- Rent YoY
- ▲ 3.78%
- Metro
- Richmond, VA
- State GDP YoY
- ▲ 2.40%
- F500 in state
- 50
Industry mix (Fortune 500 HQ in VA)
| Industry | F500 HQs | Revenue |
|---|---|---|
| Aerospace / Defense | 4 | $236B |
|
||
| Technology / Defense | 3 | $32B |
|
||
| Financial Services | 2 | $176B |
|
||
| Utilities | 2 | $27B |
|
||
| Insurance | 2 | $25B |
|
||
| Technology | 2 | $15B |
|
||
Price history
+378.3% since first listed4 events — show timeline
- 2026-05-27 Pending — CVRMLS
- 2026-05-14 Listed $399,900 CVRMLS
- 2026-05-13 Coming Soon $399,900 CVRMLS
- 1981-01-29 Sold (Public Records) $83,600 Public Records
Property tax history
+5.5%/yrLatest (2025): $3,514 · +6.9% YoY. Source: county tax records.
Cash-flow waterfall
monthlySold comps — $/sqft
last 12 mo · ≤1 miLoading sold comps…