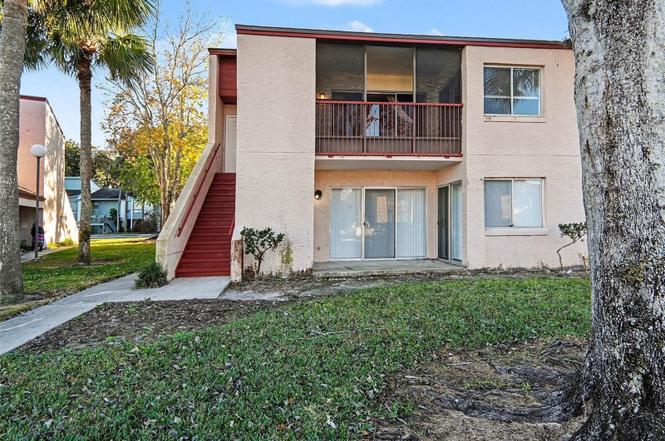
2514 Citrus Club Ln #308 · Orlando, FL
Flood risk 1/10 · Minimal
- FEMA flood zone
- X (unshaded)
- Chance of flooding over 30 yrs
- 0.0%
- Est. flood insurance / yr
- $507 – $1,088
Fire risk 1/10 · Minimal
- Est. fire insurance / yr
- $947 – $1,759
Heat risk 9/10 · Severe
- Hot days now (above 108°F)
- 7 days/yr
- Hot days in 30 yrs
- 23 days/yr
Wind risk 9/10 · Severe
- Chance of severe wind over 30 yrs
- 99.0%
Air-quality risk 1/10 · Minimal
- Unhealthy air days now
- 0 days/yr
- Unhealthy air days in 30 yrs
- 0 days/yr
Risk factors via First Street. Map © Google.
Why this score? — see what drove the D grade
The composite is a weighted blend of 9 inputs, each scored 0–100. Each bar is that input's sub-score; the figure is the points it added to the 100-point composite (weight × sub-score).
- Cash flow +8.5/30.0
- 1% rule +8.5/10.0
- ARV discount +7.5/15.0
- Livability +4.3/5.0
- Schools +4.1/10.0
- Condition / age +2.5/5.0
- Rent growth +2.4/5.0
- DSCR +2.3/10.0
- Appreciation +0.0/10.0
$113,000
🖨 Deal sheet 📄 Offer letter ✓ Due diligence
Listing remarks
Welcome to this well-maintained second-floor townhome located in a desirable and affordable area of central Orlando. This inviting home offers a comfortable, functional layout and is in excellent overall condition, perfect for both homeowners and investors alike. The kitchen features ample cabinet space, durable laminate countertops, and a convenient breakfast bar, ideal for casual meals and entertaining. Each bedroom includes its own private bathroom, providing comfort and privacy for residents and guests. Additionally, both the primary bedroom and living room open through glass sliding doors to a private front balcony, creating the perfect space to unwind after work or enjoy vibrant weeke
Key facts
- Ample cabinet space
- Tile flooring
- $524 HOA
Tags
Property features AI
Finance
- Other: Unit is unfurnished
- Financial info: Total annual association fees: $6,288; No lease restrictions indicated
- HOA & community: Monthly HOA fee of $524; Association name: Sparing HOA Mgmt; HOA covers cable TV, internet, building and grounds maintenance, sewer, trash, and water; Pets allowed (large/weight unrestricted)
Exterior
- Parking: Asphalt road access
- Utilities: Public water; Public sewer; Cable available and connected; Electricity available and connected; Water connected
- Home design: Condominium; Residential property; Two stories; Faces north; Second-floor unit; Condo land included
- Construction: Block and stucco construction; Shingle roof; Slab/other foundation; Built as part of a multi-story building
- Exterior features: Balcony; Exterior lighting; Sidewalk; Tennis courts; Community pool; Street lights
Interior
- Kitchen: Dishwasher; Range; Range hood; Refrigerator
- Bedrooms: 2 bedrooms (unit on 2nd floor)
- Flooring: Tile
- Bathrooms: 2 full bathrooms
- Heating & cooling: Central heating (electric); Central air conditioning
- Interior features: Ceiling fans; High ceilings
- Laundry & utility: Laundry inside the unit
Neighborhood map
What this means for you Summary
Snapshot
- This is a 2-bed/2.0-bath condo listed at $113k.
Deal economics
- At list price, monthly cash flow is $-100 ($-1k/yr) — negative.
- To cash-flow at today's rent, offer at most $99k (12.8% below list).
- Meets the 1% rule at list price ($2k rent vs $113k).
- Recommended offer: $99k (12.8% below list) — sets the bar for cash-flow.
- Cap rate 5.2% vs local median 3.0% in Orlando — top-decile yield for the area; either an underpriced asset or a hidden risk that comps aren't pricing in. Stress-test before assuming the spread holds.
Location & tenants
- Location reads 86/100 on livability (#12 in FL, #360 nationally) — a professional / high-income tenant draw. Strengths: amenities A+, commute A+, housing A+.
- Orange (suburban): math 46% / reading 51% proficiency, ranked #43 of 73 in FL (top 59%) — families likely to look elsewhere, expect single-tenant / working-renter base with shorter leases.
- Zoned schools: Catalina Elementary (math 35% / reading 26%, grade F, #1,862 of 2,144 statewide, top 88%, 612 students, 82% FRL); Oak Ridge High (math 17% / reading 27%, grade F, #544 of 667 statewide, top 82%, 2,477 students, 66% FRL) — zoned schools average 74% FRL vs 56% district-wide (18 pts higher); higher-poverty schools than district average — tighter screening recommended.
- Zoned-school proficiency averages 26% at this address vs 48% district-wide (-22 pts) — the specific schools serving this property underperform the Orange average; the district grade overstates school quality for this exact location.
- Market conditions: Rents soft (-0.5%/yr); 222 active listings in the ZIP; 40 comparable units currently listed for rent nearby; rentals at typical pace (median 24d on market — plan ~3-4 weeks tenant-placement turnaround); 8,053 units permitted in Orange County in 2024 (3,133 in 5+ unit buildings).
Forward outlook
- Local home prices are declining (-3.0%/yr); year-one equity from $781 of loan paydown is wiped out by about $3k of value loss. Plan a longer hold.
- Orange County population projected at +52% by 2050 — long-run rental-demand tailwind backs the buy-and-hold thesis.
Negotiation context
- It's been on market 103 days — a 9% lower offer ($103k) is reasonable based on typical stale-listing flexibility.
- 4 sale attempts since 18y ago; this cycle's ask has dropped $7k (6%) from the opening price — seller is motivated, your offer sets the floor, not the list.
- Current owner paid $58k; list at $113k implies a 93% gain — meaningful room to come down on a strong offer.
Risks & watch-outs
- Watch-outs: HOA is 34% of rent.
- Climate carrying-cost: severe wind risk, 99% chance of damaging wind over 30y; extreme-heat days projected 7→23/yr by 2055 (HVAC capex compounding) — expect insurance premiums to compound above CPI over the hold.
Questions for the listing agent
- What do current leases actually rent for vs. the listed asking? Can we see a recent rent roll and the last 12 months of T-12 income?
- It's been on market 103 days. Have you received any prior offers? Is the seller open to a 13% concession, seller financing, or rate buy-down credit?
- What does the HOA fee cover, when was the last increase, and are there any pending special assessments or reserve-fund shortfalls?
- Any open or pending special assessments — roof, HVAC, plumbing, elevator, façade? What's the per-unit balance and payoff schedule, and is the seller paying it off at close or rolling it to the buyer?
- Why hasn't it sold? Are there any deal-killer items the seller is aware of (foundation, flood, title, zoning, code violations)?
- Is there a deadline driving the sale (1031 exchange, divorce, estate, relocation)? That informs how much negotiation room exists.
- Schools are B-rated — typically a magnet for longer-tenancy family renters. What's the average tenant stay here, and is there a school-zone premium baked into asking?
- The area grade is low — what's the realistic commute time and amenity access for the typical tenant pool here? Any planned neighborhood developments (good or bad) we should know about?
- What's the average days-on-market for RENTAL listings here right now (not sales)? A rising rental-DOM trend means longer vacancies and softer asking-rent achievability than the comps imply.
- What's the recent tenant-quality profile in this submarket — average credit score on applications, eviction rate, late-payment / NSF rate, and stable-employment percentage? A property-management company in the area should have these aggregated.
- How much new apartment / multifamily construction is in the pipeline within 1–3 miles? Heavy new supply (>2% of stock underway) typically softens rents 12–24 months out; light construction supports rent growth.
Investment metrics
- 1% rule
- 1.35% ✓
- Cap rate
- 5.23%
- Cash-on-cash
- -3.78%
- DSCR
- 0.83
- GRM
- 6.2
CMA / ARV
No comps found within radius.
Projected returns pro-forma
-3.0% appreciation · 0.0% rent growth · sell at horizon
- IRR
- -28.4%
- Equity multiple
- 0.09×
- Total profit
- $-28,786
- Equity at exit
- $16,849
- IRR
- -67.0%
- Equity multiple
- -0.55×
- Total profit
- $-49,119
- Equity at exit
- $9,770
Cash invested: $31,640 (down + closing). Projections, not guarantees.
Landlord ↔ Tenant lean methodology
- Overall (STATE)
- 87 Strongly Landlord-Friendly
- State Florida
- 87 Strongly Landlord-Friendly · R+3
- County
- — inherits STATE
- City
- — inherits STATE
ZIP-level market 32839
- Home prices YoY
- -20.1%
- Rents YoY
- -0.5%
- Active inventory
- 222
- Price-to-rent
- 6.2×
Monthly cashflow live
- Estimated rent
- $1,526 high interval (Pro) →
- Mortgage (P&I)
- −$593
- Tax est. 1.5%
- −$141 /mo · $1,695/yr
- Insurance
- −$47
- HOA
- −$524
- Vacancy / Maint / Mgmt
- −$320
- Net cashflow
- $-100
Break-even live
UW: 25.0% down · 7.5% · 30yr · 1.5% tax · 5.0% vac · 8.0% maint · 8.0% mgmt
Financing live
Cash to close
- Down payment
- $28,250
- Closing costs
- $3,390
- Reserves months
- —
- Total cash needed
- —
Loan-product check · same deal, 3 products live
Conventional
25% down · 7.5% · 30yr
- Down + closing
- —
- Monthly P&I
- —
- Monthly cashflow
- —
- DSCR
- —
- Eligible?
- —
Personal DTI + credit; lowest rate.
DSCR
20% down · 8.5% · 30yr
- Down + closing
- —
- Monthly P&I
- —
- Monthly cashflow
- —
- DSCR
- —
- Eligible?
- —
No personal income docs; deal must DSCR.
Hard money
10% down · 12.0% · 12mo
- Down + closing
- —
- Monthly P&I
- —
- Monthly cashflow
- —
- DSCR
- —
- Eligible?
- —
Short-term bridge; refi at stabilization.
Rent comps 40 comps
| Address | Beds | Baths | Sqft | Rent | $/sqft | DOM | Units | Dist |
|---|---|---|---|---|---|---|---|---|
| 2482 Lakeway Branch Dr #904 Orlando, FL | 2.0 | 2.0 | 1227 | $1,625 | $1.32 | 23d | 1 | 0.07mi |
| 2482 Lakeway Branch Dr Orlando, FL | 2.0 | 2.0 | 1227 | $1,499 | $1.22 | 23d | 1 | 0.07mi |
| 2418 Skan Ct Unit C Orlando, FL | 3.0 | 2.0 | 1308 | $1,825 | $1.40 | 23d | 1 | 0.14mi |
| 4424 S Texas Ave Unit 204 Orlando, FL | 2.0 | 2.0 | 900 | $1,900 | $2.11 | 10d | 1 | 0.14mi |
| 4424 S Texas Ave Unit 1-2051-205 Orlando, FL | 2.0 | 2.0 | 900 | $1,750 | $1.94 | 2d | 1 | 0.14mi |
| 2622 Lemon Tree Ln Unit 6-K Orlando, FL | 2.0 | 2.0 | 976 | $1,200 | $1.23 | 21d | 1 | 0.15mi |
| 1835 Warringwood Dr Orlando, FL | 2.0 | 1.5 | 762 | $1,395 | $1.83 | 21d | 1 | 0.21mi |
| 1831 Warringwood Dr Unit C4 Orlando, FL | 2.0 | 2.5 | 1211 | $1,200 | $0.99 | 23d | 1 | 0.21mi |
| 4405 S Texas Ave Orlando, FL | 2.0 | 2.0 | 1100 | $1,550 | $1.41 | 23d | 1 | 0.24mi |
| 4016 Woodfern Dr Unit B8 Orlando, FL | 2.0 | 2.5 | 1211 | $1,750 | $1.45 | 17d | 1 | 0.24mi |
| 4010 Dolomite St Unit A6 Orlando, FL | 1.0 | 1.5 | 762 | $1,200 | $1.57 | 14d | 1 | 0.26mi |
| 4033 Henley Rd #1707 Orlando, FL | 2.0 | 1.5 | 1164 | $1,500 | $1.29 | 21d | 1 | 0.31mi |
| 4029 Henley Rd #1705 Orlando, FL | 2.0 | 1.5 | 1164 | $1,625 | $1.40 | 23d | 1 | 0.31mi |
| 4023 Henley Rd #1702 Orlando, FL | 2.0 | 1.5 | 1164 | $1,400 | $1.20 | 23d | 1 | 0.32mi |
| 2245 Lyme Bay Dr #1103 Orlando, FL | 2.0 | 1.5 | 1174 | $1,600 | $1.36 | 7d | 1 | 0.33mi |
| 2225 Holden Ave #104 Orlando, FL | 2.0 | 2.0 | 1248 | $1,800 | $1.44 | 23d | 1 | 0.33mi |
| 3914 Crayrich Cir Unit GE Orlando, FL | 1.0 | 1.5 | 762 | $1,200 | $1.57 | 23d | 1 | 0.34mi |
| 3977 Crayrich Cir Orlando, FL | 1.0 | 1.0 | 762 | $1,210 | $1.59 | 7d | 1 | 0.35mi |
| 3977 Crayrich Cir Unit C-1 Orlando, FL | 1.0 | 1.5 | 762 | $1,210 | $1.59 | 10d | 1 | 0.36mi |
| 4025 Billingsgate Rd #2004 Orlando, FL | 2.0 | 1.5 | 1164 | $1,700 | $1.46 | 23d | 1 | 0.36mi |
| 3960 Crayrich Cir Orlando, FL | 1.0 | 2.0 | 762 | $1,150 | $1.51 | 23d | 1 | 0.36mi |
| 5017 City St #1923 Orlando, FL | 1.0 | 1.0 | 724 | $1,500 | $2.07 | 23d | 1 | 0.38mi |
| 2201 Metropolitan Way Orlando, FL | 2.0 | 2.0 | 874 | $1,475 | $1.69 | 2d | 1 | 0.41mi |
| 4703 S Texas Ave Unit A Orlando, FL | 1.0 | 1.0 | 756 | $1,200 | $1.59 | 23d | 1 | 0.47mi |
| 4711 S Texas Ave Unit 4711A Orlando, FL | 2.0 | 2.0 | 976 | $1,600 | $1.64 | 23d | 1 | 0.49mi |
| 4725 S Texas Ave Apt C Orlando, FL | 2.0 | 2.0 | 976 | $1,249 | $1.28 | 23d | 1 | 0.49mi |
| 5124 Park Central Dr Orlando, FL | 2.0 | 2.0 | 874 | $1,648 | $1.89 | 23d | 2 | 0.50mi |
| 5124 Park Central Dr #517 Orlando, FL | 2.0 | 2.0 | 874 | $1,700 | $1.95 | 13d | 1 | 0.50mi |
| 4733 S Texas Ave Unit 4733B Orlando, FL | 2.0 | 2.0 | 976 | $1,450 | $1.49 | 21d | 1 | 0.50mi |
| 4255 Barwood Dr Orlando, FL | 1.0–3.0 | 1.0–2.5 | 1071 | $1,455 | $1.36 | 4d | 1 | 0.50mi |
| 4807 S Texas Ave Unit 4807C Orlando, FL | 1.0 | 1.0 | 756 | $1,599 | $2.12 | 23d | 1 | 0.51mi |
| 4807 S Texas Ave Unit 4807D Orlando, FL | 1.0 | 1.0 | 756 | $1,349 | $1.78 | 23d | 1 | 0.51mi |
| 4789 S Texas Ave Apt A Orlando, FL | 2.0 | 2.0 | 976 | $1,500 | $1.54 | 7d | 1 | 0.51mi |
| 4801 S Texas Ave Unit 4801D Orlando, FL | 1.0 | 1.0 | 756 | $1,200 | $1.59 | 23d | 1 | 0.51mi |
| 4795 S Texas Ave Unit 4795A Orlando, FL | 1.0 | 1.0 | 756 | $1,200 | $1.59 | 23d | 1 | 0.52mi |
| 4791 S Texas Ave Orlando, FL | 2.0 | 2.0 | 976 | $1,300 | $1.33 | 23d | 1 | 0.52mi |
| 1717 Holden Ave Orlando, FL | 1.0–3.0 | 1.0–2.5 | 980 | $1,424 | $1.45 | 1d | 26 | 0.53mi |
| 4749 S Texas Ave Unit 4749C Orlando, FL | 2.0 | 2.0 | 976 | $1,450 | $1.49 | 23d | 1 | 0.54mi |
| 4759 S Texas Ave Unit 4759C Orlando, FL | 2.0 | 2.0 | 976 | $1,450 | $1.49 | 16d | 1 | 0.55mi |
| 2424 Grand Central Pkwy Orlando, FL | 2.0 | 2.5 | 1250 | $1,822 | $1.46 | 7d | 2 | 0.56mi |
HOA detail condo
- Monthly dues
- $524 · $6,288/yr
- Assessments
- None detected in remarks — confirm with the listing agent.
Listing history 15 events
-
2026-04-30status Pending
-
2026-03-20price $113,000
-
2026-02-16price $115,000
-
2026-01-17$119,900 Active
-
2025-10-06historical
-
2025-08-15price $129,999
-
2025-06-15price $149,999
-
2025-05-21price $160,000
-
2025-05-16$175,000 Active
-
2014-04-04historical
-
2009-06-19$20,000
-
2009-06-19historical
-
2008-12-19$54,900
-
2001-10-30soldstatus $58,400
-
1988-06-01soldstatus $55,000
ⓘ Source: listings_history table (triggers on properties + properties_extension) + one-shot
backfill from property_details.listing_events for pre-trigger history.
Climate risk First Street
- Flood 1/10 Low FEMA zone X (unshaded) · 0% chance over 30 yrs
- Wildfire 1/10 Low
- Heat 9/10 Extreme 7 d/yr ≥108°F today · 23 d/yr by 30 yrs out
- Wind 9/10 Extreme 99% chance of damaging wind over 30 yrs
- Air quality 1/10 Low 0 unhealthy d/yr today · 0 by 30 yrs out
Nearby sold comps map
Loading sold comps map…
Walkable amenities ~0.75 mi
Loading nearby amenities…
Taxation est. · year 1
- Rental income
- $18,307
- − Mortgage interest
- −$6,330
- − Property taxes
- −$1,695
- − Insurance
- −$565
- − Repairs & maintenance
- −$1,465
- − Management
- −$1,465
- − HOA
- −$6,288
- − Depreciation
- −$3,287
- Taxable loss
- −$2,787
- Est. tax savings @ 24.0%
- +$669
- After-tax cash flow
- $-527/yr
For passive investors: Depreciation is non-cash, so a rental often shows a tax loss while cash-flowing — sheltering income. Rental losses are passive: they offset passive income freely, and up to $25,000/yr can offset ordinary (W-2) income if you actively participate and your MAGI is under $100k (phasing out to $0 by $150k); unused losses carry forward. On sale, claimed depreciation is recaptured at up to 25%, and gains may owe capital-gains tax (a 1031 exchange can defer both). Figures are a year-1 estimate at your 24.0% rate — not tax advice; consult a CPA.
Schools (NCES district)
- District
- Orange
- NCES district ID
- 1201440
- Math proficiency
- 46% ▼ -9.00%
- Reading proficiency
- 51% ▼ -2.00%
- Median HH income
- $49,350
- Composite
- 41.47/100
- National rank
- #3461
- State rank
- #43 of 73 in FL
Livability — Orlando
- Score
- 86/100
- State rank
- #12
- US rank
- #360
Category grades
Schools grade is shown separately in the Schools card above.
Census & demographics
- County
- Orange County · 1,471,359 people
- City population
- 964,969
- Metro
- Orlando-Kissimmee-Sanford, FL
- Population (ZIP)
- 53,242
- Household income
- $47,313
- Rent vs Own
- Severe rent burden
- 5337.0
Population outlook (Orange County) Hauer SSP2
- Today (2025)
- 1,618,226 people
- By 2030
- 1,787,404 · +10.5%
- By 2040
- 2,125,621 · +31.4%
- By 2050
- 2,454,016 · +51.6%
- By 2075
- 3,173,711 · +96.1%
- By 2100
- 3,607,781 · +122.9%
Race, ethnicity, and origin ACS 2023
- Neighborhood character
- Diverse neighborhood (Simpson 0.69)
- Race & ethnicity
- Hispanic / Latino 39% Black 35% Two or more races 17% White 16% Asian 4%
- Hispanic origin (detail)
- Mexican 5% Puerto Rican 14% Cuban 2% Dominican 3%
- Common ancestry
- Hispanic 8% Estonian 1% Lithuanian 1%
- Foreign-born
- 30% · Canada, Jamaica, Vietnam
- Languages at home
- 51% English-only · Spanish 33% French/Haitian/Cajun 9% Other Indo-European 2%
Political lean MEDSL · Orange
- 2024 margin
- D (+13.6) · D 56.1% · R 42.5% · Other 1.3%
- 2008→2024 swing
- -5.0pp toward R · 2008: 18.6pp · 2024: 13.6pp
- All cycles
- 2024: D+13.6 2020: D+23.1 2016: D+24.6 2012: D+18.2 2008: D+18.6
Not yet ingested
- Civics
- —
Market trends
- HPI YoY
- ▼ -89.65%
- Current HPI
- 357.4828
- Rent YoY
- ▼ -0.50%
- Metro
- Orlando-Kissimmee-Sanford, FL
- State GDP YoY
- ▲ 3.28%
- F500 in state
- 36
Industry mix (Fortune 500 HQ in FL)
| Industry | F500 HQs | Revenue |
|---|---|---|
| Industrial Technology | 2 | $29B |
|
||
| Insurance | 2 | $17B |
|
||
| Retail | 1 | $60B |
|
||
| Technology Distribution | 1 | $58B |
|
||
| Homebuilding | 1 | $35B |
|
||
| Technology Manufacturing | 1 | $35B |
|
||
Price history
+105.5% since first listed15 events — show timeline
- 2026-04-30 Pending — Stellar MLS as Distributed by MLS Grid
- 2026-03-20 Price Changed $113,000 Stellar MLS as Distributed by MLS Grid
- 2026-02-16 Price Changed $115,000 Stellar MLS as Distributed by MLS Grid
- 2026-01-17 Listed $119,900 Stellar MLS as Distributed by MLS Grid
- 2025-10-06 Listing Removed — Stellar MLS as Distributed by MLS Grid
- 2025-08-15 Price Changed $129,999 Stellar MLS as Distributed by MLS Grid
- 2025-06-15 Price Changed $149,999 Stellar MLS as Distributed by MLS Grid
- 2025-05-21 Price Changed $160,000 Stellar MLS as Distributed by MLS Grid
- 2025-05-16 Listed $175,000 Stellar MLS as Distributed by MLS Grid
- 2014-04-04 Listing Removed — Stellar MLS as Distributed by MLS Grid
- 2009-06-19 Listing Removed — Stellar MLS as Distributed by MLS Grid
- 2009-06-19 Listed $20,000 Stellar MLS as Distributed by MLS Grid
- 2008-12-19 Listed $54,900 Stellar MLS as Distributed by MLS Grid
- 2001-10-30 Sold (Public Records) $58,400 Public Records
- 1988-06-01 Sold (Public Records) $55,000 Public Records
Property tax history
-11.4%/yrLatest (2025): $102 · +16.1% YoY. Source: county tax records.
Cash-flow waterfall
monthlySold comps — $/sqft
last 12 mo · ≤1 miLoading sold comps…