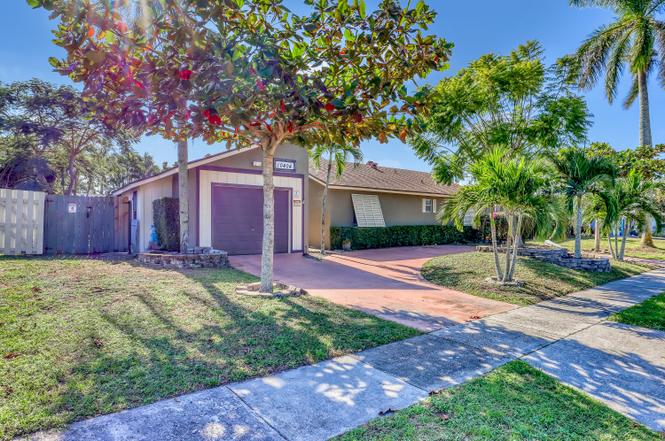
10404 Carmen Ln · Royal Palm Beach, FL
Flood risk 1/10 · Minimal
- FEMA flood zone
- X (unshaded)
- Chance of flooding over 30 yrs
- 0.0%
- Est. flood insurance / yr
- $507 – $1,088
Fire risk 2/10 · Minimal
- Est. fire insurance / yr
- $947 – $1,759
Heat risk 10/10 · Severe
- Hot days now (above 107°F)
- 7 days/yr
- Hot days in 30 yrs
- 26 days/yr
Wind risk 10/10 · Severe
- Chance of severe wind over 30 yrs
- 99.0%
Air-quality risk 2/10 · Minimal
- Unhealthy air days now
- 0 days/yr
- Unhealthy air days in 30 yrs
- 1 days/yr
Risk factors via First Street. Map © Google.
Why this score? — see what drove the D- grade
The composite is a weighted blend of 9 inputs, each scored 0–100. Each bar is that input's sub-score; the figure is the points it added to the 100-point composite (weight × sub-score).
- Appreciation +10.0/10.0
- Cash flow +7.2/30.0
- ARV discount +4.4/15.0
- Schools +4.3/10.0
- Livability +4.0/5.0
- Rent growth +2.7/5.0
- Condition / age +2.5/5.0
- DSCR +1.4/10.0
- 1% rule +1.2/10.0
$519,900
🖨 Deal sheet (PDF) 📄 Offer letter ✓ Due diligence
Listing remarks MLS
WOOD KIT CABINETS W/CUSTOM TILED COUNTERTOPS, NEW CARPET IN BDRMS, TILED FAMILY RM, DIN AREA & KIT, MASTER BTH HAS UPGRADED DOUBLE SINK VANITY, NEW AC CONDENSER, INGROUND POOL W/DIAMOND BRIGHT FINISH & NEW PUMP & FILTER, PRIVATELY FENCED REAR YARD, CIRCULAR DRIVE, EASY TO SHOW
Key facts
- Refreshing pool
- Newer roof
- No hoa fees
Tags
Neighborhood map
What this means for you Summary
Snapshot
- This is a 4-bed/2.5-bath single-family listed at $520k.
Deal economics
- At list price, monthly cash flow is $-714 ($-9k/yr) — negative.
- To cash-flow at today's rent, offer at most $394k (24.3% below list).
- To meet the 1% rule (rent ≥ 1% of price), the offer needs to be $320k (38.4% below list).
- Recommended offer: $320k (38.4% below list) — sets the bar for 1% rule.
Location & tenants
- Location reads 79/100 on livability (#135 in FL, #2,039 nationally) — a middle-class / working-renter tenant base. Strengths: employment A+, housing A+, health & safety A+; Watch: cost of living C-, amenities F, commute F.
- Palm Beach (suburban): math 46% / reading 53% proficiency, ranked #34 of 73 in FL (top 47%) — families likely to look elsewhere, expect single-tenant / working-renter base with shorter leases.
- Zoned schools: Royal Palm Beach Elementary School (math 58% / reading 62%, grade B-, #680 of 2,144 statewide, top 32%, 662 students, 40% FRL); Crestwood Community Middle (math 49% / reading 52%, grade C, #246 of 571 statewide, top 44%, 724 students, 50% FRL); Royal Palm Beach High School (math 22% / reading 38%, grade F, #441 of 667 statewide, top 67%, 2,343 students, 57% FRL) — zoned schools at 49% FRL track the district average.
- Market conditions: Rents flat; 583 active listings in the ZIP; 29 comparable units currently listed for rent nearby; rentals at typical pace (median 26d on market — plan ~3-4 weeks tenant-placement turnaround); solid renter incomes; 3,974 units permitted in Palm Beach County in 2024 (1,012 in 5+ unit buildings).
- This rent runs 42% of the median local income ($93k/yr) — at the standard rent-burdened threshold; future hikes will face affordability resistance.
Forward outlook
- In year one you build about $56k of equity ($4k loan paydown + $52k appreciation (10.0% local appreciation)).
- Palm Beach County population projected at +30% by 2050 — long-run rental-demand tailwind backs the buy-and-hold thesis.
- By year 2, paydown + projected appreciation supports a ~$89k cash-out refi (75% LTV) — recoverable capital for the next deal without selling this one.
Negotiation context
- It's been on market 113 days — a 9% lower offer ($473k) is reasonable based on typical stale-listing flexibility.
- 2 sale attempts since 15y ago; this cycle's ask has dropped $30k (5%) from the opening price — seller is motivated, your offer sets the floor, not the list.
- Current owner paid $110k; list at $520k implies a 373% gain — meaningful room to come down on a strong offer.
Risks & watch-outs
- Climate carrying-cost: severe wind risk, 99% chance of damaging wind over 30y; extreme-heat days projected 7→26/yr by 2055 (HVAC capex compounding) — expect insurance premiums to compound above CPI over the hold.
Questions for the listing agent
- What do current leases actually rent for vs. the listed asking? Can we see a recent rent roll and the last 12 months of T-12 income?
- It's been on market 113 days. Have you received any prior offers? Is the seller open to a 38% concession, seller financing, or rate buy-down credit?
- Built in 1978 — when were the roof, HVAC, electrical panel, plumbing, and water heater last replaced?
- Why hasn't it sold? Are there any deal-killer items the seller is aware of (foundation, flood, title, zoning, code violations)?
- Is there a deadline driving the sale (1031 exchange, divorce, estate, relocation)? That informs how much negotiation room exists.
- Schools are B-rated — typically a magnet for longer-tenancy family renters. What's the average tenant stay here, and is there a school-zone premium baked into asking?
- The area grade is low — what's the realistic commute time and amenity access for the typical tenant pool here? Any planned neighborhood developments (good or bad) we should know about?
- What's the average days-on-market for RENTAL listings here right now (not sales)? A rising rental-DOM trend means longer vacancies and softer asking-rent achievability than the comps imply.
- What's the recent tenant-quality profile in this submarket — average credit score on applications, eviction rate, late-payment / NSF rate, and stable-employment percentage? A property-management company in the area should have these aggregated.
- How much new for-sale + rental construction is in the pipeline within 1–3 miles? Heavy new supply typically softens prices + rents 12–24 months out; constrained supply supports both.
Investment metrics
- 1% rule
- 0.62% ✗
- Cap rate
- 4.64%
- Cash-on-cash
- -5.89%
- DSCR
- 0.74
- GRM
- 13.5
CMA / ARV
- ARV (on-the-fly)
- $486,486
- Comps found
- 1
Show comp detail 1 sale within ~0.75 mi
| Address | Dist | Beds/Ba | Sqft | Sold | Price | $/sf | Match |
|---|---|---|---|---|---|---|---|
| 215 Sandpiper Ave | 0.75mi | 4/2.0 | 1,785 (+9%) | 7mo | $530,000 | $297 | 43 |
Match score weights: distance 35% · size 25% · config 20% · recency 20%. Top-matched comps best support the ARV.
Projected returns pro-forma
10.0% appreciation · 0.85% rent growth · sell at horizon
- IRR
- 19.6%
- Equity multiple
- 2.58×
- Total profit
- $230,707
- Equity at exit
- $468,367
- IRR
- 17.6%
- Equity multiple
- 5.82×
- Total profit
- $702,251
- Equity at exit
- $1,010,051
Cash invested: $145,572 (down + closing). Projections, not guarantees.
Landlord ↔ Tenant lean methodology
- Overall (STATE)
- 87 Strongly Landlord-Friendly
- State Florida
- 87 Strongly Landlord-Friendly · R+3
- County
- — inherits STATE
- City
- — inherits STATE
ZIP-level market 33411
- Home prices YoY
- 1.9%
- Rents YoY
- 0.8%
- Active inventory
- 583
- Price-to-rent
- 13.5×
Monthly cashflow live
- Estimated rent
- $3,203 high interval (Pro) →
- Mortgage (P&I)
- −$2,726
- Tax from tax record
- −$302 /mo · $3,619/yr
- Insurance
- −$217
- HOA
- −$0
- Vacancy / Maint / Mgmt
- −$673
- Net cashflow
- $-714
Break-even live
Sensitivity live
| Price | -10% $-420 | -5% $-567 | +0% $-714 | +5% $-861 | +10% $-1,009 |
|---|---|---|---|---|---|
| Rent | -10% $-967 | -5% $-841 | +0% $-714 | +5% $-588 | +10% $-461 |
| Rate | -1.0pp $-452 | -0.5pp $-582 | base $-714 | +0.5pp $-849 | +1.0pp $-986 |
UW: 25.0% down · 7.5% · 30yr · 1.5% tax · 5.0% vac · 8.0% maint · 8.0% mgmt
Financing live
Cash to close
- Down payment
- $129,975
- Closing costs
- $15,597
- Reserves months
- —
- Total cash needed
- —
Loan-product check · same deal, 3 products live
Conventional
25% down · 7.5% · 30yr
- Down + closing
- —
- Monthly P&I
- —
- Monthly cashflow
- —
- DSCR
- —
- Eligible?
- —
Personal DTI + credit; lowest rate.
DSCR
20% down · 8.5% · 30yr
- Down + closing
- —
- Monthly P&I
- —
- Monthly cashflow
- —
- DSCR
- —
- Eligible?
- —
No personal income docs; deal must DSCR.
Hard money
10% down · 12.0% · 12mo
- Down + closing
- —
- Monthly P&I
- —
- Monthly cashflow
- —
- DSCR
- —
- Eligible?
- —
Short-term bridge; refi at stabilization.
Rent comps 29 comps
| Address | Beds | Baths | Sqft | Rent | $/sqft | DOM | Units | Dist |
|---|---|---|---|---|---|---|---|---|
| 10863 Dalmany Way Royal Palm Beach, FL | 3.0 | 2.0 | 1232 | $3,500 | $2.84 | 26d | 1 | 0.51mi |
| 176 Bellezza Ter Royal Palm Beach, FL | 4.0 | 2.5 | 2058 | $3,350 | $1.63 | 12d | 1 | 0.54mi |
| 118 Bobwhite Rd Royal Palm Beach, FL | 3.0 | 2.0 | 1444 | $3,200 | $2.22 | 19d | 1 | 0.54mi |
| 179 Dove Cir Royal Palm Beach, FL | 3.0 | 2.0 | 1642 | $3,500 | $2.13 | 26d | 1 | 0.61mi |
| 274 River Bluff Ln Royal Palm Beach, FL | 3.0 | 2.5 | 1579 | $3,000 | $1.90 | 26d | 1 | 0.80mi |
| 460 Rainbow Springs Ter Royal Palm Beach, FL | 3.0 | 2.5 | 1579 | $2,950 | $1.87 | 26d | 1 | 0.82mi |
| 213 River Bluff Ln Royal Palm Beach, FL | 3.0 | 2.5 | 1579 | $2,800 | $1.77 | 26d | 1 | 0.93mi |
| 296 Sandpiper Ave Royal Palm Beach, FL | 3.0 | 2.0 | 1569 | $3,100 | $1.98 | 26d | 1 | 1.00mi |
| 2106 Belcara Ct West Palm Beach, FL | 3.0 | 2.0 | 1891 | $3,400 | $1.80 | 26d | 1 | 1.12mi |
| 182 Sparrow Dr Unit A Royal Palm Beach, FL | 3.0 | 2.0 | 1485 | $3,000 | $2.02 | 26d | 1 | 1.12mi |
| 11260 Channing Way Unit 212 Royal Palm Beach, FL | 3.0 | 2.0 | 1417 | $3,174 | $2.24 | 26d | 1 | 1.17mi |
| 11300 Channing Ln Unit 102 Royal Palm Beach, FL | 3.0 | 2.0 | 2111 | $4,299 | $2.04 | 26d | 1 | 1.17mi |
| 180 Seminole Lakes Dr Royal Palm Beach, FL | 3.0 | 2.0 | 1856 | $3,500 | $1.89 | 26d | 1 | 1.18mi |
| 9873 Baywinds Dr #5212 West Palm Beach, FL | 3.0 | 2.0 | 1310 | $2,450 | $1.87 | 26d | 1 | 1.19mi |
| 2830 Bellarosa Cir West Palm Beach, FL | 3.0 | 2.5 | 2046 | $3,300 | $1.61 | 26d | 1 | 1.22mi |
| 9901 Baywinds Dr #3202 West Palm Beach, FL | 3.0 | 2.0 | 1310 | $2,500 | $1.91 | 26d | 1 | 1.22mi |
| 9901 Baywinds Dr #3202 West Palm Beach, FL | 3.0 | 2.0 | 1310 | $1,200 | $0.92 | 16d | 1 | 1.22mi |
| 9662 Sandpiper Ln West Palm Beach, FL | 3.0 | 2.0 | 1961 | $3,200 | $1.63 | 26d | 1 | 1.23mi |
| 113 Sandpiper Ave Royal Palm Beach, FL | 3.0 | 2.0 | 1798 | $3,500 | $1.95 | 13d | 1 | 1.25mi |
| 849 Camellia Dr Royal Palm Beach, FL | 3.0 | 2.0 | 1599 | $3,400 | $2.13 | 26d | 1 | 1.26mi |
| 100 Sparrow Dr #14 Royal Palm Beach, FL | 3.0 | 2.0 | 1737 | $2,725 | $1.57 | 26d | 1 | 1.28mi |
| 11020 Town Cir Wellington, FL | 1.0–3.0 | 1.0–2.0 | 1013 | $3,143 | $3.10 | 3d | 14 | 1.31mi |
| 100 Sparrow Dr #2 Royal Palm Beach, FL | 3.0 | 2.0 | 1824 | $2,725 | $1.49 | 20d | 1 | 1.34mi |
| 139 Sparrow Dr Royal Palm Beach, FL | 2.0–3.0 | 1.5–2.5 | 1100 | $2,390 | $2.17 | 16d | 3 | 1.35mi |
| 11200 Nicole Dr Wellington, FL | 1.0–4.0 | 1.0–3.5 | 1404 | $4,443 | $3.16 | 0d | 33 | 1.39mi |
| 216 Cordoba Cir Royal Palm Beach, FL | 3.0 | 2.0 | 1461 | $3,440 | $2.35 | 1d | 1 | 1.41mi |
| 830 Royal Palm Beach Blvd Royal Palm Beach, FL | 3.0 | 2.0 | 1369 | $2,686 | $1.96 | 1d | 1 | 1.41mi |
| 2108 Shoma Dr Royal Palm Beach, FL | 3.0 | 2.0 | 1457 | $2,400 | $1.65 | 26d | 1 | 1.47mi |
| 1601 Lakeview Dr W Unit 1601 Royal Palm Beach, FL | 3.0 | 2.5 | 1296 | $2,375 | $1.83 | 23d | 1 | 1.47mi |
Listing history 9 events
-
2026-03-27status Pending
-
2026-03-13price $519,900
-
2026-02-08price $529,900
-
2025-12-04$549,900 Active
-
2012-01-11soldstatus $110,000 289-char remark
Show marketing remark (289 chars)
WOOD KIT CABINETS W/CUSTOM TILED COUNTERTOPS, NEW CARPET IN BDRMS, TILED FAMILY RM, DIN AREA & KIT, MASTER BTH HAS UPGRADED DOUBLE SINK VANITY, NEW AC CONDENSER, INGROUND POOL W/DIAMOND BRIGHT FINISH & NEW PUMP & FILTER, PRIVATELY FENCED REAR YARD, CIRCULAR DRIVE, EASY TO SHOW
-
2012-01-04historical 289-char remark
Show marketing remark (289 chars)
WOOD KIT CABINETS W/CUSTOM TILED COUNTERTOPS, NEW CARPET IN BDRMS, TILED FAMILY RM, DIN AREA & KIT, MASTER BTH HAS UPGRADED DOUBLE SINK VANITY, NEW AC CONDENSER, INGROUND POOL W/DIAMOND BRIGHT FINISH & NEW PUMP & FILTER, PRIVATELY FENCED REAR YARD, CIRCULAR DRIVE, EASY TO SHOW
-
2011-11-23$119,900 289-char remark
Show marketing remark (289 chars)
WOOD KIT CABINETS W/CUSTOM TILED COUNTERTOPS, NEW CARPET IN BDRMS, TILED FAMILY RM, DIN AREA & KIT, MASTER BTH HAS UPGRADED DOUBLE SINK VANITY, NEW AC CONDENSER, INGROUND POOL W/DIAMOND BRIGHT FINISH & NEW PUMP & FILTER, PRIVATELY FENCED REAR YARD, CIRCULAR DRIVE, EASY TO SHOW
-
1991-03-15soldstatus $77,900
-
1988-03-01soldstatus $71,900
ⓘ Source: listings_history table (triggers on properties + properties_extension) + one-shot
backfill from property_details.listing_events for pre-trigger history.
Tax reassessment forecast FL · Resets to sale price
- Current annual tax
- $3,619 · $302/mo
- Projected year-2 tax
- $4,315 · $360/mo
- Expected delta
- +$696/yr (+$58/mo · 19.2%)
ⓘ Screening estimate from a state-policy table — verify with the county assessor before closing.
Climate risk First Street
- Flood 1/10 Low FEMA zone X (unshaded) · 0% chance over 30 yrs
- Wildfire 2/10 Low
- Heat 10/10 Extreme 7 d/yr ≥107°F today · 26 d/yr by 30 yrs out
- Wind 10/10 Extreme 99% chance of damaging wind over 30 yrs
- Air quality 2/10 Low 0 unhealthy d/yr today · 1 by 30 yrs out
Nearby sold comps map
Loading sold comps map…
Walkable amenities ~0.75 mi
Loading nearby amenities…
Taxation est. · year 1
- Rental income
- $38,436
- − Mortgage interest
- −$29,122
- − Property taxes
- −$3,619
- − Insurance
- −$2,600
- − Repairs & maintenance
- −$3,075
- − Management
- −$3,075
- − Depreciation
- −$15,124
- Taxable loss
- −$18,180
- Est. tax savings @ 24.0%
- +$4,363
- After-tax cash flow
- $-4,209/yr
For passive investors: Depreciation is non-cash, so a rental often shows a tax loss while cash-flowing — sheltering income. Rental losses are passive: they offset passive income freely, and up to $25,000/yr can offset ordinary (W-2) income if you actively participate and your MAGI is under $100k (phasing out to $0 by $150k); unused losses carry forward. On sale, claimed depreciation is recaptured at up to 25%, and gains may owe capital-gains tax (a 1031 exchange can defer both). Figures are a year-1 estimate at your 24.0% rate — not tax advice; consult a CPA.
Schools (NCES district)
- District
- Palm Beach
- NCES district ID
- 1201500
- Math proficiency
- 46% ▼ -16.00%
- Reading proficiency
- 53% ▼ -4.00%
- Median HH income
- $53,943
- Composite
- 42.72/100
- National rank
- #3160
- State rank
- #34 of 73 in FL
Livability — Royal Palm Beach
- Score
- 79/100
- State rank
- #135
- US rank
- #2039
Category grades
Schools grade is shown separately in the Schools card above.
Census & demographics
- Census place
- Royal Palm Beach, FL
- County
- Palm Beach County · 1,438,312 people
- City population
- 75,299
- Metro
- Miami-Fort Lauderdale-Pompano Beach, FL
- Population (ZIP)
- 76,863
- Household income
- $92,591
- Rent vs Own
- Severe rent burden
- 1870.0
Population outlook (Palm Beach County) Hauer SSP2
- Today (2025)
- 1,637,487 people
- By 2030
- 1,743,255 · +6.5%
- By 2040
- 1,948,712 · +19.0%
- By 2050
- 2,132,979 · +30.3%
- By 2075
- 2,530,027 · +54.5%
- By 2100
- 2,706,979 · +65.3%
Race, ethnicity, and origin ACS 2023
- Neighborhood character
- Diverse neighborhood (Simpson 0.70)
- Race & ethnicity
- White 44% Hispanic / Latino 24% Black 23% Two or more races 16% Asian 5%
- Hispanic origin (detail)
- Mexican 2% Puerto Rican 5% Cuban 4% Dominican 2%
- Common ancestry
- Hispanic 6% Romanian 2% Italian 1%
- Foreign-born
- 26% · Canada, Jamaica, China
- Languages at home
- 73% English-only · Spanish 17% French/Haitian/Cajun 4% Other Indo-European 2%
Political lean MEDSL · Palm Beach
- 2024 margin
- Toss-up / Even · D 50.0% · R 49.2%
- 2008→2024 swing
- -22.1pp toward R · 2008: 22.9pp · 2024: 0.8pp
- All cycles
- 2024: D+0.8 2020: D+12.8 2016: D+15.3 2012: D+17.0 2008: D+22.9
Not yet ingested
- Civics
- —
Market trends
- HPI YoY
- ▲ 17.04%
- Current HPI
- 903.78
- Rent YoY
- ▲ 0.85%
- Metro
- Miami-Fort Lauderdale-Pompano Beach, FL
- State GDP YoY
- ▲ 3.28%
- F500 in state
- 36
Industry mix (Fortune 500 HQ in FL)
| Industry | F500 HQs | Revenue |
|---|---|---|
| Industrial Technology | 2 | $29B |
|
||
| Insurance | 2 | $17B |
|
||
| Retail | 1 | $60B |
|
||
| Technology Distribution | 1 | $58B |
|
||
| Homebuilding | 1 | $35B |
|
||
| Technology Manufacturing | 1 | $35B |
|
||
Price history
+623.1% since first listed9 events — show timeline
- 2026-03-27 Pending — Beaches MLS
- 2026-03-13 Price Changed $519,900 Beaches MLS
- 2026-02-08 Price Changed $529,900 Beaches MLS
- 2025-12-04 Listed $549,900 Beaches MLS
- 2012-01-11 Sold (MLS) $110,000 Beaches MLS
- 2012-01-04 Listing Removed — Beaches MLS
- 2011-11-23 Listed $119,900 Beaches MLS
- 1991-03-15 Sold (Public Records) $77,900 Public Records
- 1988-03-01 Sold (Public Records) $71,900 Public Records
Property tax history
+2.9%/yrLatest (2025): $3,619 · +3.4% YoY. Source: county tax records.
Cash-flow waterfall
monthlySold comps — $/sqft
last 12 mo · ≤1 miLoading sold comps…