6749 N Weber Ave · Fresno, CA
Flood risk 6/10 · Moderate
- FEMA flood zone
- X (unshaded)
- Chance of flooding over 30 yrs
- 0.68%
- Est. flood insurance / yr
- $507 – $1,088
Fire risk 7/10 · Major
- Est. fire insurance / yr
- $659 – $1,223
Heat risk 8/10 · Major
- Hot days now (above 105°F)
- 7 days/yr
- Hot days in 30 yrs
- 18 days/yr
Wind risk 1/10 · Minimal
- Chance of severe wind over 30 yrs
- —
Air-quality risk 10/10 · Severe
- Unhealthy air days now
- 37 days/yr
- Unhealthy air days in 30 yrs
- 42 days/yr
Risk factors via First Street. Map © Google.
Why this score? — see what drove the D+ grade
The composite is a weighted blend of 9 inputs, each scored 0–100. Each bar is that input's sub-score; the figure is the points it added to the 100-point composite (weight × sub-score).
- ARV discount +15.0/15.0
- Cash flow +12.0/30.0
- DSCR +3.5/10.0
- Rent growth +3.5/5.0
- 1% rule +3.3/10.0
- Livability +3.1/5.0
- Schools +2.6/10.0
- Condition / age +2.5/5.0
- Appreciation +0.0/10.0
$260,000
🖨 Deal sheet (PDF) 📄 Offer letter ✓ Due diligence
Listing remarks MLS
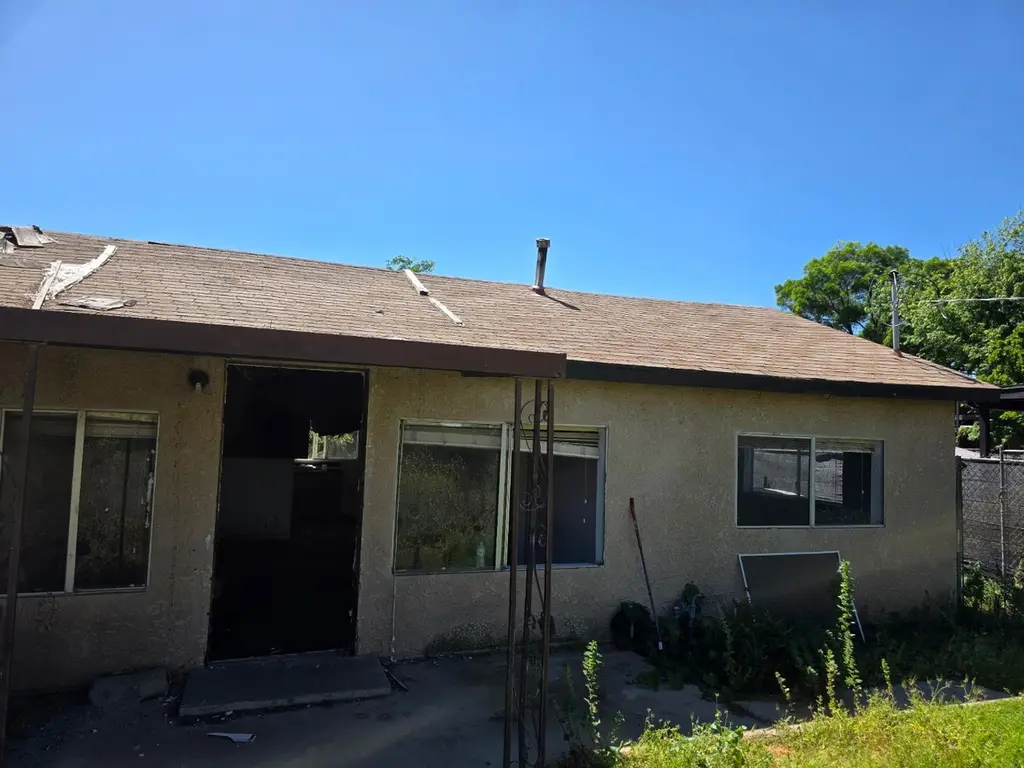
House was recently in a fire and needs work to bring it back up to it's shine. This home has plenty of potential and is located in a great and growing neighborhood. It's conveniently located near highway 99 and all local amenities that includes El Paseo Marketplace, which is at walking distance. Please be safe when entering to view the property.
Key facts
- 6,751 sq ft lot
- Built 1950
- Listed 59 days
Neighborhood map
What this means for you Summary
Snapshot
- This is a 2-bed/1.0-bath single-family listed at $260k.
Deal economics
- At list price, monthly cash flow is $-63 ($-750/yr) — negative.
- To cash-flow at today's rent, offer at most $249k (4.2% below list).
- To meet the 1% rule (rent ≥ 1% of price), the offer needs to be $215k (17.5% below list).
- Recommended offer: $215k (17.5% below list) — sets the bar for 1% rule.
- Cap rate 6.0% vs local median 3.7% in Fresno — top-decile yield for the area; either an underpriced asset or a hidden risk that comps aren't pricing in. Stress-test before assuming the spread holds.
Location & tenants
- Location reads 62/100 on livability (#469 in CA) — a middle-class / working-renter tenant base. Strengths: commute A+, housing A+; Watch: amenities D+, employment D+, schools D.
- Central Unified (urban): math 18% / reading 40% proficiency, ranked #345 of 517 in CA (top 67%) — low school quality limits family demand, transient renter base, plan for 1-2y turnover.
- Market conditions: Rents rising (+3.8%/yr); 194 active listings in the ZIP; 2 comparable units currently listed for rent nearby; solid renter incomes; 2,426 units permitted in Fresno County in 2024 (296 in 5+ unit buildings).
- This rent runs 32% of the median local income ($80k/yr) — at the standard rent-burdened threshold; future hikes will face affordability resistance.
Forward outlook
- Local home prices are declining (-3.0%/yr); year-one equity from $2k of loan paydown is wiped out by about $8k of value loss. Plan a longer hold.
- Fresno County population projected at +11% by 2050 — modest demand growth; plan on rents tracking national, not racing it.
Negotiation context
- It's been on market 60 days — a 3% lower offer ($252k) is reasonable based on typical stale-listing flexibility.
- 6 sale attempts since 19y ago with the ask held roughly flat each time — persistent listings suggest the price (not the market) is what's stuck; bring a comps-based counter.
- Current owner paid $224k; 16% above their basis — modest negotiation headroom, anchor on the comps not their cost.
Risks & watch-outs
- Watch-outs: built in 1950 — expect roof / HVAC / electrical / plumbing capex.
- Climate carrying-cost: major flood risk; major wildfire risk; extreme-heat days projected 7→18/yr by 2055 (HVAC capex compounding) — expect insurance premiums to compound above CPI over the hold.
Questions for the listing agent
- What do current leases actually rent for vs. the listed asking? Can we see a recent rent roll and the last 12 months of T-12 income?
- It's been on market 60 days. Have you received any prior offers? Is the seller open to a 17% concession, seller financing, or rate buy-down credit?
- Built in 1950 — when were the roof, HVAC, electrical panel, plumbing, and water heater last replaced?
- Is there a deadline driving the sale (1031 exchange, divorce, estate, relocation)? That informs how much negotiation room exists.
- Schools are D-rated, which usually means shorter tenancies and higher turnover. Who's the typical renter profile here, and what's been the actual vacancy rate?
- Crime grade is F in this area — have there been break-ins, vandalism, or insurance claims at this property in the last 3 years? What carrier currently insures it and at what premium?
- The area grade is low — what's the realistic commute time and amenity access for the typical tenant pool here? Any planned neighborhood developments (good or bad) we should know about?
- What's the average days-on-market for RENTAL listings here right now (not sales)? A rising rental-DOM trend means longer vacancies and softer asking-rent achievability than the comps imply.
- What's the recent tenant-quality profile in this submarket — average credit score on applications, eviction rate, late-payment / NSF rate, and stable-employment percentage? A property-management company in the area should have these aggregated.
- How much new for-sale + rental construction is in the pipeline within 1–3 miles? Heavy new supply typically softens prices + rents 12–24 months out; constrained supply supports both.
Investment metrics
- 1% rule
- 0.83% ✗
- Cap rate
- 6.00%
- Cash-on-cash
- -1.03%
- DSCR
- 0.95
- GRM
- 10.1
CMA / ARV
- ARV (median comp)
- $481,025
- List price
- $260,000
- Delta
- -45.95%
- Verdict
- UNDERPRICED
- Comps
- 20 within 1.0 mi
Show comp detail 12 sales within ~0.75 mi
| Address | Dist | Beds/Ba | Sqft | Sold | Price | $/sf | Match |
|---|---|---|---|---|---|---|---|
| 7093 N Astoria Dr | 0.64mi | 2/2.0 | 1,560 (-0%) | 2mo | $380,000 | $244 | 64 |
| 7093 N Astoria Dr | 0.64mi | 2/2.5 | 1,560 (-0%) | 2mo | $380,000 | $244 | 62 |
| 6153 W Marble Hill Dr | 0.70mi | 2/2.2 | 1,560 (-0%) | 1mo | $369,000 | $237 | 61 |
| 6674 W Hailey Dr | 0.49mi | 3/2.0 (+1) | 1,766 (+13%) | 0mo | $436,000 | $247 | 46 |
| 6808 W Lucas | 0.56mi | 3/2.0 (+1) | 1,766 (+13%) | 2mo | $419,000 | $237 | 41 |
| 6910 W Gibson Ave | 0.70mi | 3/2.0 (+1) | 1,405 (-10%) | 6mo | $437,500 | $311 | 36 |
| 7005 N Astoria Dr | 0.61mi | 3/2.5 (+1) | 1,753 (+12%) | 6mo | $399,950 | $228 | 35 |
| 7326 N Lacey Dr | 0.54mi | 3/2.0 (+1) | 1,766 (+13%) | 12mo | $455,500 | $258 | 35 |
| 6108 W Dupont Dr | 0.69mi | 3/2.5 (+1) | 1,753 (+12%) | 2mo | $399,999 | $228 | 34 |
| 6822 W Stuart | 0.65mi | 3/2.0 (+1) | 1,405 (-10%) | 13mo | $440,000 | $313 | 33 |
| 7018 N Brookdale Dr | 0.71mi | 3/2.5 (+1) | 1,753 (+12%) | 9mo | $395,650 | $226 | 29 |
| 6075 W Menlo Ave | 0.73mi | 3/2.0 (+1) | 1,798 (+15%) | 8mo | $470,000 | $261 | 26 |
Match score weights: distance 35% · size 25% · config 20% · recency 20%. Top-matched comps best support the ARV.
Projected returns pro-forma
-3.0% appreciation · 3.82% rent growth · sell at horizon
- IRR
- -17.1%
- Equity multiple
- 0.39×
- Total profit
- $-44,321
- Equity at exit
- $38,767
- IRR
- -7.6%
- Equity multiple
- 0.50×
- Total profit
- $-36,243
- Equity at exit
- $22,480
Cash invested: $72,800 (down + closing). Projections, not guarantees.
Landlord ↔ Tenant lean methodology
- Overall (STATE)
- 18 Strongly Tenant-Friendly
- State California
- 18 Strongly Tenant-Friendly · D+13
- County
- — inherits STATE
- City
- — inherits STATE
ZIP-level market 93722
- Rents YoY
- 3.8%
- Active inventory
- 194
- Price-to-rent
- 10.1×
Monthly cashflow live
- Estimated rent
- $2,145 medium interval (Pro) →
- Mortgage (P&I)
- −$1,363
- Tax from tax record
- −$285 /mo · $3,424/yr
- Insurance
- −$108
- HOA
- −$0
- Vacancy / Maint / Mgmt
- −$450
- Net cashflow
- $-63
Break-even live
Sensitivity live
| Price | -10% $85 | -5% $11 | +0% $-63 | +5% $-136 | +10% $-210 |
|---|---|---|---|---|---|
| Rent | -10% $-232 | -5% $-147 | +0% $-63 | +5% $22 | +10% $107 |
| Rate | -1.0pp $68 | -0.5pp $4 | base $-63 | +0.5pp $-130 | +1.0pp $-198 |
UW: 25.0% down · 7.5% · 30yr · 1.5% tax · 5.0% vac · 8.0% maint · 8.0% mgmt
Financing live
Cash to close
- Down payment
- $65,000
- Closing costs
- $7,800
- Reserves months
- —
- Total cash needed
- —
Loan-product check · same deal, 3 products live
Conventional
25% down · 7.5% · 30yr
- Down + closing
- —
- Monthly P&I
- —
- Monthly cashflow
- —
- DSCR
- —
- Eligible?
- —
Personal DTI + credit; lowest rate.
DSCR
20% down · 8.5% · 30yr
- Down + closing
- —
- Monthly P&I
- —
- Monthly cashflow
- —
- DSCR
- —
- Eligible?
- —
No personal income docs; deal must DSCR.
Hard money
10% down · 12.0% · 12mo
- Down + closing
- —
- Monthly P&I
- —
- Monthly cashflow
- —
- DSCR
- —
- Eligible?
- —
Short-term bridge; refi at stabilization.
Rent comps 2 comps
| Address | Beds | Baths | Sqft | Rent | $/sqft | DOM | Units | Dist |
|---|---|---|---|---|---|---|---|---|
| 5808 W Fir Ave Fresno, CA | 3.0 | 2.0 | 1746 | $2,195 | $1.26 | 11d | 1 | 1.02mi |
| 5811 W Sample Ave Fresno, CA | 3.0 | 2.0 | 1242 | $2,095 | $1.69 | 45d | 1 | 1.13mi |
Listing history 35 events
-
2026-06-21days on market $260,000 Active 60 DOM
-
2026-06-18days on market $260,000 Active 57 DOM
-
2026-06-17days on market $260,000 Active 56 DOM
-
2026-06-16days on market $260,000 Active 55 DOM
-
2026-06-15days on market $260,000 Active 54 DOM
-
2026-06-13days on market $260,000 Active 52 DOM
-
2026-06-13days on market $260,000 Active 51 DOM
-
2026-06-10days on market $260,000 Active 49 DOM
-
2026-06-09days on market $260,000 Active 48 DOM
-
2026-06-08days on market $260,000 Active 47 DOM
-
2026-06-07days on market $260,000 Active 46 DOM
-
2026-06-03days on market $260,000 Active 42 DOM
-
2026-06-02days on market $260,000 Active 41 DOM
-
2026-06-01days on market $260,000 Active 40 DOM
-
2026-05-31days on market $260,000 Active 39 DOM
-
2026-05-18status Active 347-char remark
Show marketing remark (347 chars)
House was recently in a fire and needs work to bring it back up to it's shine. This home has plenty of potential and is located in a great and growing neighborhood. It's conveniently located near highway 99 and all local amenities that includes El Paseo Marketplace, which is at walking distance. Please be safe when entering to view the property.
-
2026-05-11status Pending 347-char remark
Show marketing remark (347 chars)
House was recently in a fire and needs work to bring it back up to it's shine. This home has plenty of potential and is located in a great and growing neighborhood. It's conveniently located near highway 99 and all local amenities that includes El Paseo Marketplace, which is at walking distance. Please be safe when entering to view the property.
-
2026-04-14$260,000 Active 347-char remark
Show marketing remark (347 chars)
House was recently in a fire and needs work to bring it back up to it's shine. This home has plenty of potential and is located in a great and growing neighborhood. It's conveniently located near highway 99 and all local amenities that includes El Paseo Marketplace, which is at walking distance. Please be safe when entering to view the property.
-
2021-03-29price $215,000 289-char remark
Show marketing remark (289 chars)
Turn key rental. Currently rented at $1,300/mo with current lease until 3/31/2021. Well maintained and upgraded house. New flooring, counter tops, cabinets, and paint throughout. Located near the El Paseo Shopping Center. No sign located on the property. Please do not disturb the tenants.
-
2021-03-18soldstatus $224,000 Sold 289-char remark
Show marketing remark (289 chars)
Turn key rental. Currently rented at $1,300/mo with current lease until 3/31/2021. Well maintained and upgraded house. New flooring, counter tops, cabinets, and paint throughout. Located near the El Paseo Shopping Center. No sign located on the property. Please do not disturb the tenants.
-
2020-12-22status Backup 289-char remark
Show marketing remark (289 chars)
Turn key rental. Currently rented at $1,300/mo with current lease until 3/31/2021. Well maintained and upgraded house. New flooring, counter tops, cabinets, and paint throughout. Located near the El Paseo Shopping Center. No sign located on the property. Please do not disturb the tenants.
-
2020-12-17price $224,000 289-char remark
Show marketing remark (289 chars)
Turn key rental. Currently rented at $1,300/mo with current lease until 3/31/2021. Well maintained and upgraded house. New flooring, counter tops, cabinets, and paint throughout. Located near the El Paseo Shopping Center. No sign located on the property. Please do not disturb the tenants.
-
2020-09-04$215,000 Active 289-char remark
Show marketing remark (289 chars)
Turn key rental. Currently rented at $1,300/mo with current lease until 3/31/2021. Well maintained and upgraded house. New flooring, counter tops, cabinets, and paint throughout. Located near the El Paseo Shopping Center. No sign located on the property. Please do not disturb the tenants.
-
2015-12-07historical Cancelled
-
2015-12-04$92,900 Active
-
2011-02-25soldstatus $47,000
-
2011-01-31price $52,900
-
2011-01-31historical
-
2010-12-30$47,000
-
2007-04-09price $199,500
-
2007-03-29soldstatus $207,500
-
2007-03-29soldstatus $207,500
-
2007-01-27historical
-
2007-01-18$207,500
-
2005-07-26soldstatus $70,000
ⓘ Source: listings_history table (triggers on properties + properties_extension) + one-shot
backfill from property_details.listing_events for pre-trigger history.
Tax reassessment forecast CA · Resets to sale price
- Current annual tax
- $3,424 · $285/mo
- Projected year-2 tax
- $3,424 · $285/mo
- Expected delta
- $0/yr ($0/mo · 0.0%)
ⓘ Screening estimate from a state-policy table — verify with the county assessor before closing.
Climate risk First Street
- Flood 6/10 Major FEMA zone X (unshaded) · 68% chance over 30 yrs
- Wildfire 7/10 Severe
- Heat 8/10 Severe 7 d/yr ≥105°F today · 18 d/yr by 30 yrs out
- Wind 1/10 Low
- Air quality 10/10 Extreme 37 unhealthy d/yr today · 42 by 30 yrs out
Nearby sold comps map
Loading sold comps map…
Walkable amenities ~0.75 mi
Loading nearby amenities…
Taxation est. · year 1
- Rental income
- $25,741
- − Mortgage interest
- −$14,564
- − Property taxes
- −$3,424
- − Insurance
- −$1,300
- − Repairs & maintenance
- −$2,059
- − Management
- −$2,059
- − Depreciation
- −$7,564
- Taxable loss
- −$5,229
- Est. tax savings @ 24.0%
- +$1,255
- After-tax cash flow
- $505/yr
For passive investors: Depreciation is non-cash, so a rental often shows a tax loss while cash-flowing — sheltering income. Rental losses are passive: they offset passive income freely, and up to $25,000/yr can offset ordinary (W-2) income if you actively participate and your MAGI is under $100k (phasing out to $0 by $150k); unused losses carry forward. On sale, claimed depreciation is recaptured at up to 25%, and gains may owe capital-gains tax (a 1031 exchange can defer both). Figures are a year-1 estimate at your 24.0% rate — not tax advice; consult a CPA.
Schools (NCES district)
- District
- Central Unified
- NCES district ID
- 0607970
- Math proficiency
- 18% ▼ -15.00%
- Reading proficiency
- 40% ▼ -5.00%
- Median HH income
- $58,363
- Composite
- 26.08/100
- National rank
- #7294
- State rank
- #345 of 517 in CA
Livability — Fresno
- Score
- 62/100
- State rank
- #469
- US rank
- #15907
Category grades
Schools grade is shown separately in the Schools card above.
Census & demographics
- Census place
- Fresno, CA
- County
- Fresno County · 834,801 people
- City population
- 593,114
- Metro
- Fresno, CA
- Population (ZIP)
- 86,110
- Household income
- $80,285
- Rent vs Own
- Severe rent burden
- 3033.0
Population outlook (Fresno County) Hauer SSP2
- Today (2025)
- 1,042,971 people
- By 2030
- 1,072,198 · +2.8%
- By 2040
- 1,122,408 · +7.6%
- By 2050
- 1,157,251 · +11.0%
- By 2075
- 1,182,575 · +13.4%
- By 2100
- 1,105,899 · +6.0%
Race, ethnicity, and origin ACS 2023
- Neighborhood character
- Diverse neighborhood (Simpson 0.68)
- Race & ethnicity
- Hispanic / Latino 50% Two or more races 26% White 22% Asian 15% Black 9% Native American 1%
- Hispanic origin (detail)
- Mexican 46%
- Common ancestry
- Russian 1% Lithuanian 1% Slovak 1%
- Foreign-born
- 20% · Canada, Vietnam
- Languages at home
- 57% English-only · Spanish 28% Other Indo-European 8% Other Asian/Pacific 3%
Political lean MEDSL · Fresno
- 2024 margin
- Toss-up / Even · D 46.5% · R 50.9% · Other 2.6%
- 2008→2024 swing
- -6.5pp toward R · 2008: 2.1pp · 2024: -4.4pp
- All cycles
- 2024: R+4.4 2020: D+7.8 2016: D+3.9 2012: R+2.9 2008: D+2.1
Not yet ingested
- Civics
- —
Market trends
- HPI YoY
- ▼ -409.00%
- Current HPI
- 364.934
- Rent YoY
- ▲ 3.82%
- Metro
- Fresno, CA
- State GDP YoY
- ▲ 3.21%
- F500 in state
- 116
Industry mix (Fortune 500 HQ in CA)
| Industry | F500 HQs | Revenue |
|---|---|---|
| Technology | 27 | $1,492B |
|
||
| Financial Services | 3 | $174B |
|
||
| Retail | 3 | $44B |
|
||
| Insurance | 3 | $26B |
|
||
| Media / Entertainment | 2 | $115B |
|
||
| Pharmaceuticals / Biotech | 2 | $62B |
|
||
Price history
+271.4% since first listed20 events — show timeline
- 2026-05-18 Relisted — FRESNOMLS
- 2026-05-11 Pending — FRESNOMLS
- 2026-04-14 Listed $260,000 FRESNOMLS
- 2021-03-29 Price Changed $215,000 FRESNOMLS
- 2021-03-18 Sold (MLS) $224,000 FRESNOMLS
- 2020-12-22 Pending — FRESNOMLS
- 2020-12-17 Price Changed $224,000 FRESNOMLS
- 2020-09-04 Listed $215,000 FRESNOMLS
- 2015-12-07 Delisted — FRESNOMLS
- 2015-12-04 Listed $92,900 FRESNOMLS
- 2011-02-25 Sold (MLS) $47,000 FRESNOMLS
- 2011-01-31 Delisted — FRESNOMLS
- 2011-01-31 Price Changed $52,900 FRESNOMLS
- 2010-12-30 Listed $47,000 FRESNOMLS
- 2007-04-09 Price Changed $199,500 FRESNOMLS
- 2007-03-29 Sold (Public Records) $207,500 Public Records
- 2007-03-29 Sold (MLS) $207,500 FRESNOMLS
- 2007-01-27 Delisted — FRESNOMLS
- 2007-01-18 Listed $207,500 FRESNOMLS
- 2005-07-26 Sold (Public Records) $70,000 Public Records
Property tax history
+17.0%/yrLatest (2025): $3,424 · +12.0% YoY. Source: county tax records.
Cash-flow waterfall
monthlySold comps — $/sqft
last 12 mo · ≤1 miLoading sold comps…