 Multi-family
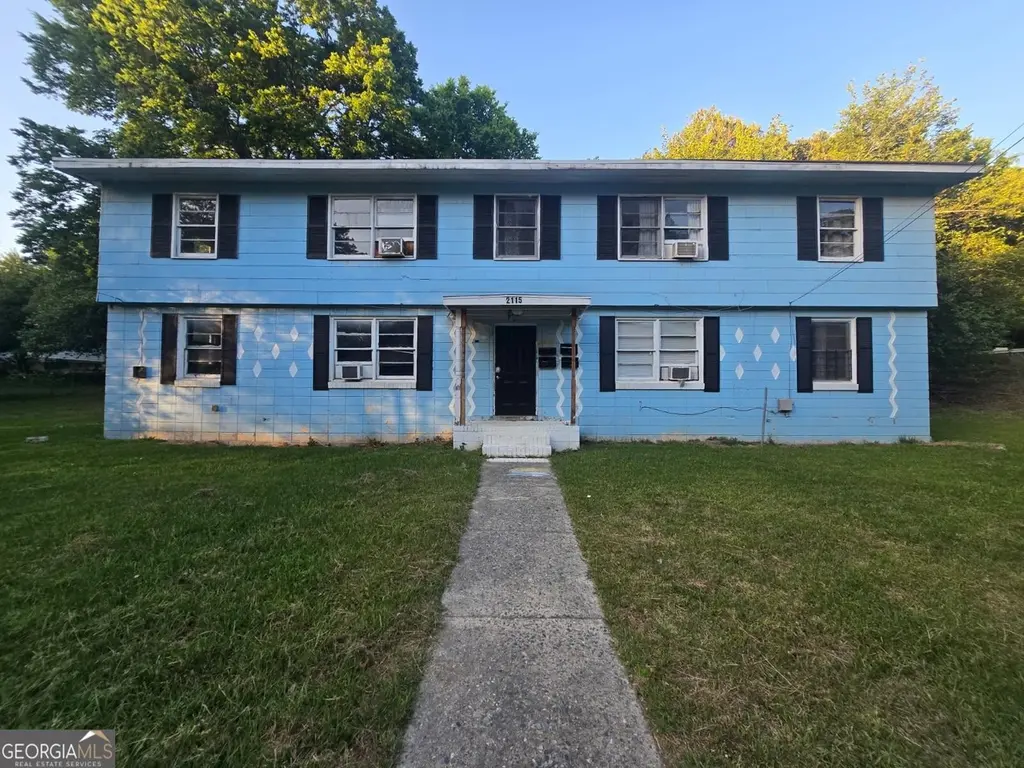
2115 Hazelhurst St · Macon-Bibb County, GA
Flood risk 9/10 · Severe
- FEMA flood zone
- X (unshaded)
- Chance of flooding over 30 yrs
- 0.98%
- Est. flood insurance / yr
- $507 – $1,088
Fire risk 1/10 · Minimal
- Est. fire insurance / yr
- $963 – $1,789
Heat risk 7/10 · Major
- Hot days now (above 108°F)
- 7 days/yr
- Hot days in 30 yrs
- 17 days/yr
Wind risk 6/10 · Moderate
- Chance of severe wind over 30 yrs
- 66.0%
Air-quality risk 3/10 · Minor
- Unhealthy air days now
- 3 days/yr
- Unhealthy air days in 30 yrs
- 4 days/yr
Risk factors via First Street. Map © Google.
Why this score? — see what drove the C+ grade
The composite is a weighted blend of 9 inputs, each scored 0–100. Each bar is that input's sub-score; the figure is the points it added to the 100-point composite (weight × sub-score).
- Cash flow +27.0/30.0
- DSCR +9.3/10.0
- ARV discount +7.5/15.0
- 1% rule +7.3/10.0
- Rent growth +3.7/5.0
- Livability +2.5/5.0
- Condition / age +2.2/5.0
- Schools +1.2/10.0
- Appreciation +0.0/10.0
$349,000
🖨 Deal sheet 📄 Offer letter ✓ Due diligence
Multi-family units
County records classify this as Multi-Family (2-4 Unit). Listing-text estimate: 1 unit. estimate disagrees with records
Listing remarks
This apartment building in located in highly desirable Vineville, which is one of Macon's most prominent and historic neighborhoods! With its sought-after and convenient location, this efficiently designed quadraplex features four (4) approximately 800+ square feet units; this apartment building is conducive to high occupancy, low maintenance cashflow. Located in a historic major corridor, the property is conveniently centered along U. S. Route 41, between suburban west Macon and the urban downtown city central. This quadraplex is could be rented to students and medical professionals (since Mercer University and Atruim Health Navicent are only 2-3 miles from the building) etc. It also is we
Key facts
- Inviting yard
- 0.33 acre lot
- Built 1958
Tags
Property features AI
Finance
- Other: Lot about 0.33 acre (owner-provided); Address: 2115 Hazelhurst St, Macon, GA 31204; Coordinates: -83.6556107, 32.8417507
- HOA & community: No association
Exterior
- Parking: Off-street parking
- Utilities: Public water; Public sewer; Sewer connected; Underground utilities
- Home design: Residential income property; Quadruplex
- Construction: Built in 1958
- Exterior features: Brick construction; Street lights nearby; Walking distance to schools; Near shopping
Interior
- Bedrooms: Multi-unit property with 4 total units
- Heating & cooling: Baseboard heating; Window cooling units
- Interior features: Two levels; Updated/remodeled condition; No basement; No fireplaces
Neighborhood map
What this means for you Summary
Snapshot
- This is a multifamily listed at $349k. Condition is rated fair.
Deal economics
- At list price, monthly cash flow is $908 ($11k/yr) — positive.
- The deal already cash-flows at list — no discount required.
- Meets the 1% rule at list price ($4k rent vs $349k).
- Recommended offer: $339k (3.0% below list) — sets the bar for market timing.
- Cap rate 9.6% vs local median 5.4% in Macon-Bibb County — top-decile yield for the area; either an underpriced asset or a hidden risk that comps aren't pricing in. Stress-test before assuming the spread holds.
Location & tenants
- Location reads: area grade C — affects rentability + tenant quality, not the cash-flow math above.
- Bibb County (urban): math 11% / reading 18% proficiency, ranked #161 of 174 in GA (top 92%) — low school quality limits family demand, transient renter base, plan for 1-2y turnover; 75% free/reduced lunch — lower-income household profile, screen leases tightly.
- Zoned schools: Williams Elementary School (math 2% / reading 8%, grade F, #1,160 of 1,228 statewide, top 98%, 349 students, 100% FRL); Miller Magnet Middle School (math 16% / reading 33%, grade F, #301 of 470 statewide, top 66%, 585 students, 100% FRL); Central High School (math 8% / reading 2%, grade F, #394 of 424 statewide, top 97%, 844 students, 100% FRL) — zoned schools average 100% FRL vs 75% district-wide (25 pts higher); higher-poverty schools than district average — tighter screening recommended.
- Market conditions: Rents rising fast (+4.6%/yr); 255 active listings in the ZIP; 40 comparable units currently listed for rent nearby; rentals lingering (median 44d on market — plan ~5-8 weeks vacancy on turnover, expect pricing pressure); 50% of comp listings sitting > 30 days — soft ceiling on asking rent; lower-income renter base — watch delinquency; 154 units permitted in Bibb County in 2024 (0 in 5+ unit buildings).
- At $4,286/mo this rent would consume 133% of the median local household income ($39k/yr) (locally 2674% of renters already pay >50% of income on rent) — very limited rent-growth headroom before tenants either downsize or default.
Forward outlook
- Local home prices are declining (-3.0%/yr); year-one equity from $2k of loan paydown is wiped out by about $10k of value loss. Plan a longer hold.
- Bibb County population projected at -12% by 2050 — secular population decline; favor cash flow + early exit over multi-decade hold.
- At projected returns (-3.0% appreciation + 4.6% rent growth), your $98k cash investment doubles in ~9 years — after that, you're playing with house money.
Negotiation context
- It's been on market 46 days — a 3% lower offer ($339k) is reasonable based on typical stale-listing flexibility.
Risks & watch-outs
- Watch-outs: flood insurance adds $66/mo; built in 1958 — expect roof / HVAC / electrical / plumbing capex.
- Climate carrying-cost: severe flood risk; major wind risk, 66% chance of damaging wind over 30y; extreme-heat days projected 7→17/yr by 2055 (HVAC capex compounding) — expect insurance premiums to compound above CPI over the hold.
Questions for the listing agent
- It's been on market 46 days. Have you received any prior offers? Is the seller open to a 3% concession, seller financing, or rate buy-down credit?
- Have any recent inspections been done? Can we get a copy of the seller's disclosures and any deferred-maintenance estimates?
- Built in 1958 — when were the roof, HVAC, electrical panel, plumbing, and water heater last replaced?
- What's the actual annual flood-insurance premium (NFIP or private), and is the property in a SFHA with mandatory coverage?
- Is there a deadline driving the sale (1031 exchange, divorce, estate, relocation)? That informs how much negotiation room exists.
- What's the average days-on-market for RENTAL listings here right now (not sales)? A rising rental-DOM trend means longer vacancies and softer asking-rent achievability than the comps imply.
- What's the recent tenant-quality profile in this submarket — average credit score on applications, eviction rate, late-payment / NSF rate, and stable-employment percentage? A property-management company in the area should have these aggregated.
- How much new apartment / multifamily construction is in the pipeline within 1–3 miles? Heavy new supply (>2% of stock underway) typically softens rents 12–24 months out; light construction supports rent growth.
Investment metrics
- 1% rule
- 1.23% ✓
- Cap rate
- 9.64%
- Cash-on-cash
- 11.96%
- DSCR
- 1.53
- GRM
- 6.8
CMA / ARV
- ARV (median comp)
- $164,239
- List price
- $349,000
- Delta
- 112.50%
- Verdict
- OVERPRICED
- Comps
- 7 within 1.0 mi
Show comp detail 12 sales within ~0.75 mi
| Address | Dist | Beds/Ba | Sqft | Sold | Price | $/sf | Match |
|---|---|---|---|---|---|---|---|
| 155 Calloway Dr | 0.44mi | 4/— | — | 3mo | $220,000 | — | 65 |
| 234 Cleveland Ave | 0.33mi | —/— | — | 11mo | $180,000 | — | 62 |
| 2418 Vineville Ave | 0.31mi | 14/7.0 | 5,200 | 15mo | $460,000 | $88 | 61 |
| 1687 Lawton Ave | 0.57mi | 6/4.0 | — | 2mo | $350,000 | — | 59 |
| 1145 Patterson St | 0.53mi | 6/2.0 | — | 8mo | $240,000 | — | 56 |
| 2607 Beech Ave | 0.63mi | 4/— | — | 4mo | $250,000 | — | 55 |
| 372 Grier St | 0.62mi | —/— | — | 6mo | $270,000 | — | 54 |
| 1680 Lawton Ave | 0.57mi | 6/3.0 | — | 11mo | $272,000 | — | 51 |
| 1177 Huguenin Ave | 0.48mi | 4/2.0 | 2,000 | 19mo | $29,000 | $15 | 49 |
| 1262 Linden Ave | 0.66mi | 4/3.0 | — | 9mo | $339,000 | — | 49 |
| 1148 Hillyer Ave | 0.70mi | —/— | — | 7mo | $90,000 | — | 49 |
| 254 Ward St | 0.58mi | —/— | — | 16mo | $32,000 | — | 47 |
Match score weights: distance 35% · size 25% · config 20% · recency 20%. Top-matched comps best support the ARV.
Projected returns pro-forma
-3.0% appreciation · 4.61% rent growth · sell at horizon
- IRR
- 2.2%
- Equity multiple
- 1.09×
- Total profit
- $8,413
- Equity at exit
- $52,037
- IRR
- 13.3%
- Equity multiple
- 2.15×
- Total profit
- $112,104
- Equity at exit
- $30,175
Cash invested: $97,720 (down + closing). Projections, not guarantees.
Landlord ↔ Tenant lean methodology
- Overall (STATE)
- 90 Strongly Landlord-Friendly
- State Georgia
- 90 Strongly Landlord-Friendly · R+3
- County
- — inherits STATE
- City
- — inherits STATE
ZIP-level market 31204
- Rents YoY
- 4.6%
- Active inventory
- 255
- Price-to-rent
- 27.1×
Monthly cashflow live
- Estimated rent
- $4,286 high interval (Pro) →
- Mortgage (P&I)
- −$1,830
- Tax est. 1.5%
- −$436 /mo · $5,235/yr
- Insurance
- −$145
- Flood insurance flood zone
- −$66 /mo · $798/yr
- HOA
- −$0
- Vacancy / Maint / Mgmt
- −$900
- Net cashflow
- $908
Break-even live
4-unit breakdown (identical units grouped — click to expand)
| Units | Beds | Baths | Est. rent |
|---|---|---|---|
| 4× units | 2 | 1 | $4,284 |
| #1 | 2 | 1 | $1,071 |
| #2 | 2 | 1 | $1,071 |
| #3 | 2 | 1 | $1,071 |
| #4 | 2 | 1 | $1,071 |
| Total (4 units) | $4,286 | ||
UW: 25.0% down · 7.5% · 30yr · 1.5% tax · 5.0% vac · 8.0% maint · 8.0% mgmt
Financing live
Cash to close
- Down payment
- $87,250
- Closing costs
- $10,470
- Reserves months
- —
- Total cash needed
- —
Loan-product check · same deal, 3 products live
Conventional
25% down · 7.5% · 30yr
- Down + closing
- —
- Monthly P&I
- —
- Monthly cashflow
- —
- DSCR
- —
- Eligible?
- —
Personal DTI + credit; lowest rate.
DSCR
20% down · 8.5% · 30yr
- Down + closing
- —
- Monthly P&I
- —
- Monthly cashflow
- —
- DSCR
- —
- Eligible?
- —
No personal income docs; deal must DSCR.
Hard money
10% down · 12.0% · 12mo
- Down + closing
- —
- Monthly P&I
- —
- Monthly cashflow
- —
- DSCR
- —
- Eligible?
- —
Short-term bridge; refi at stabilization.
Rent comps 40 comps
| Address | Beds | Baths | Sqft | Rent | $/sqft | DOM | Units | Dist |
|---|---|---|---|---|---|---|---|---|
| 260 Ryals Ave Macon, GA | 2.0 | 1.0 | 690 | $875 | $1.27 | 44d | 1 | 0.03mi |
| 2350 English Ave Apt 3D Macon, GA | 3.0 | 1.5 | 980 | $1,095 | $1.12 | 44d | 1 | 0.10mi |
| 2056 Vineville Ave Unit 25 Macon, GA | 1.0 | 1.0 | 621 | $825 | $1.33 | 13d | 1 | 0.15mi |
| 2063 Vineville Ave Unit N5 Macon, GA | 3.0 | 2.0 | 1169 | $1,200 | $1.03 | 21d | 1 | 0.26mi |
| 185 Oak Haven Ave Apt A4 Macon, GA | 3.0 | 2.0 | 1100 | $1,200 | $1.09 | 21d | 1 | 0.26mi |
| 2020 Vineville Ave Apt 31 Macon, GA | 1.0 | 1.0 | 550 | $800 | $1.45 | 13d | 1 | 0.28mi |
| 121 Culver St Macon, GA | 2.0 | 2.0 | — | $950 | — | 44d | 1 | 0.28mi |
| 132 Oak Haven Ave Macon, GA | 2.0 | 1.0 | 720 | $975 | $1.35 | 44d | 1 | 0.30mi |
| 2259 Robin Lyn Ct Unit 31204 Macon, GA | 2.0 | 2.5 | 1560 | $1,295 | $0.83 | 44d | 1 | 0.35mi |
| 2259 Robin Lyn Ct Macon, GA | 2.0 | 3.0 | 1560 | $1,295 | $0.83 | 44d | 1 | 0.35mi |
| 2261 Robin Lyn Ct Unit 31204 Macon, GA | 2.0 | 2.5 | 1560 | $1,295 | $0.83 | 44d | 1 | 0.35mi |
| 2261 Robin Lyn Ct Macon, GA | 2.0 | 3.0 | 1560 | $1,295 | $0.83 | 44d | 1 | 0.35mi |
| 2269 Robin Lyn Ct Macon, GA | 3.0 | 3.0 | 1560 | $1,375 | $0.88 | 21d | 1 | 0.35mi |
| 2269 Robin Lyn Ct Unit 31204 Macon, GA | 3.0 | 2.5 | 1560 | $1,375 | $0.88 | 21d | 1 | 0.35mi |
| 130 Calloway Dr Macon, GA | 2.0 | 2.0 | 950 | $950 | $1.00 | 44d | 1 | 0.39mi |
| 1049 Birch St Macon, GA | 2.0 | 1.0 | — | $700 | — | 21d | 1 | 0.41mi |
| 2154 Napier Ave Macon, GA | 3.0 | 1.0 | 1344 | $1,400 | $1.04 | 21d | 1 | 0.43mi |
| 1975 Vineville Ave Apt F3 Macon, GA | 1.0 | 1.0 | 950 | $700 | $0.74 | 13d | 1 | 0.43mi |
| 1975 Vineville Ave Macon, GA | 1.0–3.0 | 1.0 | 1050 | $825 | $0.79 | 21d | 5 | 0.44mi |
| 455 Pursley St Apt B15 Macon, GA | 1.0 | 1.0 | 850 | $650 | $0.76 | 13d | 1 | 0.46mi |
| 455 Pursley St Macon, GA | 1.0 | 1.0 | 850 | $625 | $0.74 | 21d | 9 | 0.47mi |
| 1249 Duncan Ave Unit B Macon, GA | 2.0 | 2.0 | 700 | $1,095 | $1.56 | 44d | 1 | 0.49mi |
| 1249 Duncan Ave Unit C Macon, GA | 2.0 | 2.0 | 900 | $795 | $0.88 | 44d | 1 | 0.49mi |
| 2663 Hillcrest Ave Macon, GA | 3.0 | 2.0 | 1931 | $1,395 | $0.72 | 21d | 1 | 0.52mi |
| 2585 Napier Ave Unit B Macon, GA | 2.0 | 2.0 | 644 | $850 | $1.32 | 21d | 1 | 0.53mi |
| 2585 Napier Ave Unit A Macon, GA | 2.0 | 2.0 | 2007 | $950 | $0.47 | 44d | 1 | 0.53mi |
| 465 Craft St Unit B Macon, GA | 1.0 | 1.0 | 275 | $600 | $2.18 | 13d | 1 | 0.54mi |
| 848 Hillyer Ave Unit A Macon, GA | 1.0 | 1.0 | 310 | $650 | $2.10 | 21d | 1 | 0.56mi |
| 285 Moughon St Macon, GA | 3.0 | 1.0 | 1015 | $900 | $0.89 | 13d | 1 | 0.61mi |
| 2694 Cherokee Ave Unit A Macon, GA | 3.0 | 1.5 | 1985 | $1,250 | $0.63 | 44d | 1 | 0.61mi |
| 1025 Hillyer Ave Macon, GA | 3.0 | 2.0 | 1738 | $1,800 | $1.04 | 21d | 1 | 0.66mi |
| 2755 Vineville Ave Unit B Macon, GA | 3.0 | 2.0 | 900 | $1,375 | $1.53 | 44d | 1 | 0.67mi |
| 2763 Vineville Ave Macon, GA | 1.0 | 1.0 | 900 | $900 | $1.00 | 44d | 1 | 0.68mi |
| 328 Rogers Ave Macon, GA | 3.0 | 2.0 | 1355 | $1,200 | $0.89 | 44d | 1 | 0.69mi |
| 1020 Adams St Unit 3 Macon, GA | 2.0 | 1.0 | — | $1,020 | — | 44d | 1 | 0.71mi |
| 1020 Adams St Unit 1 Macon, GA | 2.0 | 1.0 | — | $950 | — | 44d | 1 | 0.71mi |
| 2370 Rogers Pl Macon, GA | 2.0 | 1.0 | 832 | $925 | $1.11 | 44d | 1 | 0.75mi |
| 919 Inverness Ave Macon, GA | 3.0 | 2.0 | 1676 | $1,549 | $0.92 | 21d | 1 | 0.79mi |
| 864 Tattnall St Macon, GA | 2.0 | 1.0 | 640 | $800 | $1.25 | 44d | 1 | 0.80mi |
| 2140 Ingleside Ave Macon, GA | 2.0 | 1.0 | — | $975 | — | 21d | 1 | 0.82mi |
Listing history 17 events
-
2026-06-19days on market $349,000 Active 46 DOM
-
2026-06-18days on market $349,000 Active 45 DOM
-
2026-06-17days on market $349,000 Active 44 DOM
-
2026-06-16days on market $349,000 Active 43 DOM
-
2026-06-15days on market $349,000 Active 42 DOM
-
2026-06-14days on market $349,000 Active 40 DOM
-
2026-06-13days on market $349,000 Active 39 DOM
-
2026-06-10days on market $349,000 Active 37 DOM
-
2026-06-09days on market $349,000 Active 36 DOM
-
2026-06-09days on market $349,000 Active 35 DOM
-
2026-06-07days on market $349,000 Active 34 DOM
-
2026-06-03days on market $349,000 Active 30 DOM
-
2026-06-02days on market $349,000 Active 29 DOM
-
2026-06-01days on market $349,000 Active 28 DOM
-
2026-05-31days on market $349,000 Active 27 DOM
-
2026-05-30days on market $349,000 Active 26 DOM
-
2026-05-04$349,000 New 1806-char remark
ⓘ Source: listings_history table (triggers on properties + properties_extension) + one-shot
backfill from property_details.listing_events for pre-trigger history.
Climate risk First Street
- Flood 9/10 Extreme FEMA zone X (unshaded) · 98% chance over 30 yrs
- Wildfire 1/10 Low
- Heat 7/10 Severe 7 d/yr ≥108°F today · 17 d/yr by 30 yrs out
- Wind 6/10 Major 66% chance of damaging wind over 30 yrs
- Air quality 3/10 Moderate 3 unhealthy d/yr today · 4 by 30 yrs out
Nearby sold comps map
Loading sold comps map…
Walkable amenities ~0.75 mi
Loading nearby amenities…
Taxation est. · year 1
- Rental income
- $51,432
- − Mortgage interest
- −$19,549
- − Property taxes
- −$5,235
- − Insurance
- −$2,542
- − Repairs & maintenance
- −$4,115
- − Management
- −$4,115
- − Depreciation
- −$10,153
- Taxable income
- $5,723
- Est. tax owed @ 24.0%
- −$1,374
- After-tax cash flow
- $9,518/yr
For passive investors: Depreciation is non-cash, so a rental often shows a tax loss while cash-flowing — sheltering income. Rental losses are passive: they offset passive income freely, and up to $25,000/yr can offset ordinary (W-2) income if you actively participate and your MAGI is under $100k (phasing out to $0 by $150k); unused losses carry forward. On sale, claimed depreciation is recaptured at up to 25%, and gains may owe capital-gains tax (a 1031 exchange can defer both). Figures are a year-1 estimate at your 24.0% rate — not tax advice; consult a CPA.
Condition & rehab AI · 13 photos
This multi-family property requires moderate renovations to improve its condition and increase its resale and rental value. Key areas for improvement include painting, flooring, siding, windows, and landscaping.
Repairs flagged
- Major Paint — Paint appears faded and needs repainting.
- Major Flooring — Hardwood floors show significant wear and need refinishing.
- Major Exterior Siding — Siding shows signs of wear and may need repainting or replacement.
- Major Windows — Windows frames show wear and may need repainting or replacement.
- Major Kitchen Countertops — Countertops show signs of wear and may need replacement or resurfacing.
- Major Bathroom Fixtures — Fixtures show signs of wear and may need replacement or refurbishing.
- Major HVAC Components — Components show signs of wear and may need replacement or repair.
- Major Landscaping — Landscaping could benefit from updates to enhance curb appeal and maintain a more attractive appearance.
Value-add opportunities
- Both Painting — Fresh paint can improve the home's appearance and increase its value.
- Both Floor Refinishing — Refinished hardwood floors can enhance the home's appeal and increase its value.
- Both Siding Repainting or Replacement — Updated siding can improve the home's curb appeal and increase its value.
- Both Window Repainting or Replacement — Updated windows can improve the home's curb appeal and increase its value.
- Both Kitchen Countertop Replacement or Resurfacing — Updated countertops can improve the home's functionality and increase its value.
- Both Bathroom Fixture Replacement or Refurbishing — Updated fixtures can improve the home's functionality and increase its value.
- Both HVAC Component Replacement or Repair — Updated HVAC components can improve the home's comfort and increase its value.
- Both Landscaping Updates — Updated landscaping can improve the home's curb appeal and increase its value.
Renovation cost estimate screening
| Repair item | Severity | Est. cost |
|---|---|---|
| Paint · Paint appears faded and needs repainting. | Major | $15,000–50,000 |
| Flooring · Hardwood floors show significant wear and need refinishing. | Major | $15,000–50,000 |
| Exterior Siding · Siding shows signs of wear and may need repainting or replacement. | Major | $15,000–50,000 |
| Windows · Windows frames show wear and may need repainting or replacement. | Major | $15,000–50,000 |
| Kitchen Countertops · Countertops show signs of wear and may need replacement or resurfacing. | Major | $15,000–50,000 |
| Bathroom Fixtures · Fixtures show signs of wear and may need replacement or refurbishing. | Major | $15,000–50,000 |
| HVAC Components · Components show signs of wear and may need replacement or repair. | Major | $15,000–50,000 |
| Landscaping · Landscaping could benefit from updates to enhance curb appeal and maintain a more attractive appearance. | Major | $15,000–50,000 |
| Total estimated repair cost · 8 items | $120,000–400,000 |
Value-add ROI direction
- Both Painting — Fresh paint can improve the home's appearance and increase its value. ↑
- Both Floor Refinishing — Refinished hardwood floors can enhance the home's appeal and increase its value. ↑
- Both Siding Repainting or Replacement — Updated siding can improve the home's curb appeal and increase its value. ↑
- Both Window Repainting or Replacement — Updated windows can improve the home's curb appeal and increase its value. ↑
- Both Kitchen Countertop Replacement or Resurfacing — Updated countertops can improve the home's functionality and increase its value. ↑
- Both Bathroom Fixture Replacement or Refurbishing — Updated fixtures can improve the home's functionality and increase its value. ↑
- Both HVAC Component Replacement or Repair — Updated HVAC components can improve the home's comfort and increase its value. ↑
- Both Landscaping Updates — Updated landscaping can improve the home's curb appeal and increase its value. ↑
ⓘ Cost ranges are severity-bucket heuristics (US national rule-of-thumb). Get contractor quotes + a written scope before underwriting a rehab budget.
Schools (NCES district)
- District
- Bibb County
- NCES district ID
- 1300420
- Math proficiency
- 11% ▼ -14.00%
- Reading proficiency
- 18% ▼ -11.00%
- Median HH income
- $37,426
- Composite
- 12.13/100
- National rank
- #9654
- State rank
- #161 of 174 in GA
Livability — Macon-Bibb County
No livability data for this city. (Only ~50 U.S. cities are tracked.)
Census & demographics
- Census place
- Macon-Bibb County, GA
- County
- Bibb County · 164,332 people
- City population
- 143,186
- Metro
- Macon-Bibb County, GA
- Population (ZIP)
- 32,421
- Household income
- $38,784
- Rent vs Own
- Severe rent burden
- 2674.0
Population outlook (Bibb County) Hauer SSP2
- Today (2025)
- 148,772 people
- By 2030
- 145,904 · -1.9%
- By 2040
- 139,404 · -6.3%
- By 2050
- 131,603 · -11.5%
- By 2075
- 111,050 · -25.4%
- By 2100
- 83,346 · -44.0%
Race, ethnicity, and origin ACS 2023
- Neighborhood character
- Predominantly Black (65%)
- Race & ethnicity
- Black 65% White 28% Hispanic / Latino 3% Two or more races 2% Asian 1%
- Common ancestry
- Serbian 2% Slovak 1% Lithuanian 1%
- Foreign-born
- 2% · Canada
- Languages at home
- 96% English-only · Spanish 2% French/Haitian/Cajun 1%
Political lean MEDSL · Bibb
- 2024 margin
- Strong D (+22.4) · D 61.0% · R 38.5%
- 2008→2024 swing
- +4.4pp toward D · 2008: 18.0pp · 2024: 22.4pp
- All cycles
- 2024: D+22.4 2020: D+23.8 2016: D+20.2 2012: D+20.0 2008: D+18.0
Not yet ingested
- Civics
- —
Market trends
- HPI YoY
- ▼ -135.44%
- Current HPI
- 194.5459
- Rent YoY
- ▲ 4.61%
- Metro
- Macon-Bibb County, GA
- State GDP YoY
- ▲ 2.66%
- F500 in state
- 28
Industry mix (Fortune 500 HQ in GA)
| Industry | F500 HQs | Revenue |
|---|---|---|
| Paper / Packaging | 2 | $29B |
|
||
| Retail | 1 | $160B |
|
||
| Transportation / Logistics | 1 | $91B |
|
||
| Airlines | 1 | $62B |
|
||
| Consumer Goods | 1 | $47B |
|
||
| Utilities | 1 | $25B |
|
||
Price history
1 event — show timeline
- 2026-05-04 Listed $349,000 GAMLS
Cash-flow waterfall
monthlySold comps — $/sqft
last 12 mo · ≤1 miLoading sold comps…